Technical audit report of Jurmala WWTP - PURE project
Technical audit report of Jurmala WWTP - PURE project
Technical audit report of Jurmala WWTP - PURE project

Create successful ePaper yourself
Turn your PDF publications into a flip-book with our unique Google optimized e-Paper software.
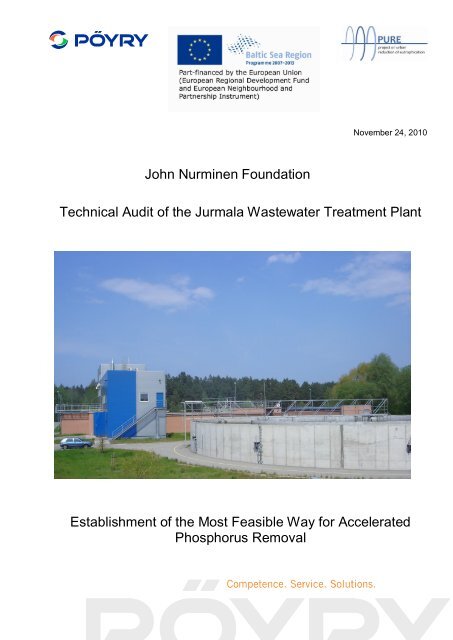
November 24, 2010<br />
John Nurminen Foundation<br />
<strong>Technical</strong> Audit <strong>of</strong> the <strong>Jurmala</strong> Wastewater Treatment Plant<br />
Establishment <strong>of</strong> the Most Feasible Way for Accelerated<br />
Phosphorus Removal
<strong>Technical</strong> Audit <strong>of</strong> the <strong>Jurmala</strong> Wastewater Treatment Plant<br />
i<br />
Table <strong>of</strong> Contents<br />
1 INTRODUCTION ...............................................................................................................................................1<br />
1.1 BACKGROUND...............................................................................................................................................1<br />
1.2 OBJECTIVES OF THE PROJECT .........................................................................................................................1<br />
2 JURMALA WASTEWATER TREATMENT PLANT.......................................................................................2<br />
2.1<br />
2.2<br />
GENERAL......................................................................................................................................................2<br />
WASTEWATER FLOWS AND LOADS .................................................................................................................2<br />
2.2.1 Wastewater flow......................................................................................................... 3<br />
2.2.2 Wastewater loads........................................................................................................ 4<br />
2.2.3 Temperature............................................................................................................... 8<br />
2.3 TREATMENT REQUIREMENTS AND STATE OF NUTRIENT REMOVAL....................................................................9<br />
2.4 PROCESS DESCRIPTION................................................................................................................................. 11<br />
2.5 OPERATION................................................................................................................................................. 12<br />
2.5.1 Operation practice .................................................................................................... 12<br />
2.5.2 Loading <strong>of</strong> the activated sludge process.................................................................... 17<br />
2.5.3 Phosphorus balance .................................................................................................. 18<br />
2.5.4 Typical operational problems ................................................................................... 18<br />
3 ANALYSIS AND PROPOSED IMPROVEMENTS......................................................................................... 19<br />
3.1 ANALYSIS OF PLANT CONDITIONS................................................................................................................. 19<br />
3.1.1 <strong>Technical</strong> conditions and performance...................................................................... 19<br />
3.1.2 Design issues............................................................................................................ 20<br />
3.1.3 Process stability and operational problems................................................................ 21<br />
3.2 RECOMMENDED ACTIONS ............................................................................................................................ 21<br />
3.2.1 General..................................................................................................................... 21<br />
3.2.2 Operation <strong>of</strong> existing units........................................................................................ 22<br />
3.2.3 New investments ...................................................................................................... 23<br />
3.3 DIMENSIONING, IMPLEMENTATION AND OPERATION OF NEW UNITS................................................................ 24<br />
3.3.1 New polymer station................................................................................................. 24<br />
3.3.2 Online measurements and analyses........................................................................... 24<br />
3.3.3 Modification <strong>of</strong> the anaerobic zone........................................................................... 25<br />
3.3.4 Improved aeration control......................................................................................... 25<br />
Annexes<br />
1. 16WWE0473-PI-7001 PI diagram, grit removal<br />
2. 16WWE0473-PI-7002 PI diagram, aeration<br />
3. 16WWE0473-PI-7003 PI diagram, sludge treatment<br />
4. 16WWE0473-ME-3001 Mechanical drawing, aeration line 1<br />
5. 16WWE0473-ME-3002 Mechanical drawing, aeration line 2<br />
Part-financed by the European Union (European Regional Development Fund and<br />
European Neighbourhood and Partnership Instrument)
<strong>Technical</strong> Audit <strong>of</strong> the <strong>Jurmala</strong> Wastewater Treatment Plant<br />
ii<br />
DISCLAIMER<br />
This <strong>report</strong> has been prepared by Pöyry Finland Oy (“Pöyry”) for John Nurminen<br />
Foundation (the “Recipient”), in accordance with the Agreement between Pöyry and the<br />
Recipient.<br />
Any reliance any party other than the Recipient chooses to place on the information<br />
contained in the <strong>report</strong> is a matter <strong>of</strong> such party’s judgment exclusively and solely at<br />
such party’s own risk. Pöyry assumes no responsibility for any actions (or lack there<strong>of</strong>)<br />
taken by any party as a result <strong>of</strong> relying on or in any way using any information<br />
contained in the <strong>report</strong> and in no event shall Pöyry be liable for any damages <strong>of</strong><br />
whatsoever nature resulting from reliance on or use <strong>of</strong> such information.<br />
No representation or warranty, express or implied, is made by Pöyry as to the accuracy<br />
or completeness <strong>of</strong> any <strong>of</strong> the information contained in the <strong>report</strong> and nothing in the<br />
<strong>report</strong> is or shall be relied upon as a promise or representation as to the future.<br />
All rights to this <strong>report</strong> are reserved and exclusively defined in the Agreement between<br />
Pöyry and the Recipient.<br />
Part-financed by the European Union (European Regional Development Fund and<br />
European Neighbourhood and Partnership Instrument)
<strong>Technical</strong> Audit <strong>of</strong> the <strong>Jurmala</strong> Wastewater Treatment Plant<br />
24.11.2010<br />
1<br />
1 INTRODUCTION<br />
1.1 Background<br />
The John Nurminen Foundation, the Union <strong>of</strong> the Baltic Cities Commission on<br />
Environment and HELCOM (Baltic Marine Environment Protection Commission) have<br />
agreed to work together in order to improve the state <strong>of</strong> the Baltic Sea. In that purpose<br />
the Parties have applied and received financing from EU Baltic Sea Region<br />
Programme 2007-2013 for a three-year <strong>project</strong> called “<strong>PURE</strong>” (Project on Urban<br />
Reduction <strong>of</strong> Eutrophication), started in December <strong>of</strong> 2009. The objective <strong>of</strong> the <strong>project</strong><br />
“<strong>PURE</strong>” is to reduce phosphorus discharges to the Baltic Sea by enhancing<br />
phosphorus removal at municipal wastewater treatment plants and also improve the<br />
knowledge on best available techniques on phosphorus removal in cities and water<br />
companies around the Baltic Sea. The “<strong>PURE</strong>” <strong>project</strong> was approved by the EU<br />
BSRP Monitoring Committee on 16th September 2009.<br />
The ‘<strong>PURE</strong>’ <strong>project</strong> partners also include the following cities and/or water<br />
companies: Brest Vodokanal, city <strong>of</strong> Gdansk, <strong>Jurmala</strong> Water, Kohtla-Järve Water<br />
Company (Järve Biopuhastus OÜ) and Szczecin Water Company. The cities and/or<br />
water companies have agreed that a technical <strong>audit</strong> will be carried out at their<br />
wastewater treatment plants in order to assess the feasibility and cost efficiency<br />
<strong>of</strong> enhanced, chemical phosphorus removal and other low cost options to reduce<br />
phosphorus discharges to receiving waters. The Project Partners intend to achieve an<br />
average annual concentration <strong>of</strong> 0.5 mg phosphorus / litre in effluent waste water<br />
on continuous basis. Also investments to achieve this value are included in the <strong>project</strong><br />
‘<strong>PURE</strong>’ at the wastewater treatment plants <strong>of</strong> Brest and <strong>Jurmala</strong>, starting in 2011. The<br />
Project will be carried out in harmony with the national legislation, rules and<br />
environmental regulations <strong>of</strong> each participant and EU.<br />
1.2 Objectives <strong>of</strong> the <strong>project</strong><br />
The overall objectives <strong>of</strong> the assignment are<br />
to review the current wastewater and sludge treatment processes especially in terms<br />
<strong>of</strong> phosphorus removal,<br />
to develop the most cost effective plan to enhance phosphorus removal to the level <strong>of</strong><br />
0.5 mg/l and<br />
to estimate additional O&M costs required by the enhanced treatment.<br />
In addition, the specific objectives for the implementation <strong>of</strong> the recommended<br />
investments are<br />
to implement the works without stoppage the operation <strong>of</strong> the <strong>WWTP</strong> as a whole,<br />
creating as little disturbance to the operation as possible<br />
to implement the works without any wastewater overflows to the recipient and<br />
to implement civil, mechanical, electrical and automation works in accordance to EU<br />
norms and regulations<br />
Part-financed by the European Union (European Regional Development Fund and<br />
European Neighbourhood and Partnership Instrument)
<strong>Technical</strong> Audit <strong>of</strong> the <strong>Jurmala</strong> Wastewater Treatment Plant<br />
24.11.2010<br />
2<br />
The proposed technical solutions and investments for each <strong>WWTP</strong> shall be in line with<br />
the current status <strong>of</strong> each <strong>WWTP</strong>, agreed by the target <strong>WWTP</strong>s and based on low<br />
cost/high impact approach.<br />
2 JURMALA WASTEWATER TREATMENT PLANT<br />
2.1 General<br />
The <strong>Jurmala</strong> wastewater treatment plant (<strong>WWTP</strong>) is situated in the Sloka region, on the<br />
bank <strong>of</strong> the Lielupe river. Approximately 74 % <strong>of</strong> the wastewater formed in the town <strong>of</strong><br />
<strong>Jurmala</strong> (population 56 000) is directed into sewers. Of this amount, the Sloka plant<br />
treats approximately 70 %, and the rest is pumped to the Daugavgriva <strong>WWTP</strong> in Riga.<br />
In addition, approximately 90 % <strong>of</strong> the septic tank sludges collected in <strong>Jurmala</strong> are<br />
transported to the Sloka <strong>WWTP</strong>.<br />
The plant has conventional primary treatment without primary sedimentation, activated<br />
sludge process for enhanced biological phosphorus and nitrogen removal and sludge<br />
treatment by mechanical thickening and dewatering.<br />
The plant was built in 2007 and put into operation in 2008. The constructor has not<br />
commissioned the plant, because all guarantee values have not yet been met. The<br />
personnel <strong>of</strong> <strong>Jurmala</strong>s Udens are running the plant according to the instructions given<br />
by the constructor.<br />
2.2 Wastewater flows and loads<br />
The purpose <strong>of</strong> the <strong>audit</strong> is to propose measures to enhance nutrient removal and<br />
process stability primarily within the existing process tanks. Therefore, the investments<br />
to be planned will be based partly on the original dimensioning parameters, and partly<br />
on the existing wastewater loads and flows, namely the average influent values from the<br />
year 2009. These data are presented and analysed below in this chapter.<br />
The wastewater is practically entirely <strong>of</strong> municipal origin. No significant industrial<br />
loaders are known.<br />
The basic figures describing the wastewater amount and quality are presented in Table<br />
2.1. Person equivalent values have been calculated on the basis <strong>of</strong> the BOD 5 load,<br />
assuming 1 P.E. = 0,06 kgBOD 5 /p.e./d. The design flow has been calculated as follows:<br />
where<br />
q design = k d * Q average / t d<br />
q design = design flow, m 3 /h<br />
k d = 1,3<br />
t d = 16 h<br />
For comparison, also the original dimensioning values <strong>of</strong> the plant (YIT Environment<br />
Ltd, 2007) are given in Table 2.1.<br />
Part-financed by the European Union (European Regional Development Fund and<br />
European Neighbourhood and Partnership Instrument)
<strong>Technical</strong> Audit <strong>of</strong> the <strong>Jurmala</strong> Wastewater Treatment Plant<br />
24.11.2010<br />
3<br />
Table 2.1. Wastewater data, <strong>Jurmala</strong> <strong>WWTP</strong><br />
Parameter Unit Dimensioning value* Average 2009<br />
Population ca 32 440 28 780<br />
Specific flow production l/ca/d 277 259<br />
Q average<br />
m 3 /d 9 000 7 450<br />
Q max<br />
m 3 /d 18 000 13 530<br />
q design/average 2009<br />
m 3 /h 500 310<br />
BOD 5 kg/d 2 140 1 525<br />
g/ca/d 66 53<br />
mg/l 238 200<br />
COD Cr kg/d 4 460 4 189<br />
g/ca/d 137 146<br />
mg/l 496 560<br />
Suspended solids kg/d 2 320 1 479<br />
g/ca/d 72 51<br />
mg/l 258 200<br />
Total nitrogen kg/d 480 396<br />
g/ca/d 15 14<br />
mg/l 53 53<br />
Total phosphorus kg/d 80 56<br />
g/ca/d 2 1.9<br />
mg/l 8.9 7.0<br />
Temperature, max °C >15 18.5<br />
Temperature, min °C 10 9<br />
*) YIT Environment Ltd, 2007, design year 2015<br />
The loading will increase slightly in the future when the sewer network is expanded.<br />
The expected increase in the number <strong>of</strong> customers is approximately 10 %.<br />
2.2.1 Wastewater flow<br />
Influent wastewater flow varied from 5 300 m 3 /d to 13 500 m 3 /d. The yearly average<br />
was 7 450 m 3 /d. Only 2 % <strong>of</strong> the daily flow values exceeded the dimensioning flow<br />
value <strong>of</strong> 12 000 m 3 /d. The influent flow during 2009 is shown in Figure 2.1<br />
Part-financed by the European Union (European Regional Development Fund and<br />
European Neighbourhood and Partnership Instrument)
<strong>Technical</strong> Audit <strong>of</strong> the <strong>Jurmala</strong> Wastewater Treatment Plant<br />
24.11.2010<br />
4<br />
16 000<br />
14 000<br />
12 000<br />
10 000<br />
m 3 /d<br />
8 000<br />
6 000<br />
4 000<br />
2 000<br />
0<br />
Jan-<br />
09<br />
Feb-<br />
09<br />
Mar-<br />
09<br />
Apr-<br />
09<br />
May-<br />
09<br />
Jun-<br />
09<br />
Jul-<br />
09<br />
Aug-<br />
09<br />
Sep-<br />
09<br />
Oct-<br />
09<br />
Nov-<br />
09<br />
Dec-<br />
09<br />
Figure 2.1. Influent wastewater flow, 2009.<br />
Flow Dimensioning flow Sorted flow<br />
The flow time curve shows a long period <strong>of</strong> rains and/or snow melting in March – April<br />
and individual rains in the summer. No significant increase <strong>of</strong> wastewater amounts is<br />
shown during the holiday season.<br />
2.2.2 Wastewater loads<br />
Organic load<br />
The influent organic load was measured by BOD 5 - measurements twice a week and by<br />
COD Cr -measurements five times a week. BOD 5 - load and concentration varied as shown<br />
in Table 2.2.The highest 10 % <strong>of</strong> the measurements exceeded the dimensioning BOD 5 -<br />
value <strong>of</strong> 2 140 kg/d. The influent BOD 5 - load during 2009 is shown in Figure 2.2.<br />
Table 2.2 BOD 5 load and concentrations, 2009<br />
BOD 5 Average Min Max<br />
Concentration (mg/l) 213 77 400<br />
Load (kg/d) 1 525 213 2 665<br />
Part-financed by the European Union (European Regional Development Fund and<br />
European Neighbourhood and Partnership Instrument)
<strong>Technical</strong> Audit <strong>of</strong> the <strong>Jurmala</strong> Wastewater Treatment Plant<br />
24.11.2010<br />
5<br />
3 000<br />
2 500<br />
2 000<br />
kg BOD 5 /d<br />
1 500<br />
1 000<br />
500<br />
0<br />
Jan-<br />
09<br />
Feb-<br />
09<br />
Mar-<br />
09<br />
Apr-<br />
09<br />
May-<br />
09<br />
Jun-<br />
09<br />
Jul-<br />
09<br />
Aug-<br />
09<br />
Sep-<br />
09<br />
Oct-<br />
09<br />
Nov-<br />
09<br />
Dec-<br />
09<br />
BOD5 load Dimensioning BOD5 load Sorted BOD5 load<br />
Figure 2.2. Influent BOD 5 load, 2009.<br />
COD Cr - load and concentration varied as shown in Table 2.3. The highest 30 % <strong>of</strong> the<br />
measurements exceeded the dimensioning COD Cr -value <strong>of</strong> 4 460 kg/d. The influent<br />
COD Cr - load during 2009 is shown in Figure 2.3.<br />
Table 2.3 COD Cr load and concentrations, 2009.<br />
COD Cr Average Min Max<br />
Concentration (mg/l) 579 285 925<br />
Load (kg/d) 4 189 2 680 7 783<br />
9 000<br />
8 000<br />
7 000<br />
6 000<br />
kg COD/d<br />
5 000<br />
4 000<br />
3 000<br />
2 000<br />
1 000<br />
0<br />
Jan-<br />
09<br />
Feb-<br />
09<br />
Mar-<br />
09<br />
Apr-<br />
09<br />
May-<br />
09<br />
Jun-<br />
09<br />
Jul-09 Aug-<br />
09<br />
Sep-<br />
09<br />
Oct-<br />
09<br />
Nov-<br />
09<br />
Dec-<br />
09<br />
COD-load Dimensioning COD-load Sorted COD-load<br />
Figure 2.3. Influent COD Cr load, 2009.<br />
Part-financed by the European Union (European Regional Development Fund and<br />
European Neighbourhood and Partnership Instrument)
<strong>Technical</strong> Audit <strong>of</strong> the <strong>Jurmala</strong> Wastewater Treatment Plant<br />
24.11.2010<br />
6<br />
Apparently the COD/BOD ratio <strong>of</strong> the influent wastewater is higher than expected in<br />
the dimensioning calculations, since the dimensioning values <strong>of</strong> COD are exceeded<br />
more <strong>of</strong>ten than the dimensioning values for BOD. As shown in Figure 2.4, the<br />
COD/BOD ratio varies very much, which may be induced by the discharges <strong>of</strong> septic<br />
tank sludges. The average value <strong>of</strong> 2,8 indicates that the organic carbon in the influent is<br />
primarily <strong>of</strong> slowly biodegradable type.<br />
6<br />
5<br />
4<br />
COD/BOD [-]<br />
3<br />
2<br />
1<br />
0<br />
Jan-<br />
09<br />
Feb-<br />
09<br />
Mar-<br />
09<br />
Apr-<br />
09<br />
May-<br />
09<br />
Jun-<br />
09<br />
Jul-09 Aug-<br />
09<br />
Sep-<br />
09<br />
Oct-<br />
09<br />
Nov-<br />
09<br />
Dec-<br />
09<br />
COD/BOD<br />
Sorted COD/BOD<br />
Figure 2.4. COD/BOD ratio, 2009.<br />
On average, the BOD and COD loads stay on the same levels throughout the year. It<br />
seems evident that most <strong>of</strong> the wastewater from the holiday resort facilities is not<br />
directed to the <strong>WWTP</strong>, because no significant increase in load can be seen during the<br />
summer months. The fairly high day-by-day fluctuation <strong>of</strong> organic load may be<br />
connected to septic tank sludge deliveries.<br />
Nutrient loads<br />
Influent nutrient concentrations were measured five times a week. Influent phosphorus<br />
concentrations in <strong>Jurmala</strong> <strong>WWTP</strong> were typical values <strong>of</strong> municipal wastewater varying<br />
as shown in Table 2.4. The measured phosphorus load was mainly below the<br />
dimensioning P-value <strong>of</strong> 80 kg/d. The influent P- load during 2009 is shown in Figure<br />
2.5.<br />
Table 2.4. Influent phosphorus load and concentrations, 2009<br />
Phosphorus Average Min Max<br />
Concentration (mg/l) 7.7 4.2 10.9<br />
Load (kg/d) 56 39 87<br />
Part-financed by the European Union (European Regional Development Fund and<br />
European Neighbourhood and Partnership Instrument)
<strong>Technical</strong> Audit <strong>of</strong> the <strong>Jurmala</strong> Wastewater Treatment Plant<br />
24.11.2010<br />
7<br />
100<br />
90<br />
80<br />
70<br />
kg P/d<br />
60<br />
50<br />
40<br />
30<br />
20<br />
10<br />
0<br />
Jan-<br />
09<br />
Feb-<br />
09<br />
Mar-<br />
09<br />
Apr-<br />
09<br />
May-<br />
09<br />
Jun-<br />
09<br />
Jul-<br />
09<br />
Aug-<br />
09<br />
Sep-<br />
09<br />
Oct-<br />
09<br />
Nov-<br />
09<br />
Dec-<br />
09<br />
Ptot load Dimensioning Ptot load Sorted Ptot load<br />
Figure 2.5. Influent phosphorus load, 2009.<br />
Influent nitrogen concentrations in <strong>Jurmala</strong> <strong>WWTP</strong> varied as shown in Table 2.5.<br />
Occasionally the nitrogen concentrations were higher than typical values for municipal<br />
wastewater; 25 % <strong>of</strong> the measured concentrations were above 60 mg N/l. However, only<br />
5 % <strong>of</strong> the measured load values exceeded the dimensioning load <strong>of</strong> 480 kgN/d. The<br />
influent N- load during 2009 is shown in Figure 2.6. Typical BOD 5 /N-ratio in influent<br />
wastewater was 3,9.<br />
Table 2.5. Influent nitrogen load and concentrations, 2009<br />
Nitrogen Average Min Max<br />
Concentration (mg/l) 55 29 99<br />
Load (kg/d) 396 279 695<br />
800<br />
700<br />
600<br />
500<br />
kg N/d<br />
400<br />
300<br />
200<br />
100<br />
0<br />
Jan-<br />
09<br />
Feb-<br />
09<br />
Mar-<br />
09<br />
Apr-<br />
09<br />
May-<br />
09<br />
Jun-<br />
09<br />
Jul-<br />
09<br />
Aug-<br />
09<br />
Sep-<br />
09<br />
Oct-<br />
09<br />
Nov-<br />
09<br />
Dec-<br />
09<br />
Ntot load Dimensioning Ntot load Sorted Ntot load<br />
Figure 2.6. Influent nitrogen load, 2009.<br />
Part-financed by the European Union (European Regional Development Fund and<br />
European Neighbourhood and Partnership Instrument)
<strong>Technical</strong> Audit <strong>of</strong> the <strong>Jurmala</strong> Wastewater Treatment Plant<br />
24.11.2010<br />
8<br />
Suspended solids<br />
Influent suspended solid concentrations were measured five times a week. The loads<br />
and concentrations in <strong>Jurmala</strong> <strong>WWTP</strong> varied as shown in Table 2.6. The dimensioning<br />
value <strong>of</strong> 2 320 kg SS/d was exceeded in 5 % <strong>of</strong> the measurements. The influent SS- load<br />
during 2009 is shown in Figure 2.7.<br />
Table 2.6. Influent suspended solid loads and concentrations, 2009<br />
Suspended solids Average Min Max<br />
Concentration (mg/l) 207 58 579<br />
Load (kg/d) 1 479 418 3 985<br />
4 500<br />
4 000<br />
3 500<br />
3 000<br />
kg SS/d<br />
2 500<br />
2 000<br />
1 500<br />
1 000<br />
500<br />
0<br />
Jan-<br />
09<br />
Feb-<br />
09<br />
Mar-<br />
09<br />
Apr-<br />
09<br />
May-<br />
09<br />
Jun-<br />
09<br />
Jul-<br />
09<br />
Aug-<br />
09<br />
Sep-<br />
09<br />
Oct-<br />
09<br />
Nov-<br />
09<br />
Dec-<br />
09<br />
SS load Dimensioning SS load Sorted SS load<br />
Figure 2.7. Influent suspended solids load, 2009.<br />
2.2.3 Temperature<br />
Influent wastewater temperature ranged from 9,0 to 18,6 o C and was on average 13,9<br />
o C. 11 % <strong>of</strong> values were under the dimensioning temperature <strong>of</strong> 10 o C (Figure 2.8).<br />
Part-financed by the European Union (European Regional Development Fund and<br />
European Neighbourhood and Partnership Instrument)
<strong>Technical</strong> Audit <strong>of</strong> the <strong>Jurmala</strong> Wastewater Treatment Plant<br />
24.11.2010<br />
9<br />
20<br />
18<br />
16<br />
14<br />
12<br />
o C<br />
10<br />
8<br />
6<br />
4<br />
2<br />
0<br />
Jan-<br />
09<br />
Feb-<br />
09<br />
Mar-<br />
09<br />
Apr-<br />
09<br />
May-<br />
09<br />
Jun-<br />
09<br />
Jul-<br />
09<br />
Aug-<br />
09<br />
Sep-<br />
09<br />
Oct-<br />
09<br />
Nov-<br />
09<br />
Dec-<br />
09<br />
T T, sorted T, dimensioning minimum<br />
Figure 2.8. Influent wastewater temperature, 2009.<br />
2.3 Treatment requirements and state <strong>of</strong> nutrient removal<br />
The required quality (guarantee values) <strong>of</strong> effluent wastewater and the achieved average<br />
values from the year 2009 are shown in Table 2.7. The aim is to reach the required<br />
results at all times. In this table, the results are compared both to the current demands<br />
and to the recommendations <strong>of</strong> HELCOM.<br />
Table 2.7. Achieved effluent quality compared to demands and HELCOM<br />
recommendations, 2009<br />
Parameter<br />
Demand<br />
HELCOM recommendations Achieved (average 2009)<br />
mg/l mg/l % mg/l %<br />
Suspended solids 35 - - 3 99<br />
COD Cr 125 - - 40 80<br />
BOD 5 25 15 80 4 98<br />
Total nitrogen 15 15 70 - 80 15 72<br />
Total phosphorus 2 0.5 90 0.35 95<br />
The required effluent concentrations were achieved well throughout the year for all<br />
parameters except total nitrogen. The total nitrogen levels were higher than the demands<br />
during certain months <strong>of</strong> the year due to incomplete nitrification. Total nitrogen in<br />
effluent wastewater varied between 17 – 25 mg/l from January 2009 to April 2009, and<br />
nitrification rate during that time was around 70 %. Complete nitrification was achieved<br />
by May 2009 and nitrogen requirements (15 mg N/l) were fulfilled during rest <strong>of</strong> the<br />
year. The effluent nitrogen concentrations are shown in Figure 2.9.<br />
Part-financed by the European Union (European Regional Development Fund and<br />
European Neighbourhood and Partnership Instrument)
<strong>Technical</strong> Audit <strong>of</strong> the <strong>Jurmala</strong> Wastewater Treatment Plant<br />
24.11.2010<br />
10<br />
40<br />
35<br />
30<br />
25<br />
mg N/l<br />
20<br />
15<br />
10<br />
5<br />
0<br />
Jan-<br />
09<br />
Feb-<br />
09<br />
Mar-<br />
09<br />
Apr-<br />
09<br />
May-<br />
09<br />
Jun-<br />
09<br />
Jul-09 Aug-<br />
09<br />
Sep-<br />
09<br />
Oct-<br />
09<br />
Nov-<br />
09<br />
Dec-<br />
09<br />
Ntot NH4-N NO3-N Plant demand = HELCOM recomm.<br />
Figure 2.9. Effluent nitrogen concentrations, 2009.<br />
Phosphorus requirements were reached without difficulties. The reached levels were<br />
clearly below the target value <strong>of</strong> < 2 mg P/l as shown in Figure 2.10. The HELCOM<br />
recommendation <strong>of</strong> 0,5 mg/l was occasionally exceeded. The highest effluent P-<br />
concentration 2009 was 1,72 mg/l.<br />
2.00<br />
1.75<br />
1.50<br />
1.25<br />
mg P/l<br />
1.00<br />
0.75<br />
0.50<br />
0.25<br />
0.00<br />
Jan-<br />
09<br />
Feb-<br />
09<br />
Mar-<br />
09<br />
Apr-<br />
09<br />
May-<br />
09<br />
Jun-<br />
09<br />
Jul-<br />
09<br />
Aug-<br />
09<br />
Sep-<br />
09<br />
Oct-<br />
09<br />
Nov-<br />
09<br />
Dec-<br />
09<br />
Ptot HELCOM recomm. Plant demand<br />
Figure 2.10. Effluent total phosphorus concentrations, 2009.<br />
The effluent values <strong>of</strong> suspended solids and organic matter measures as BOD 5 and<br />
COD Cr were clearly below effluent requirements throughout the year.<br />
Part-financed by the European Union (European Regional Development Fund and<br />
European Neighbourhood and Partnership Instrument)
<strong>Technical</strong> Audit <strong>of</strong> the <strong>Jurmala</strong> Wastewater Treatment Plant<br />
24.11.2010<br />
11<br />
2.4 Process description<br />
The technical and aspects <strong>of</strong> the process are described here concisely. A more detailed<br />
description can be found in the laudably thorough process manual written by the<br />
constructor.<br />
Wastewater from two inlet sewers and screened septic tank sludge from a separate<br />
reception unit enter a common inlet chamber, from which they flow by gravity through<br />
the whole plant. The plant has no inlet pumps. There is a bypass via overflow from the<br />
inlet chamber.<br />
The inlet chamber is followed by pre-aeration and two 3-mm automatic fine screens.<br />
These units are all covered. The main purpose <strong>of</strong> pre-aeration is to reduce hydrogen<br />
sulphide and thus prevent odour formation. The screenings conveyors are totally cased<br />
and equipped with ventilation. The automatic samplers for influent and effluent<br />
wastewater are located in the pre-treatment hall.<br />
Screening is followed by two rectangular, aerated grit removal basins. Grit and sand are<br />
pumped to a classifier screw which lifts them to a container. Grease and scum are<br />
removed by manually operated surface troughs to a grease pit. The accumulated grease<br />
is removed by suction to a tank truck, and the underflow is directed to the reject water<br />
pumping station.<br />
From grit removal the water is directed to a common chamber from which there is a<br />
bypass possibility via an overflow weir. From this chamber, the water is divided to two<br />
biological treatment lines. The first unit is a pit, where water is mixed with return<br />
sludge. From the pit, the mixture <strong>of</strong> wastewater and return sludge is transported via and<br />
underground pipe to the biological process.<br />
Bypass waters from the inlet chamber and after grit removal are coarse screened before<br />
they are directed to the outlet chamber.<br />
The biological process consists <strong>of</strong> two round basins, in which the activated sludge<br />
process (ASP) is located on the perimeter and secondary sedimentation at the center.<br />
The ASP is designed for biological phosphorus and nitrogen removal according to<br />
ADN(D) principle, i.e. A 2 O process with post-denitrification during warm period. First,<br />
there is an anaerobic zone with a design HRT <strong>of</strong> 2 hours. This is followed by the main<br />
anoxic (D) zone, aerobic (N) zone and two switch zones, which can be operated either<br />
anoxically (warm period) or aerobically (cold period). The effluent weir is located<br />
between the two switch zones. The nitrate recycling pumps (1 per line) are located in<br />
the first switch zone and pump into the second switch zone.<br />
The depth <strong>of</strong> the aeration basin is 5,0 m and that <strong>of</strong> the settler basin 4,8 m.<br />
The A, D and switch zones are equipped with horizontal-flow submersed propeller<br />
mixers. The N and switch zones are equipped with membrane-type fine-bubble plate<br />
aerators (Sanitaire 225 mm). Oxygen is measured in one point, which is located<br />
approximately at 2/3 <strong>of</strong> the length <strong>of</strong> the aerobic zone. Aeration air is supplied by three<br />
Kaeser rotary piston compressors (one per line and one in reserve). The compressors are<br />
Part-financed by the European Union (European Regional Development Fund and<br />
European Neighbourhood and Partnership Instrument)
<strong>Technical</strong> Audit <strong>of</strong> the <strong>Jurmala</strong> Wastewater Treatment Plant<br />
24.11.2010<br />
2.5 Operation<br />
equipped with frequency converters, which are controlled directly by the oxygen<br />
measurement. The air flow is not measured.<br />
Effluent from the ASP is directed to secondary sedimentation via a center well. Water<br />
flows out <strong>of</strong> the well downwards through an opening between the well bottom plate and<br />
settler center structure. The feeding depth is about 2,0 m from the surface. The single<br />
effluent through is located at the perimeter <strong>of</strong> the settler. Return sludge is removed via a<br />
suction scraper to a sludge well and transported by gravity to a chamber located in the<br />
grit removal complex. From this chamber, excess sludge is pumped to sludge treatment.<br />
Excess sludge flow is measured from the pipe. Return sludge pumps lift the sludge to<br />
the pit where it is mixed with wastewater coming from grit removal. Return sludge flow<br />
is measured by measuring the water level above the overflow weir between the return<br />
sludge chamber and the mixing pit.<br />
Excess sludge is first directed to two sludge storage tanks, which are continuously<br />
aerated to prevent anaerobic conditions and secondary release <strong>of</strong> phosphorus. From the<br />
tanks the sludge is pumped to a screw thickener (Siljan Allards RotoMaster SF 35).<br />
Before the thickener there is an injection point <strong>of</strong> polymer, a hydraulic mixer and a<br />
mixing vessel equipped with propeller mixer. The screw thickener discharges to an<br />
intermediate silo from which the sludge is pumped to centrifuges. Before the centrifuges<br />
there is another injection point <strong>of</strong> polymer<br />
The plant has two centrifuges. The one primarily in use is new, procured to replace the<br />
old one. The old centrifuge was originally transferred from the old treatment plant and<br />
found problematic to use. According to personnel, the dried sludge contains 15 – 17 %<br />
<strong>of</strong> dry solids. However, on visual inspection the sludge looked drier than that.<br />
Treated effluent and bypass waters are directed to a distribution chamber located at the<br />
perimeter <strong>of</strong> the plant site. From this chamber, the water can be directed either to a pond<br />
for tertiary sedimentation or directly to the Lielupe river. From the pond, there is an<br />
overflow connection back to the distribution chamber.<br />
The plant has a modern system <strong>of</strong> instrumentation, automation and SCADA. The<br />
maintenance <strong>of</strong> all main instruments and the whole automation system is covered by a<br />
maintenance contract between <strong>Jurmala</strong>s Udens and ABB.<br />
The period <strong>of</strong> guarantee will end in November 2010. Until then the plant personnel will<br />
run the plant according to instructions from the constructor. The constructor is still<br />
tuning the unit processes, notably sludge treatment, to reach the guarantee values.<br />
2.5.1 Operation practice<br />
Operational modes<br />
The activated sludge process is operated according to the constructor’s manual. The<br />
basic operational scheme is explained below.<br />
12<br />
Part-financed by the European Union (European Regional Development Fund and<br />
European Neighbourhood and Partnership Instrument)
<strong>Technical</strong> Audit <strong>of</strong> the <strong>Jurmala</strong> Wastewater Treatment Plant<br />
24.11.2010<br />
13<br />
Operation during cold period (Figure 2.11): The flow is directed from the anaerobic<br />
zone via a penstock directly to the main D-zone and then to the aerobic zone. The first<br />
switch zone is aerated. The second switch zone is mixed (post-D and gas removal)<br />
except for the coldest temperatures, during which it is aerated. Effluent is removed from<br />
the second switch zone and recycle is directed to the main D-zone via a penstock. Thus,<br />
the whole process scheme can be described as ADNN(D).<br />
N<br />
Secondary<br />
sedimentation<br />
D<br />
N<br />
A<br />
Influent + return sludge<br />
D(N)<br />
= penstock, open<br />
= penstock, closed<br />
= pump<br />
Figure 2.11. Operation <strong>of</strong> the activated sludge process during cold period.<br />
Operation during warm period (Figure 2.12): The flow is directed from the anaerobic<br />
zone via a penstock to the second switch zone, which is mixed, and then to the main D-<br />
zone. Both switch zones are mixed, and effluent is removed from the first switch zone.<br />
Thus, the whole process scheme can be described as ADDND.<br />
The threshold temperature between “cold” and “warm” period is not explicitly defined<br />
in the design documents. However, the design calculations are presented for<br />
temperatures <strong>of</strong> 10 o C and 15 o C. 15 o C could be considered an approximate threshold<br />
for change <strong>of</strong> operational mode. Wastewater temperature was higher than 15 o C for<br />
about 40 % <strong>of</strong> the year 2009 (see Figure 2.8).<br />
Part-financed by the European Union (European Regional Development Fund and<br />
European Neighbourhood and Partnership Instrument)
<strong>Technical</strong> Audit <strong>of</strong> the <strong>Jurmala</strong> Wastewater Treatment Plant<br />
24.11.2010<br />
14<br />
N<br />
Secondary<br />
sedimentation<br />
D<br />
D<br />
A<br />
D<br />
Influent + return sludge<br />
Figure 2.12. Operation <strong>of</strong> the activated sludge process during warm period.<br />
Aeration<br />
According to the design, the compressors are controlled directly by the DO<br />
measurement, i.e. the measurement controls the speed value <strong>of</strong> the frequency<br />
controllers. This connection has been decoupled by plant personnel, and the<br />
compressors are operated manually. The reason for this is that the amount <strong>of</strong> air needed<br />
to maintain the target DO concentration <strong>of</strong> 2,0 gO 2 /m 3 in the process was not enough to<br />
keep the sludge in suspension. In addition, the compressors were continuously turned on<br />
and <strong>of</strong>f by the DO-control.<br />
DO is measured manually from several points in the activated sludge basin. This data is<br />
not recorded in electronic form. The automatically measured DO was not included in<br />
the data <strong>report</strong>s delivered by <strong>Jurmala</strong> Water, although it is probably recorded.<br />
Sludge retention time and MLSS concentration<br />
The maximum target sludge retention time (SRT) recommended by the constructor is 20<br />
d and the minimum 12 d.<br />
In 2009, return sludge concentration and excess sludge flow were measured 5 – 7 times<br />
per week. The average amount <strong>of</strong> removed sludge was 1 700 kg TS/d. On the basis <strong>of</strong><br />
the BOD 5 and suspended solids loads in 2009, the specific sludge production was 30 –<br />
40 % higher than expected in the dimensioning calculations. Mixed liquor suspended<br />
solids (MLSS) concentration in the aeration basins was measured 4 – 5 times per week.<br />
Part-financed by the European Union (European Regional Development Fund and<br />
European Neighbourhood and Partnership Instrument)
<strong>Technical</strong> Audit <strong>of</strong> the <strong>Jurmala</strong> Wastewater Treatment Plant<br />
24.11.2010<br />
15<br />
The average MLSS concentration in 2009 was 2,8 g/l varying between 2,0 and 3,7 g/l as<br />
shown in Figure 2.13.<br />
4<br />
3.5<br />
3<br />
g MLSS / l<br />
2.5<br />
2<br />
1.5<br />
1<br />
0.5<br />
0<br />
Jan-<br />
09<br />
Feb-<br />
09<br />
Mar-<br />
09<br />
Apr-<br />
09<br />
May-<br />
09<br />
Jun-<br />
09<br />
Jul-<br />
09<br />
Aug-<br />
09<br />
Sep-<br />
09<br />
Oct-<br />
09<br />
Nov-<br />
09<br />
Dec-<br />
09<br />
Daily value<br />
Yearly average<br />
Figure 2.13. MLSS concentration, 2009.<br />
The average total sludge retention time in 2009 was 18 d. The 14-day moving average<br />
(which is, in case <strong>of</strong> SRT, a more informative parameter than daily values) ranged from<br />
10,7 to 34,5 d as shown in Figure 2.14.<br />
40<br />
35<br />
30<br />
25<br />
d<br />
20<br />
15<br />
10<br />
5<br />
0<br />
Jan-<br />
09<br />
Feb-<br />
09<br />
Mar-<br />
09<br />
Apr-<br />
09<br />
May-<br />
09<br />
Jun-<br />
09<br />
Jul-<br />
09<br />
Aug-<br />
09<br />
Sep-<br />
09<br />
Oct-<br />
09<br />
Nov-<br />
09<br />
Dec-<br />
09<br />
Daily value<br />
14-day moving average<br />
Figure 2.14. Sludge retention time, 2009.<br />
Part-financed by the European Union (European Regional Development Fund and<br />
European Neighbourhood and Partnership Instrument)
<strong>Technical</strong> Audit <strong>of</strong> the <strong>Jurmala</strong> Wastewater Treatment Plant<br />
24.11.2010<br />
16<br />
It is remarkable that there is no clear difference in the length <strong>of</strong> summertime and<br />
wintertime SRTs. In the autumn there have been two periods <strong>of</strong> elevated SRT.<br />
In the winter and spring <strong>of</strong> 2010, the maximum target SRT has been 20 – 25 d in order<br />
to reach a target MLSS concentration <strong>of</strong> 4,5 kg/m 3 . While operating with long SRT, it<br />
was observed that the sludge “died” and rose to the surface. At the time <strong>of</strong> visit (May<br />
2010), solids were visible in the effluent wastewater. According to the personnel, the<br />
transition from long winter SRT to short summer SRT was currently in progress. In the<br />
summer <strong>of</strong> 2009, during shorter SRT, there were no apparent process problems. This is<br />
reflected in the low SVI values <strong>of</strong> that time, see Figure 2.15.<br />
Return sludge and nitrate circulation flow rates<br />
The applied return sludge ratio has been 35 % - 100 %. The nitrate circulation rate has<br />
been kept at minimum, which means that the frequency converter setting has been 18<br />
Hz. On the basis <strong>of</strong> the dimensioning documents and the average wastewater flow <strong>of</strong><br />
2009, this would create an average circulation ratio <strong>of</strong> approximately 100 %.<br />
Secondary sedimentation and sludge volume index<br />
Surface load in secondary sedimentation was 0,28 m/h on average. Hourly flow rates<br />
were not available, but according to the process manual, the bypass threshold is 750<br />
m 3 /h. Thus, the maximum surface load would be 0,6 m/h.<br />
The sludge volume index (SVI) was, on average, 143 ml/g (67…323). The values from<br />
2009 are presented below. The SVI is high during wintertime and drops steeply when<br />
the wastewater temperature rises. The SVI seems to correlate better with temperature<br />
than with SRT (see Figure 2.14), although the increase <strong>of</strong> SRT in autumn probably has a<br />
connection with the SVI. There is no significant difference in SVI values between the<br />
two process lines.<br />
ml/g<br />
350<br />
300<br />
250<br />
200<br />
150<br />
100<br />
50<br />
20<br />
18<br />
16<br />
14<br />
12<br />
10<br />
8<br />
o C<br />
0<br />
6<br />
Jan-<br />
09<br />
Feb-<br />
09<br />
Mar-<br />
09<br />
Apr-<br />
09<br />
May-<br />
09<br />
Jun-<br />
09<br />
Jul-<br />
09<br />
Aug-<br />
09<br />
Sep-<br />
09<br />
Oct-<br />
09<br />
Nov-<br />
09<br />
Dec-<br />
09<br />
SVI, line 1 SVI, Line 2 Temperature<br />
Figure 2.15. Sludge volume index and influent temperature, 2009.<br />
Part-financed by the European Union (European Regional Development Fund and<br />
European Neighbourhood and Partnership Instrument)
<strong>Technical</strong> Audit <strong>of</strong> the <strong>Jurmala</strong> Wastewater Treatment Plant<br />
24.11.2010<br />
17<br />
2.5.2 Loading <strong>of</strong> the activated sludge process<br />
BOD 5 load<br />
The F/M-ratio (organic load) and volumetric load to aeration for the year 2009 are<br />
presented below in Figure 2.16. The average values were 0,064 kgBOD 5 /kgMLSS/d<br />
(0,026…0,108) and 0,18 kgBOD 5 /m 3 /d (0,08…0,31). The dimensioning values are<br />
0,055 kg BOD 5 /kg MLSS/d and 0,25 kg BOD 5 /m 3 /d, respectively. The values have been<br />
calculated according to the volume <strong>of</strong> the activated sludge basins without the anaerobic<br />
zone.<br />
0.35<br />
0.30<br />
kg BOD 5 /kg MLSS/d<br />
kg BOD 5 /m 3<br />
0.25<br />
0.20<br />
0.15<br />
0.10<br />
0.05<br />
0.00<br />
Jan-<br />
09<br />
Feb-<br />
09<br />
Mar-<br />
09<br />
Apr-<br />
09<br />
May-<br />
09<br />
Jun-<br />
09<br />
Jul-<br />
09<br />
Aug-<br />
09<br />
Sep-<br />
09<br />
Oct-<br />
09<br />
Nov-<br />
09<br />
Dec-<br />
09<br />
Sludge load, actual [kg BOD5/kg MLSS/d]<br />
Volumetric load, actual [kg BOD5/m3]<br />
Sludge load, dimensioning<br />
Volumetric load, dimensioning<br />
Figure 2.16. Organic load to aeration, 2009.<br />
Nitrogen load<br />
The nitrogen load per kgMLSS and per aeration basin volume is plotted in Figure 2.17.<br />
The average values for 2009 were 0,016 kgN/kgMLSS/d (0,010…0,029) and 0,046<br />
kgN/m 3 /d (0,032…0,080). The values have been calculated according to the volume <strong>of</strong><br />
the activated sludge basins without the anaerobic zone. These parameters have not been<br />
used in process dimensioning, but their typical dimensioning values for plants which<br />
have to operate in temperatures <strong>of</strong> less than 10 o C are on the order <strong>of</strong> 0,025<br />
kgN/kgMLSS/d and 0,10 kgN/m 3 /d.<br />
Part-financed by the European Union (European Regional Development Fund and<br />
European Neighbourhood and Partnership Instrument)
<strong>Technical</strong> Audit <strong>of</strong> the <strong>Jurmala</strong> Wastewater Treatment Plant<br />
24.11.2010<br />
18<br />
0.090<br />
0.080<br />
0.070<br />
kg N/kg MLSS/d<br />
kg N/m 3<br />
0.060<br />
0.050<br />
0.040<br />
0.030<br />
0.020<br />
0.010<br />
0.000<br />
Jan-<br />
09<br />
Feb-<br />
09<br />
Mar-<br />
09<br />
Apr-<br />
09<br />
May-<br />
09<br />
Jun-<br />
09<br />
Jul-09 Aug-<br />
09<br />
Sep-<br />
09<br />
Oct-<br />
09<br />
Nov-<br />
09<br />
Dec-<br />
09<br />
Nitrogen sludge load [kgN/kgMLSS/d]<br />
Nitrogen volumetric load [kgN/m3/d]<br />
Figure 2.17. Nitrogen volumetric load to aeration, 2009.<br />
2.5.3 Phosphorus balance<br />
The <strong>Technical</strong> University <strong>of</strong> Riga will order extra sampling and analyses and calculate<br />
phosphorus balance for the entire plant during the summer <strong>of</strong> 2010. The results can be<br />
added to the <strong>Technical</strong> Audit when they are completed. The phosphorus balance will<br />
enable a detailed examination <strong>of</strong> the functioning <strong>of</strong> enhanced biological phosphorus<br />
removal (EBPR).<br />
2.5.4 Typical operational problems<br />
The main operational problems <strong>of</strong> the plant are heavy accumulation <strong>of</strong> surface sludge<br />
and foam and the unstable performance <strong>of</strong> the mechanical (screw) thickener. Large<br />
amounts <strong>of</strong> solids are sometimes escaping in the reject <strong>of</strong> the thickener, increasing the<br />
internal solids load <strong>of</strong> the wastewater treatment process. At the time <strong>of</strong> visit,<br />
approximately half <strong>of</strong> the anoxic zone and the center wells <strong>of</strong> the settlers were full <strong>of</strong><br />
thick, dry surface sludge, which creates odours and attracts insects. In addition, the<br />
aerobic zone was completely covered with bulking sludge. This prevented the visual<br />
inspection <strong>of</strong> the distribution <strong>of</strong> aeration air.<br />
In the anaerobic zone and at the beginning <strong>of</strong> the anoxic zone there was no foam.<br />
However, small scraps which should be retained in the screens were visible.<br />
Balancing nitrogen and phosphorus removal has been problematic. Return and DN<br />
circulation pumpings have occasionally transported nitrate to the anaerobic zone<br />
undermining the activity <strong>of</strong> EBPR.<br />
Part-financed by the European Union (European Regional Development Fund and<br />
European Neighbourhood and Partnership Instrument)
<strong>Technical</strong> Audit <strong>of</strong> the <strong>Jurmala</strong> Wastewater Treatment Plant<br />
24.11.2010<br />
Submersible mixers and pumps need new seals. Water was found in 30 % <strong>of</strong> the devices<br />
in 2009. The recommended frequency <strong>of</strong> changing seals is 4 – 5 years. The mixers are<br />
<strong>of</strong> type Flygt 4650 with a jet ring.<br />
Scraps are clogging the suction pipes <strong>of</strong> DN recirculation pumps.<br />
The connection between DO measurement and compressors has been decoupled, and<br />
the compressors are operated manually. The reason for this is that the amount <strong>of</strong> air<br />
needed to maintain 2,0 gO 2 /m 3 in the process was not enough to keep the sludge in<br />
suspension. In addition, the compressors were continuously turned on and <strong>of</strong>f by the<br />
DO-controller.<br />
The basins have no emptying facilities. Emptying can be done only with a sump pump<br />
and a hose, which takes at least 4 – 5 d. Accurate figures cannot be given, because the<br />
basins have never been totally emptied.<br />
Only one polymer can be used for all sludge treatment units. One and the same polymer<br />
are <strong>of</strong>ten not optimal for eg. thickening and dewatering. Tests have been conducted<br />
(Ashland ltd, Germany), where one polymer good for both units was found, but it was<br />
also established that two polymers would be a better solution.<br />
The operational problems described above have been occurring for a long time and are<br />
more or less independent on season.<br />
3 ANALYSIS AND PROPOSED IMPROVEMENTS<br />
3.1 Analysis <strong>of</strong> plant conditions<br />
3.1.1 <strong>Technical</strong> conditions and performance<br />
The plant is new, and thus in excellent structural and mechanical condition. The<br />
machinery and instrumentation are modern. Process dimensioning and basic design<br />
solutions are adequate with regard to the amount, quality and temperature <strong>of</strong> the raw<br />
wastewater and the treatment requirements.<br />
The effluent targets have been reached mostly with clear marginal, especially for<br />
phosphorus. Nitrogen targets have occasionally not been reached; balancing nitrogen<br />
and phosphorus removal has been problematic. Seasonal poor settleability <strong>of</strong> sludge has<br />
induced occasional washout <strong>of</strong> suspended solids.<br />
In general, the generous dimensioning <strong>of</strong> the treatment plant (see e.g. Item 2.5.2) makes<br />
it possible to reach the effluent targets also in the future, taking into account that the<br />
influent loading is expected to increase by approximately 10 %. Even a higher increase<br />
in load (say, 30 %) could probably be treated without difficulties, although the original<br />
design idea <strong>of</strong> one treatment line being sufficient would then not apply.<br />
Although phosphorus removal is mostly on excellent level and clearly meets the current<br />
demands, the HELCOM recommendation <strong>of</strong> 0,5 mg/l is occasionally exceeded. This is<br />
19<br />
Part-financed by the European Union (European Regional Development Fund and<br />
European Neighbourhood and Partnership Instrument)
<strong>Technical</strong> Audit <strong>of</strong> the <strong>Jurmala</strong> Wastewater Treatment Plant<br />
24.11.2010<br />
mostly due to nitrate being transported to the anaerobic zone and disturbing the EBPR –<br />
i.e., incomplete balancing <strong>of</strong> phosphorus and nitrogen removal. In addition, the EBPR is<br />
notorious for its instability and prone to occasional rapid breakdowns. Possibility for<br />
controlled chemical precipitation to assist the biological process during periods <strong>of</strong> low<br />
COD/P ratio or operational problems should be considered.<br />
3.1.2 Design issues<br />
Phosphorus removal may be undermined by the entrance <strong>of</strong> nitrate into the anaerobic<br />
zone. The retention time in the mixing chamber <strong>of</strong> return sludge and pre-treated<br />
wastewater is probably not enough to remove all nirate. This unit and the whole<br />
activated sludge process, especially the balancing <strong>of</strong> nitrogen and phosphorus removal,<br />
could be controlled better with the help <strong>of</strong> more instrumentation.<br />
With the current design, the DN recirculation pump must pump both the recycle flow<br />
and the return sludge flow during the operation mode <strong>of</strong> cold periods. This is not energy<br />
efficient.<br />
The anaerobic zone should be divided into two or three internal, consecutive zones to<br />
ensure plug-flow conditions. This is an empirically proven way to reduce the formation<br />
<strong>of</strong> bulking sludge by enhancing the selector effect <strong>of</strong> the anaerobic zone. In addition,<br />
possible short-circuit flows inside the anaerobic zone would be eliminated and, thus,<br />
sufficient anaerobic retention time would be ensured. The solution would require one or<br />
two light-structured (eg. wooden) walls and one or two new mixers. Implementation <strong>of</strong><br />
such an arrangement is possible, although somewhat challenging, as the flow from the<br />
anaerobic zone is directed to different directions in cold vs. warm weather operation<br />
modes.<br />
The light wall separating the main anoxic and aerobic zones in the activated sludge tank<br />
is too high. It reaches above the basin surface and prevents surface sludge from moving<br />
from the anoxic zone to the aerobic zone, where it might be disintegrated by increasing<br />
aeration.<br />
The compressors are over-dimensioned for the current loading. Even if the required<br />
airflow corresponded better to the output <strong>of</strong> the machines, better energy efficiency could<br />
be achieved with some more instrumentation and advanced control. The recommended<br />
strategy is described in Item 3.2.3.<br />
There is a risk that free oxygen will be transported from the end <strong>of</strong> the aeration line to<br />
the anoxic zone during cold weather operation (last zone aerated), undermining<br />
denitrification. At the same time, free oxygen would be transported to secondary settler,<br />
worsening the settling properties <strong>of</strong> activated sludge.<br />
Optimization <strong>of</strong> sludge treatment would probably benefit from a possibility to use two<br />
polymers instead <strong>of</strong> one. However, care must be taken that the two polymers are<br />
suitable for use in consecutive process units. If this is not guaranteed by the polymer<br />
manufacturer, the polymers may “cancel out” each other, which will worsen the final<br />
dewatering result. The choice <strong>of</strong> polymers should be done based on thorough pilot tests<br />
20<br />
Part-financed by the European Union (European Regional Development Fund and<br />
European Neighbourhood and Partnership Instrument)
<strong>Technical</strong> Audit <strong>of</strong> the <strong>Jurmala</strong> Wastewater Treatment Plant<br />
24.11.2010<br />
at site. At first, the one polymer good for both thickening and dewatering, which was<br />
already pointed out in the tests performed at the plant, should be tried in operation.<br />
The overall design <strong>of</strong> sludge treatment line and the chosen unit processes are correct.<br />
However, the poor performance <strong>of</strong> the screw thickener is causing problems. Personnel<br />
would prefer a gravity thickener, which would undeniably be simpler, cheaper to<br />
operate and less prone to mechanical or electrical disturbances. However, gravity<br />
thickeners are less suitable for plants with EBPR than are mechanical thickeners. If the<br />
sludge is retained in gravity thickeners for several days, anaerobic conditions may<br />
induce release <strong>of</strong> biologically bound phosphorus from the sludge. Purchasing a<br />
mechanical thickener with better yield than the present one could be considered. The<br />
present thickener is operating in horizontal position, where gravity does not help the<br />
separation <strong>of</strong> solids from the water phase. An inclined screw thickener or gravity belt<br />
thickener could perform better.<br />
3.1.3 Process stability and operational problems<br />
The plant is low-loaded in terms <strong>of</strong> organic, nutrient and hydraulic loads. The activated<br />
sludge process has been dimensioned so that it can treat the dimensioning load with<br />
only one <strong>of</strong> the two lines, but two lines have continuously been operated. The low<br />
loading may be connected to the operational problems.<br />
The low loading combined with high SRTs especially in winter has caused<br />
disintegration <strong>of</strong> flocs and promoted growth <strong>of</strong> filamentous micro-organisms. These<br />
phenomena, together with internal solids load from the screw thickener, have induced<br />
accumulation <strong>of</strong> surface sludge and foam. The end result is an evil circle where the<br />
filaments are continuously enriched in the process: the surface sludge acts as a breeding<br />
ground and the removed cells are returned into the basin in sludge treatment rejects.<br />
The operation <strong>of</strong> screening should be checked. On the basis <strong>of</strong> what we saw in the<br />
aeration basin, some scraps are coming through the screens and, according to personnel,<br />
the nitrate recycling pumps have been clogged.<br />
The operating instructions and trouble-shooting tables given in the constructor’s process<br />
manual are correct and accurate. However, at the present situation it seems that the<br />
problems have escalated because the accumulation <strong>of</strong> bulking sludge has not been<br />
tackled immediately and the bulking sludge has not been removed from the process.<br />
There is no possibility for pH or alkalinity control. On the basis <strong>of</strong> treatment results,<br />
effluent pH is almost the same as influent pH, but alkalinity is not analysed. Alkalinity<br />
can become a limiting factor <strong>of</strong> nitrification in the future, and it should be monitored<br />
regularly.<br />
3.2 Recommended actions<br />
3.2.1 General<br />
21<br />
Part-financed by the European Union (European Regional Development Fund and<br />
European Neighbourhood and Partnership Instrument)
<strong>Technical</strong> Audit <strong>of</strong> the <strong>Jurmala</strong> Wastewater Treatment Plant<br />
24.11.2010<br />
The explicit goal <strong>of</strong> this <strong>project</strong> is to propose investments which support more efficient<br />
removal <strong>of</strong> phosphorus. At <strong>Jurmala</strong> <strong>WWTP</strong>, taking into account the dimensioning <strong>of</strong> the<br />
plant and the present, good results <strong>of</strong> phosphorus removal, the removal <strong>of</strong> phosphorus<br />
could be supported and further improved by fulfilling the following goals (Table 3.1):<br />
22<br />
Table 3.1. Goals and strategies <strong>of</strong> supporting more efficient removal <strong>of</strong> phosphorus<br />
Goal<br />
Strategy<br />
Prevent escape <strong>of</strong> phosphorus in effluent<br />
solids<br />
Maximize the efficiency <strong>of</strong> EBPR<br />
Create a “safety catch” for quick reaction<br />
to operational problems<br />
Ensure good settleability <strong>of</strong> sludge<br />
Minimize operational problems <strong>of</strong> the<br />
activated sludge process and help the<br />
operators to balance nitrogen and<br />
phosphorus removal<br />
Implement controlled complementary<br />
precipitation <strong>of</strong> phosphorus during<br />
problems <strong>of</strong> EBPR<br />
The concrete actions to achieve the above are explained in detail below. In addition,<br />
some suggestions to improve the plant’s energy efficiency are given.<br />
3.2.2 Operation <strong>of</strong> existing units<br />
Bulking sludge must be attacked immediately when its formation is observed. It should<br />
be disintegrated by water sprays or, preferably, collected with tank trucks and<br />
transported away from the plant eg. to a landfill or composting. The latter is the only<br />
way <strong>of</strong> preventing the filamentous organisms from enriching in the process. If the<br />
sludge is allowed to accumulate and dry up, it is hard to remove.<br />
To decrease the bulking potential <strong>of</strong> the sludge, the SRT should be kept as low as<br />
possible without compromising nitrification and the sludge circulation rates (return and<br />
nitrate recycle) should be kept as low as possible without compromising total nitrogen<br />
removal and functioning <strong>of</strong> secondary sedimentation. In addition, internal loading from<br />
sludge treatment should be minimized.<br />
Operation using only one line could be considered, at least in the summertime. The<br />
design documents explicitly state that this is possible, which is in accordance with the<br />
calculated functional parameters <strong>of</strong> the year 2009. Thus the process would receive<br />
higher loading, which would benefit floc formers and undermine filamentous growth.<br />
However, this may be too risky especially during cold weather eg, due to insufficient<br />
retention times for phosphorus release and nitrification.<br />
Only one compressor should be used to aerate both lines during periods <strong>of</strong> low loading.<br />
This is possible according to the process manual.<br />
Part-financed by the European Union (European Regional Development Fund and<br />
European Neighbourhood and Partnership Instrument)
<strong>Technical</strong> Audit <strong>of</strong> the <strong>Jurmala</strong> Wastewater Treatment Plant<br />
24.11.2010<br />
Analysis <strong>of</strong> alkalinity should be included in the monitoring program <strong>of</strong> the plant. If<br />
effluent alkalinity is <strong>of</strong>ten below 2,0 mmol/l, implementing addition <strong>of</strong> alkalinity<br />
chemical (eg. sodium carbonate) should be considered.<br />
3.2.3 New investments<br />
On the basis <strong>of</strong> the above, taking into account the wishes and comments <strong>of</strong> plant<br />
personnel as well as the available funding <strong>of</strong> 300 000 EUR, we propose the following<br />
investments for consideration. They are listed in the order <strong>of</strong> priority.<br />
1. Improve the yield <strong>of</strong> sludge thickening<br />
a) Try changing the applied polymer using the present equipment<br />
b) If desired effects are not achieved, install one additional polymer station to<br />
enable the use <strong>of</strong> two polymers: one for thickening, one for dewatering.<br />
Choose polymer based on pilot tests in order to avoid negative interaction<br />
with the dewatering polymer<br />
2. Lower the walls separating the anoxic and aerobic zones so that their upper edge is a<br />
few centimetres below the water surface. This will enable surface sludge to be<br />
transported to the aerobic basin, where it may be disintegrated by aeration.<br />
3. Support process operation with online-measurements<br />
redox measurements in mixing chambers <strong>of</strong> pre-treated wastewater and<br />
return sludge (total 2 pc)<br />
• monitor nitrate concentration <strong>of</strong> influent to the anaerobic zone<br />
• manual setting <strong>of</strong> return sludge pumping rate<br />
redox measurements in anoxic and anaerobic zones (total 4 pc)<br />
• monitor the extent <strong>of</strong> anaerobic conditions<br />
• monitor denitrification rate<br />
• manual setting <strong>of</strong> nitrate recycling rate<br />
ammonium nitrogen at the outlet channel <strong>of</strong> aeration basins (total 2 pc)<br />
• monitor nitrification rate<br />
• automatic or manual setting <strong>of</strong> DO setpoint in the last aerated<br />
zone<br />
• manual setting <strong>of</strong> target sludge retention time<br />
phosphate phosphorus in plant effluent (total 1 pc)<br />
• trend <strong>of</strong> phosphorus removal and early warning <strong>of</strong> problems<br />
• placed indoors in the pre-treatment building<br />
4. Divide the anaerobic zone into two internal compartments to create plug-flow<br />
conditions and ensure sufficient anaerobic retention time<br />
5. Improve aeration control<br />
divide the main aerobic zone to two internal zones<br />
equip both these zones and the first switch zone (anox/aer) with one oxygen<br />
meter each (total 4 new meters procured, 2 old meters used)<br />
implement constant-pressure control <strong>of</strong> compressors and regulate DO<br />
concentration with air delivery valves (total 4 electric control valves)<br />
23<br />
Part-financed by the European Union (European Regional Development Fund and<br />
European Neighbourhood and Partnership Instrument)
<strong>Technical</strong> Audit <strong>of</strong> the <strong>Jurmala</strong> Wastewater Treatment Plant<br />
24.11.2010<br />
24<br />
install two thermal air flow meters to monitor the actual air flow rate to both<br />
aeration lines<br />
in addition, the DO setpoint <strong>of</strong> the last aerobic zone could also be controlled<br />
with online measurement <strong>of</strong> ammonium nitrogen from the effluent channel<br />
<strong>of</strong> the aeration basin (not included in cost calculations)<br />
these measures will bring the following gains:<br />
• reduce energy costs due to more efficient use <strong>of</strong> air<br />
• minimize residual oxygen at the end <strong>of</strong> aeration line more<br />
efficient post-denitrification and protection <strong>of</strong> anaerobic<br />
compartment from free oxygen during cold weather operation<br />
The proposed investments support the general objectives <strong>of</strong> Table 3.1 as follows:<br />
Item Sludge settleability Process stability<br />
1. Improve thickener yield X X<br />
2. Lower separation walls X<br />
3. Online measurements X<br />
4. Division <strong>of</strong> ANA zone X X<br />
5. Optimize aeration X X<br />
In addition, the consultant recommends implementing complementary chemical<br />
precipitation <strong>of</strong> phosphorus as a “safety catch”, which could be used when there are<br />
temporary problems with the EBPR. In addition, if thickener performance cannot be<br />
improved to the desired level by polymers, we recommend replacing the existing<br />
mechanical thickener with a new, inclined screw or belt thickener. Inclined screw<br />
thickeners have been used e.g. in the <strong>WWTP</strong>s <strong>of</strong> Lahti and Jyväskylä, Finland, with<br />
good results.<br />
3.3 Dimensioning, implementation and operation <strong>of</strong> new units<br />
The new units and modifications described below are presented graphically in the<br />
Annexes 1 – 5.<br />
3.3.1 New polymer station<br />
The polymer station (40PE02) will be dimensioned for the dimensioning sludge<br />
production <strong>of</strong> the plant (1930 kgTS/d) and operated, basically, in a similar manner as<br />
the current one. The consultant proposes that the new station be implemented so that<br />
both stations can serve either the thickener or the centrifuges (or, in exceptional cases,<br />
both units), according to the choice <strong>of</strong> the operator. This approach will provide<br />
operational flexibility. The Contractor shall design the detailed implementation and<br />
operation.<br />
3.3.2 Online measurements and analyses<br />
Part-financed by the European Union (European Regional Development Fund and<br />
European Neighbourhood and Partnership Instrument)
<strong>Technical</strong> Audit <strong>of</strong> the <strong>Jurmala</strong> Wastewater Treatment Plant<br />
24.11.2010<br />
The measurements QI-07, -08, -09, -10, -14, -15 (redox) and QIC-11, QIC-12<br />
(ammonium nitrogen) are implemented as electrode measurements performed at site.<br />
The measurement QI-13 (phosphate) is executed by an analyser, which is situated<br />
indoors in the pre-treatment building. The samples are pumped to the analysers<br />
continuously from the effluent channel beneath the pre-teratment building. The sample<br />
to be analysed is filtrated and taken to the analyser via an automatically controlled valve<br />
system.<br />
The analyser operates continuously, controlled by a separate control system which is<br />
included in the analyser supply. The operator can give on/<strong>of</strong>f commands to the analyser<br />
via the central automation system <strong>of</strong> the <strong>WWTP</strong>. However, the analyser shall always<br />
perform the ongoing analysis to the end before stopping on request from the central<br />
automation system.<br />
3.3.3 Modification <strong>of</strong> the anaerobic zone<br />
The purpose <strong>of</strong> the modifications in the anaerobic zone is to enhance the selector effect<br />
<strong>of</strong> this zone and, consequently, to improve sludge settling properties and reduce surface<br />
sludge formation. In addition, the objective is to ensure long enough anaerobic retention<br />
time by avoiding short-cut flows.<br />
The preliminary plan for this modification is as follows.<br />
1. The influent pipe is continued in the direction <strong>of</strong> the radius <strong>of</strong> the basin to a<br />
point approximately 0,5 m from the pipe which connects the main anoxic zone<br />
with secondary anoxic zone. The end <strong>of</strong> the extension <strong>of</strong> the influent pipe is cut<br />
as pictured in the drawings 16WWE0473ME-3001 and -3002.<br />
2. A new, longitudinal division wall is constructed in the middle <strong>of</strong> the anaerobic<br />
zone. The wall is placed so that it divides the anaerobic zone in a volumetric<br />
ratio <strong>of</strong> approximately 1:2, the smaller volume being the one closer to the center<br />
<strong>of</strong> the spherical basin, i.e. the one into which the mixture <strong>of</strong> wastewater and<br />
return sludge is introduced from the extended influent pipe. The wall is left open<br />
by 0,10 – 0,50 m from all sides as shown in the drawings 16WWE0473ME-3001<br />
and -3002. In addition, two openings <strong>of</strong> approximately 1,0 x 1,0 m are cut in the<br />
lower edge <strong>of</strong> the wall.<br />
3. A new mixer is installed to the smaller internal anaerobic zone.<br />
25<br />
3.3.4 Improved aeration control<br />
The general strategy <strong>of</strong> improved aeration control is as follows. Target pressure is<br />
maintained in the air delivery main by the compressors. Air distribution to the aeration<br />
basin zones is regulated based on oxygen demand. The oxygen concentration meters<br />
QIC-03, -03/1, -04, -04/1 control the air valves CV-01, -02, -03, -04 located in the air<br />
distribution pipes.<br />
Part-financed by the European Union (European Regional Development Fund and<br />
European Neighbourhood and Partnership Instrument)
<strong>Technical</strong> Audit <strong>of</strong> the <strong>Jurmala</strong> Wastewater Treatment Plant<br />
24.11.2010<br />
The compressors’ own control system must be modified so that it enables constant<br />
pressure control, i.e. keeps up constant pressure (PIC-10) according to a target value<br />
received from a local process station and the reading <strong>of</strong> pressure measurement from the<br />
air delivery main.<br />
The concentration <strong>of</strong> dissolved oxygen (DO) in the two sections created to the main<br />
aerobic zone and the air flow directed to each <strong>of</strong> these sections are controlled directly<br />
with valve-specific control loops. The operator enters loop-specific DO setpoints to the<br />
system. DO measurements are used to control the position <strong>of</strong> air control valves. Each<br />
loop will also have a manual option, in which the control valve can be driven inside the<br />
position range 0...100 % by remote operation from the control room. The operator can<br />
choose automatic or manual control to each control loop specifically.<br />
The control <strong>of</strong>fset is corrected with steps <strong>of</strong> 3 %. New control values are calculated at 6<br />
min intervals. If the DO measurement differs from the setpoint substantially (15 % or<br />
more), control interval is shortened (by 2 min).<br />
The operator can enter upper and lower limits for line-specific air flows (FI-12, FI-13)<br />
in order to protect the aerators from excessive air flows and, respectively, to ensure<br />
sufficient mixing during periods <strong>of</strong> low loading. In addition, the position <strong>of</strong> the<br />
automatic air control valves can be limited with mechanical restraints.<br />
Alarms:<br />
The following alarms shall be programmed for aeration:<br />
conflict alarms and common alarms <strong>of</strong> the compressors<br />
upper limit alarms <strong>of</strong> control <strong>of</strong>fsets<br />
upper and lower limit alarms <strong>of</strong> line-specific air flows<br />
26<br />
PÖYRY FINLAND LTD<br />
Prepared by<br />
Kristian Sahlstedt,<br />
Process Specialist<br />
Pekka Sarkkinen<br />
Project Engineer<br />
Confirmed by<br />
Matti Iikkanen,<br />
Senior Vice President<br />
Part-financed by the European Union (European Regional Development Fund and<br />
European Neighbourhood and Partnership Instrument)