Pedersen et al. (2008).pdf - Purchase College
Pedersen et al. (2008).pdf - Purchase College
Pedersen et al. (2008).pdf - Purchase College

Create successful ePaper yourself
Turn your PDF publications into a flip-book with our unique Google optimized e-Paper software.
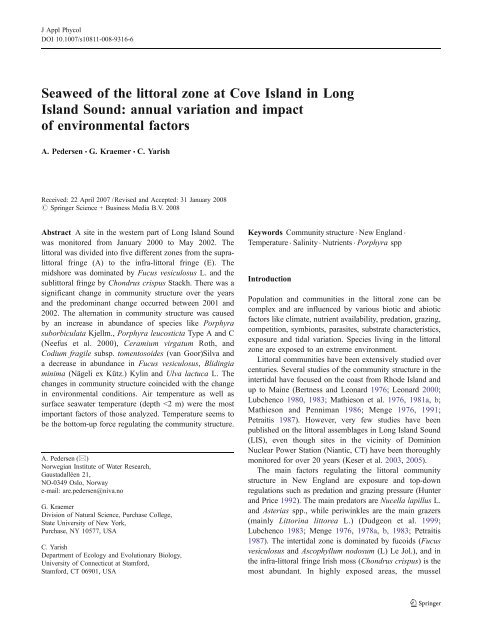
J Appl Phycol<br />
DOI 10.1007/s10811-008-9316-6<br />
Seaweed of the littor<strong>al</strong> zone at Cove Island in Long<br />
Island Sound: annu<strong>al</strong> variation and impact<br />
of environment<strong>al</strong> factors<br />
A. <strong>Pedersen</strong> & G. Kraemer & C. Yarish<br />
Received: 22 April 2007 /Revised and Accepted: 31 January <strong>2008</strong><br />
# Springer Science + Business Media B.V. <strong>2008</strong><br />
Abstract A site in the western part of Long Island Sound<br />
was monitored from January 2000 to May 2002. The<br />
littor<strong>al</strong> was divided into five different zones from the supr<strong>al</strong>ittor<strong>al</strong><br />
fringe (A) to the infra-littor<strong>al</strong> fringe (E). The<br />
midshore was dominated by Fucus vesiculosus L. and the<br />
sublittor<strong>al</strong> fringe by Chondrus crispus Stackh. There was a<br />
significant change in community structure over the years<br />
and the predominant change occurred b<strong>et</strong>ween 2001 and<br />
2002. The <strong>al</strong>ternation in community structure was caused<br />
by an increase in abundance of species like Porphyra<br />
suborbiculata Kjellm., Porphyra leucosticta Type A and C<br />
(Neefus <strong>et</strong> <strong>al</strong>. 2000), Ceramium virgatum Roth, and<br />
Codium fragile subsp. tomentosoides (van Goor)Silva and<br />
a decrease in abundance in Fucus vesiculosus, Blidingia<br />
minima (Nägeli ex Kütz.) Kylin and Ulva lactuca L. The<br />
changes in community structure coincided with the change<br />
in environment<strong>al</strong> conditions. Air temperature as well as<br />
surface seawater temperature (depth
J Appl Phycol<br />
(Mytilus edulis L.) outcomp<strong>et</strong>es Chondrus crispus as<br />
predation pressures are reduced.<br />
Studies have recently focused on the importance of<br />
bottom-up regulation. These factors, i.e. variation in nutrient<br />
and other environment<strong>al</strong> conditions, have been associated<br />
with changes in <strong>al</strong>g<strong>al</strong> cover, usu<strong>al</strong>ly in larger spati<strong>al</strong> sc<strong>al</strong>es<br />
(10–100 km) (Menge 2000). Other bottom-up processes like<br />
recruitment, congestion for space, nutrient and food<br />
abundance (POC, PON and chlorophyll-a) have <strong>al</strong>so been<br />
shown to have a bottom-up effect on the community<br />
structure (Bertness <strong>et</strong> <strong>al</strong>. 1999a, b; Menge <strong>et</strong> <strong>al</strong>. 1999;<br />
Menge 2000). However, a recent study demonstrated that a<br />
bottom-up process interact with top-down forces in the<br />
regulation of community structure loc<strong>al</strong>ly in the littor<strong>al</strong><br />
zone in New England (Leonard <strong>et</strong> <strong>al</strong>. 1998).<br />
Apart from fucoids and Irish moss which are the key<br />
<strong>al</strong>g<strong>al</strong> species in the two main zones on these shores, sever<strong>al</strong><br />
species of Porphyra are <strong>al</strong>so frequently found in the littor<strong>al</strong><br />
zone <strong>al</strong>ong New England’s shores (Sears 1998). However,<br />
the genus Porphyra contains sever<strong>al</strong> species that are<br />
difficult to identify (Brodie <strong>et</strong> <strong>al</strong>. 1998; Broom <strong>et</strong> <strong>al</strong>.<br />
2002; Lindstrom and Cole 1993; Neefus <strong>et</strong> <strong>al</strong>. 2000, 2002;<br />
Nelson <strong>et</strong> <strong>al</strong>. 2001) since their morphologies are very<br />
similar (Nelson <strong>et</strong> <strong>al</strong>. 2000). As sever<strong>al</strong> Porphyra are of<br />
great importance in aquaculture, especi<strong>al</strong>ly in Korea, China<br />
and Japan (Oohusa 1992; Tseng and Fei 1987), domestic<br />
species have gained attention in recent years as potenti<strong>al</strong>ly<br />
v<strong>al</strong>uable resources, and sever<strong>al</strong> studies have recently been<br />
initiated (Carmona <strong>et</strong> <strong>al</strong>. 2001; Chopin <strong>et</strong> <strong>al</strong>. 2001a, b, c;<br />
Levine 1998; Yarish <strong>et</strong> <strong>al</strong>. 1997, 1998, 1999). As a part of<br />
this new interest in Porphyra in New England, this study<br />
aimed to gain information on the spati<strong>al</strong> and tempor<strong>al</strong><br />
occurrence of Porphyra species in LIS. However, the main<br />
go<strong>al</strong> of this study was to test the importance of climatic<br />
factors as bottom-up forces in regulating the community<br />
structure of the shore line.<br />
Materi<strong>al</strong>s and m<strong>et</strong>hods<br />
A site at Cove Island, Stamford, CT (41°2.644′N, 73°<br />
30.133′W) (Fig. 1) was surveyed 23 times over a period<br />
of 2 years, from February 2000 to March 2002. The midlittor<strong>al</strong><br />
zone was divided into five vertic<strong>al</strong> zones, from<br />
supra-littor<strong>al</strong> fringe (A) to the infra-littor<strong>al</strong> fringe (E)<br />
(classification of vertic<strong>al</strong> zonation according to Hiscock<br />
and Mitchell 1980). The procedure of dividing the phyt<strong>al</strong><br />
zone into five different zones was based on biologic<strong>al</strong> as<br />
well as physic<strong>al</strong> differences b<strong>et</strong>ween the zones. The upper<br />
zone A represented the supra-littor<strong>al</strong> zone and extended<br />
into the upper part of the b<strong>al</strong>anoid/fucoid belt in the midlittor<strong>al</strong><br />
zone. The extensive fucoid belt, present at the time,<br />
was divided into two zones, B and C. The two zones were<br />
Fig. 1 NOAA’s hydrographic<strong>al</strong> stations in Long Island Sound, used<br />
to c<strong>al</strong>culate average v<strong>al</strong>ues for environment<strong>al</strong> variables (modified after<br />
NOAA’s station map). Arrow points at Cove Island<br />
thought to response differently to prolonged periods of<br />
abnorm<strong>al</strong> environment<strong>al</strong> conditions. The two lower zones<br />
had a sm<strong>al</strong>ler angle of inclination than the above fucoid<br />
zones. They were separated into two zones. Zone D, just<br />
above the infra-littor<strong>al</strong> fringe, was flat with a few fucoids<br />
but periodic<strong>al</strong>ly with high abundance of Codium fragile.<br />
The flats were occasion<strong>al</strong>ly covered with sediments and<br />
were daily exposed to air due to tid<strong>al</strong> fluctuations as<br />
opposed to the lowest zone (E) within the infra-littor<strong>al</strong><br />
fringe which was only exposed to air a few days every<br />
month. The horizont<strong>al</strong> elevation from the Mean Lower Low<br />
Water (MLLW) was measured by laser level. MLLW was<br />
s<strong>et</strong> to 0 m depth and the zones represented the following<br />
depth interv<strong>al</strong>s (cm above MLLW) A=270–220 cm, B=<br />
220–150 cm, C=150–50 cm, D=50–0 cm and E=0 to<br />
−40 cm.<br />
The dominating species in the lowest zone was <strong>al</strong>so<br />
different from the above. It was <strong>al</strong>so assumed that zone D<br />
would be more exposed to sedimentation than the above<br />
fucoid belt. The species occurring within each zone were<br />
recorded by placing a frame (0.5 × 0.5 m) subdivided<br />
into sm<strong>al</strong>ler (10×10 cm) squares randomly within the<br />
zones during each registration. Each sub-square represented<br />
4% cover and enabled us to add up b<strong>et</strong>ter the percentage<br />
cover of each species. Five replicate frames were recorded<br />
within each zone. All species were registered as percentage<br />
cover at low tide. The registrations were based on nondestructive<br />
sampling. However, sm<strong>al</strong>l pieces of those<br />
species hard to identify in the field were collected either<br />
within or outside the frames for further identification in the<br />
laboratory.
J Appl Phycol<br />
Low taxonomic resolution reflected environment<strong>al</strong> pollution<br />
gradients even more clearly than did higher taxonomic<br />
levels (Gray <strong>et</strong> <strong>al</strong>. 1990; Olsgard <strong>et</strong> <strong>al</strong>. 1998; Olsgard and<br />
Somerfield 2000), especi<strong>al</strong>ly when trying to relate community<br />
structure to environment<strong>al</strong> data (Clarke and Ainsworth<br />
1993; Terlizzi <strong>et</strong> <strong>al</strong>. 2002). Hence, running multivariate<br />
an<strong>al</strong>ysis of the community structure of Cove Island<br />
included grouping of species into higher taxa. This was<br />
done to compensate for the existence of species difficult to<br />
distinguish and identify in the field. It has been shown that<br />
grouping species into higher taxa does not <strong>al</strong>ter the main<br />
outcome and can som<strong>et</strong>imes improve the results of<br />
multivariate an<strong>al</strong>ysis of community structure (Clarke<br />
1993; Gray <strong>et</strong> <strong>al</strong>. 1990; Lasiak 2003; Olsgard <strong>et</strong> <strong>al</strong>. 1997;<br />
Terlizzi <strong>et</strong> <strong>al</strong>. 2003; Warwick 1988).<br />
Sm<strong>al</strong>l inconspicuous species ( 5 mm.<br />
Data for temperature, nitrate and s<strong>al</strong>inity from LIS<br />
were obtained from Nation<strong>al</strong> Oceanic and Atmospheric<br />
Administration (NOAA). These were obtained from<br />
NOAA’s hydrographic<strong>al</strong> stations 09, C2, D3 and E1<br />
(Fig. 1) and averaged across a 1 month period prior to the<br />
dates when community structure were registered. Monthly<br />
v<strong>al</strong>ues for nitrate (μM), s<strong>al</strong>inity (ppt) and temperature (°C)<br />
were averaged for each season (i.e., winter, spring,<br />
summer and f<strong>al</strong>l). Winter included the months December<br />
to March, spring from April to May, summer from June to<br />
September and f<strong>al</strong>l from October to December. Missing<br />
v<strong>al</strong>ues for temperature in February and May of 2001,<br />
nitrate + nitrite and s<strong>al</strong>inity for May 2001, were interpolated<br />
based on the previous and the following months.<br />
Differences among environment<strong>al</strong> data were tested with<br />
two-sample t tests or paired t tests where applicable. To<br />
test the influence of climatic factors on the community<br />
structure, a datas<strong>et</strong> was obtained from the Nation<strong>al</strong><br />
Climate Data Center at NOAA for Stamford, CT,<br />
including: DPNT (departure from norm<strong>al</strong> monthly temperature),<br />
DT00 (number of days with minimum air<br />
temperature less than or equ<strong>al</strong> to –17.8°C), DT32 (number<br />
of days with minimum air temperature less than or equ<strong>al</strong><br />
to 0°C), DT90 (number of days with maximum air<br />
temperature greater or equ<strong>al</strong> to 32°C), DX32 (number of<br />
days with maximum air temperature less than or equ<strong>al</strong> to<br />
0°C), EMNT (extreme minimum air temperature for the<br />
month), EMXT (extreme maximum air temperature for the<br />
month), EMXP (extreme maximum daily precipitation in<br />
the month), MMNT (monthly mean minimum air temperature),<br />
MMXT (monthly mean maximum air temperature)<br />
and MNTM (monthly mean air temperature).<br />
Multidimension<strong>al</strong> sc<strong>al</strong>ing (MDS) was used to an<strong>al</strong>yze<br />
quantitative data on species and taxa abundances over<br />
time. MDS is an ordination m<strong>et</strong>hod and will present<br />
tempor<strong>al</strong> differences in community structure in a graphic<strong>al</strong><br />
plot. The longer the distance b<strong>et</strong>ween two samples,<br />
the greater is the difference in community structure b<strong>et</strong>ween<br />
the samples. Due to the high number of quadrats<br />
recorded, the five replicate quadrats within each zone<br />
were averaged prior to the multivariate an<strong>al</strong>ysis. This<br />
was done to reduce number of permutation and make the<br />
computations possible to execute. Bray–Curtis similarity<br />
index was used in c<strong>al</strong>culating the species similarity<br />
matrix. Prior to an<strong>al</strong>ysis, the species data were transformed<br />
by a fourth root transformation to make the<br />
datas<strong>et</strong>s more similar to a norm<strong>al</strong> distribution. The similarity<br />
matrices were input for MDS an<strong>al</strong>ysis. The same<br />
similarity matrices were used for hierarchic<strong>al</strong> agglomerative<br />
clustering using group average linkage to crosscheck<br />
the results obtained via MDS an<strong>al</strong>ysis, when the<br />
stress factor approached 0.2 (Clarke 1993). One-way<br />
ANOSIM permutation test (which is a simulated ANOVA,<br />
PRIMER ver. 5) was used to test differences b<strong>et</strong>ween the<br />
species composition at different years, zones and seasons.<br />
SIMPER (Similarity percentage procedure) was used on<br />
the abundance data matrices to test the different species<br />
contribution to the Bray–Curtis dissimilarities b<strong>et</strong>ween<br />
years, zones and seasons, i.e. the an<strong>al</strong>ysis ranks and<br />
quantify the importance of each species which causes the<br />
differences among the samples in the MDS plot. Similarity<br />
matrices of the environment<strong>al</strong> data, i.e. temperature,<br />
s<strong>al</strong>inity and nitrate concentration in 2 m water depth in<br />
LIS and climate data from Stamford, were based on<br />
norm<strong>al</strong>ized Euclidean distance as opposed to a Bray–<br />
Curtis similarity matrices for the biologic<strong>al</strong> datas<strong>et</strong>s.<br />
Princip<strong>al</strong> component an<strong>al</strong>ysis (PCA) of environment<strong>al</strong><br />
data from LIS and climate data from Stamford were<br />
plotted in two dimensions. To compare the environment<strong>al</strong><br />
data and climate datas<strong>et</strong>s against biologic<strong>al</strong> datas<strong>et</strong>s, BIO-<br />
ENV (PRIMER ver.5) was used. These procedures<br />
compare the environment<strong>al</strong> matrices (environment<strong>al</strong> data<br />
matrix from LIS and climate data matrix from Stamford as<br />
well as a combination of them) against the biota matrices<br />
within each zone. BIO-ENV c<strong>al</strong>culates a measure of<br />
agreement b<strong>et</strong>ween the two dissimilarity matrices by rank<br />
correlation of the matching elements in the two matrices.<br />
The coefficient of agreement used was a Spearman rank<br />
correlation coefficient ρ which ranges from –1 compl<strong>et</strong>e<br />
discordance b<strong>et</strong>ween ranked v<strong>al</strong>ues) and +1 (compl<strong>et</strong>e<br />
concordance).
J Appl Phycol<br />
Results<br />
Environment<strong>al</strong> conditions<br />
The average temperature (at 2 m depth) in Long Island<br />
Sound off the study site, varied from 0.5°C in January to<br />
23°C in August/September (Fig. 2). In 2002, the average<br />
temperature (T) in the coldest winter months was twice as<br />
high as in 2000 and 2001, 4.5°C as opposed to 1.8°C and<br />
1.7°C, respectively. No difference was d<strong>et</strong>ected b<strong>et</strong>ween<br />
summer temperatures in 2000 and 2001.<br />
Nitrate (=NO 3 +NO 2 ) concentration (N) in the upper<br />
water column varied dramatic<strong>al</strong>ly over the year with low N<br />
in the summer months and high in the winter months.<br />
Figure 2 shows that N dropped dramatic<strong>al</strong>ly from February<br />
to March in 2000 and from January to February in 2001.<br />
However, in 2002, high N was observed into May.<br />
The s<strong>al</strong>inity (S) at 2 m depth in the inner part of LIS varied<br />
b<strong>et</strong>ween 25.4 and 29.1 psu (Fig. 2). S was lower during the<br />
spring/summer months than during winter presumably due<br />
to runoff from land during spring. S during the summer<br />
months in 2000 and 2001 varied from 25.4 to 26.8 psu,<br />
while the average S in the winter months from November<br />
2000 to March 2001 (27.5 psu) was significantly lower than<br />
in the same period during the 2001/2002 winter (28.9,<br />
p2 m) was much higher during 2002 than the<br />
previous two years (Fig. 2). This was due to an air<br />
temperature that was higher than norm<strong>al</strong> from August 2001<br />
until April 2002. During this period the temperatures were<br />
on average 2.4°C above the norm<strong>al</strong> (based on 30 years<br />
variation, NOAA-datas<strong>et</strong>s). The previous winter temperatures<br />
were not different from the 30-year range. DPNT<br />
(departure from norm<strong>al</strong> monthly temperature) was the factor<br />
that best described the variation over PC2 as well as other<br />
temperature factors as DT00 and DX32 (Tables 3 and 4).<br />
Fig. 2 Average nitrate concentrations,<br />
temperature and s<strong>al</strong>inity<br />
at 4 stations (NOAA) in LIS<br />
from January 2000 to April<br />
2002. (Note that v<strong>al</strong>ues for June<br />
2000 are missing.)<br />
Nitrate (ppm) and temperature (°C)<br />
25<br />
20<br />
15<br />
10<br />
5<br />
0<br />
Temp. (°C)<br />
Nitrate (µM)<br />
S<strong>al</strong>inity<br />
1/00<br />
2/00<br />
3/00<br />
4/00<br />
5/00<br />
7/00<br />
8/00<br />
9/00<br />
10/00<br />
11/00<br />
12/00<br />
1/01<br />
2/01<br />
3/01<br />
4/01<br />
5/01<br />
6/01<br />
7/01<br />
8/01<br />
9/01<br />
10/01<br />
11/01<br />
12/01<br />
1/02<br />
2/02<br />
3/02<br />
4/02<br />
30<br />
28<br />
26<br />
24<br />
22<br />
S<strong>al</strong>inity (psu)<br />
20
J Appl Phycol<br />
PC2<br />
2.0<br />
1.5<br />
1.0<br />
0.5<br />
0<br />
-0.5<br />
-1.0<br />
7-00<br />
5-00<br />
4-01<br />
4-00<br />
3-00<br />
3--01 2-01<br />
4--02<br />
10-00<br />
10-01<br />
1-01<br />
2-00<br />
-1.5<br />
-2.0 -1.5 -1.0 -0.5 0 0.5 1.0 1.5 2.0<br />
PC1<br />
Fig. 3 PCA of the environment<strong>al</strong> conditions in the inner part of LIS<br />
during the period February 2000 to April 2002. The arrows indicate<br />
succession in environment<strong>al</strong> condition during the years. The labels on<br />
the x-axis are in month-year format<br />
Biologic<strong>al</strong> succession at Cove Island, LIS<br />
11-00<br />
11-01<br />
12-01<br />
12-00<br />
1-02<br />
2-02<br />
Table 1 Eigenv<strong>al</strong>ues and explained variation on 3 PC-axis in Fig. 3<br />
PC Eigenv<strong>al</strong>ues Variation (%) Cumulative variation (%)<br />
1 1.55 51.8 51.8<br />
2 1.04 34.6 86.5<br />
3 0.41 13.5 100.0<br />
Table 2 Eigenvectors representing the relative importance of the<br />
three variables N (nitrate + nitrite), T (temperature) and S (s<strong>al</strong>inity) in<br />
describing the variation <strong>al</strong>ong the different PC-axis<br />
Variable PC1 PC2 PC3<br />
N 0.710 0.150 -0.688<br />
T 0.038 0.967 0.250<br />
S 0.703 -0.203 0.682<br />
The intertid<strong>al</strong> zone at Cove Island was dominated by Fucus<br />
vesiculosus with a tot<strong>al</strong> average annu<strong>al</strong> cover of 34%,<br />
followed by Chondrus crispus (19%) and Semib<strong>al</strong>anus sp.<br />
(11%) (Table 5). The occurrence varied within the five<br />
different zones and, <strong>al</strong>though F. vesiculosus was found in<br />
<strong>al</strong>l five zones, it was most pronounced in the intermediate<br />
zones B (68%), C (55%) and D (37%) (Table 5; Fig. 5).<br />
Fucus vesiculosus is a perenni<strong>al</strong>, but the percentage cover<br />
varied both season<strong>al</strong>ly and annu<strong>al</strong>ly. During 2000 and until<br />
May 2001, the average cover (5 replicates) within each<br />
zone were fairly stable. However, during summer 2001, the<br />
percentage cover dropped significantly in <strong>al</strong>l zones (twosample<br />
t test: p
aCLIMATE DATA<br />
J Appl Phycol<br />
3<br />
CLIMATE DATA<br />
Multivariate an<strong>al</strong>ysis of community structure<br />
PC2<br />
b<br />
PC2<br />
2<br />
1<br />
0<br />
-1<br />
-2<br />
-3<br />
01-01<br />
01-00<br />
01-02<br />
12-01<br />
02-02<br />
03-00<br />
11-01<br />
01-00<br />
10-00<br />
04-01 04-02<br />
02-01<br />
03-02<br />
04-00 10-01<br />
05-00<br />
09-00 05-01<br />
12-02 11-02<br />
07-02<br />
10-02<br />
09-02 08-02<br />
03-01 011-00<br />
09-01 08-00 07-01 JU00<br />
08-01<br />
05-02<br />
06-02<br />
0601<br />
07-00<br />
12-00<br />
-4<br />
-6 -4 -2 0 2 4 6<br />
3<br />
2<br />
1<br />
0<br />
-1<br />
-2<br />
-3<br />
1-01<br />
1-00<br />
1-02 12-01<br />
2-02 3-00<br />
11-01<br />
2-00<br />
4-01 4-02<br />
2-01<br />
11-02<br />
4-00 10-00 10-01<br />
5-00 5-01<br />
12-02 11-02<br />
9-00<br />
6-01<br />
7-02<br />
3-01 11-00<br />
11-02 9-02<br />
5-02 9-018-00<br />
7-01<br />
6-00<br />
8-01 8-02<br />
6-02<br />
7-00<br />
12-00<br />
-4<br />
-6 -4 -2 0 2 4 6<br />
PC1<br />
Fig. 4 PCA of the climate data from Stamford, CT, during 2000,<br />
2001 and 2002. The labels on the x-axis are in month-year format. a<br />
V<strong>al</strong>ues for number of days with maximum temperatures below 0°C are<br />
superimposed on plot. b V<strong>al</strong>ues for number of days with maximum<br />
temperature above 32°C are superimposed on the plot<br />
Porphyra leucosticta Type A increased over the years from<br />
0.5% cover in zone D in 2000 to 5.5% cover in 2002 (n.s.).<br />
Type C of P. leucosticta was found epiphytic on different<br />
<strong>al</strong>gae or epilithic in the mid-littor<strong>al</strong> zone from November to<br />
May (Fig. 5h). It was mainly ovate with ruffled edges of<br />
3–8 cm wide and 5–10(–15) cm long. The th<strong>al</strong>lus thickness<br />
varied b<strong>et</strong>ween 30–40 μm (21–50 μm) in thickness. It was<br />
found in <strong>al</strong>l zones at Cove Island from A to E as opposed to<br />
Type A found exclusively in zones D and E. In gener<strong>al</strong>, <strong>al</strong>l<br />
types of Porphyra spp found at the site increased in<br />
percentage coverage from 2000 to 2002 as did Ceramium<br />
virgatum, Neosiphonia harveyi and C. fragile subsp<br />
tomentosoides.<br />
Table 3 Eigenv<strong>al</strong>ues and explained variation on 5 PC-axis in Fig. 4<br />
PC Eigenv<strong>al</strong>ues Variation (%) Cumulative variation (%)<br />
1 6.86 62.4 62.4<br />
2 1.35 12.2 74.6<br />
3 1.08 9.8 84.4<br />
4 0.73 6.6 91.0<br />
5 0.49 4.4 95.5<br />
Average percentage cover for <strong>al</strong>l species was compared for<br />
<strong>al</strong>l sampling dates. The community structure shows that<br />
some zones form more distinct group than others (A+B+C<br />
and D and E) (Fig. 6). Zones B and C show less<br />
separation than others and are <strong>al</strong>so indicated with the lowest<br />
pairwise r-v<strong>al</strong>ue b<strong>et</strong>ween zones (B and C in Table 6). There<br />
are significant differences b<strong>et</strong>ween <strong>al</strong>l zones (one-way<br />
ANOSIM, p
J Appl Phycol<br />
Table 5 Average (plus minimum and maximum) percentage cover of species and taxa within the zones used in the an<strong>al</strong>ysis of community<br />
structure at Cove Island, LIS during January 2000 to May 2002<br />
Species<br />
Zones (depth)<br />
Sum <strong>al</strong>l 5 zones A(0–50 cm) B (50–120 cm) C (120–220 cm) D (220–270 cm) E (270–310 cm)<br />
(0–310 cm)<br />
Av. (min–max) Av. (min–max) Av. (min–max) Av. (min–max) Av. (min–max) Av. (min–max)<br />
Algae<br />
Agardhiella subulata 0(0–0) 0 (0–0) 0 (0–0) 0 (0–0) 0 (0–0) 0 (0–0)<br />
Ascophyllum nodosum 1(0–30) 0 (0–0) 0 (0–0) 0 (0–6) 2 (0–30) 0 (0–1)<br />
Erythrocladia irregularis 0(0–1) 0 (0–0) 0 (0–0) 0 (0–0) 0 (0–1) 0 (0–0)<br />
Audouniella daviesii 0(0–1) 0 (0–0) 0 (0–0) 0 (0–0) 0 (0–1) 0 (0–1)<br />
Bangia atropurpurea 1(0–15) 2 (0–15) 1 (0–15) 0 (0–0) 0 (0–0) 0 (0–0)<br />
Blidingia minima 5(0–63) 14 (0–63) 7 (0–63) 3 (0–10) 0 (0–1) 0 (0–0)<br />
Bryopsis plumose 0(0–2) 0 (0–0) 0 (0–0) 0 (0–0) 0 (0–2) 0 (0–2)<br />
Ceramium virgatum 2(0–35) 0 (0–0) 0 (0–0) 0 (0–1) 5 (0–35) 2 (0–16)<br />
Chondrus crispus 19 (0–98) 0 (0–0) 0 (0–0) 0 (0–2) 17 (0–39) 78 (0–98)<br />
Chorda filum 0(0–2) 0 (0–0) 0 (0–0) 0 (0–2) 0 (0–0) 0 (0–0)<br />
Cladophora sp. 0 (0–3) 0 (0–0) 0 (0–0) 0 (0–1) 0 (0–3) 0 (0–1)<br />
Codium fragile subsp. 3(0–43) 0 (0–0) 0 (0–0) 0 (0–0) 13 (0–43) 1 (0–3)<br />
tomentosoides<br />
Dasya baillouviana 0(0–1) 0 (0–0) 0 (0–0) 0 (0–0) 0 (0–0) 0 (0–1)<br />
Desmarestia viridis 0(0–1) 0 (0–0) 0 (0–0) 0 (0–0) 0 (0–0) 0 (0–1)<br />
Coloni<strong>al</strong> Diatoms 2 (0–62) 0 (0–1) 0 (0–0) 1 (0–5) 7 (0–62) 2 (0–22)<br />
Ectocarp<strong>al</strong>es ind<strong>et</strong>. 2 (0–48) 0 (0–0) 1 (0–8) 1 (0–4) 3 (0–23) 5 (0–48)<br />
Elachista fucicola 1(0–6) 0 (0–0) 1 (0–4) 1 (0–5) 1 (0–6) 0 (0–0)<br />
Enteromorpha linza 3(0–40) 2 (0–40) 3 (0–28) 8 (0–37) 3 (0–10) 0 (0–3)<br />
Enteromorpha prolifera 2(0–30) 1 (0–14) 3 (0–30) 6 (0–27) 2 (0–13) 0 (0–1)<br />
Fucus vesiculosus 34 (0–90) 8 (0–23) 68 (0–86) 55 (0–90) 37 (0–71) 1 (0–10)<br />
Hildenbrandia rubra 1(0–10) 0 (0–2) 0 (0–2) 2 (0–10) 1 (0–5) 0 (0–0)<br />
Laminaria juv. 0 (0–1) 0 (0–0) 0 (0–0) 0 (0–0) 0 (0–0) 0 (0–1)<br />
Laminaria saccharina 0(0–1) 0 (0–0) 0 (0–0) 0 (0–0) 0 (0–1) 0 (0–0)<br />
P<strong>et</strong><strong>al</strong>onia fascia 0(0–2) 0 (0–0) 0 (0–0) 0 (0–0) 0 (0–2) 0 (0–1)<br />
Polysiphonia fucoids 0(0–1) 0 (0–0) 0 (0–0) 0 (0–0) 0 (0–1) 0 (0–1)<br />
Neosiphonia harveyi 1(0–11) 0 (0–0) 0 (0–0) 0 (0–0) 1 (0–10) 2 (0–11)<br />
Polysiphonia nigrescens 0(0–1) 0 (0–0) 0 (0–0) 0 (0–0) 0 (0–0) 0 (0–1)<br />
Polysiphonia urceolata 0(0–4) 0 (0–0) 0 (0–0) 0 (0–1) 1 (0–2) 1 (0–4)<br />
Porphyra suborbiculata 1(0–8) 2 (0–8) 1 (0–7) 1 (0–7) 0 (0–0) 0 (0–0)<br />
Porphyra leucosticta A 0 (0–5) 0 (0–0) 0 (0–0) 0 (0–0) 0 (0–2) 1 (0–5)<br />
Porphyra leucosticta C 1 (0–10) 0 (0–3) 1 (0–10) 1 (0–5) 1 (0–8) 0 (0–2)<br />
Scytosiphon lomentaria 0(0–2) 0 (0–0) 0 (0–2) 0 (0–0) 0 (0–0) 0 (0–1)<br />
Sphacelaria sp. 0 (0–6) 0 (0–0) 0 (0–0) 0 (0–0) 1 (0–6) 0 (0–1)<br />
Sphacelaria plumosa 0(0–1) 0 (0–0) 0 (0–0) 0 (0–0) 0 (0–1) 0 (0–1)<br />
Spongomorpha p<strong>al</strong>lida 0(0–1) 0 (0–0) 0 (0–0) 0 (0–0) 0 (0–0) 0 (0–1)<br />
Ulothrix/Urospora spp. 3 (0–66) 11 (0–66) 2 (0–7) 3 (0–11) 1 (0–8) 0 (0–0)<br />
Ulva lactuca 3(0–47) 0 (0–0) 0 (0–0) 2 (0–9) 6 (0–18) 9 (0–47)<br />
Fauna<br />
Alcyonidium und<strong>et</strong>. 0 (0–7) 0 (0–0) 0 (0–0) 0 (0–0) 1 (0–7) 2 (0–6)<br />
B<strong>al</strong>anoids und<strong>et</strong>. 11 (0–97) 18 (0–97) 20 (1–43) 19 (0–50) 0 (0–2) 0 (0–0)<br />
Bryozoa und<strong>et</strong>. 0 (0–1) 0 (0–0) 0 (0–0) 0 (0–0) 0 (0–1) 0 (0–1)<br />
Crepidula fornicate 0(0–2) 0 (0–0) 0 (0–0) 0 (0–0) 0 (0–2) 0 (0–0)<br />
Littorina obtusata 0(0–0) 0 (0–0) 0 (0–0) 0 (0–0) 0 (0–0) 0 (0–0)<br />
Littorina spp. 0 (0–0) 0 (0–0) 0 (0–0) 0 (0–0) 0 (0–0) 0 (0–0)<br />
Mytilus edulis 1(0–10) 0 (0–3) 4 (0–10) 1 (0–7) 0 (0–0) 0 (0–0)<br />
Ostrea sp. 0 (0–2) 0 (0–1) 1 (0–2) 0 (0–2) 0 (0–0) 0 (0–0)<br />
Porifera und<strong>et</strong>. 0 (0–8) 0 (0–0) 0 (0–0) 0 (0–0) 0 (0–8) 0 (0–2)<br />
Sediment: unclassified 3 (0- 0 (0–0) 0 (0–2) 2 (0–14) 10 (0–51) 1 (0–5)
J Appl Phycol<br />
a b Blindingia minima<br />
% Cover<br />
10<br />
0<br />
80<br />
60<br />
40<br />
20<br />
0<br />
Fucus vesiculosus<br />
% Cover<br />
70<br />
60<br />
50<br />
40<br />
30<br />
20<br />
10<br />
0<br />
c<br />
50<br />
Codium fragile<br />
d<br />
50<br />
Ulva lactuca<br />
40<br />
40<br />
30<br />
30<br />
% Cover<br />
20<br />
% Cover<br />
20<br />
10<br />
10<br />
0<br />
0<br />
e<br />
Ceramium rubrum<br />
40<br />
f<br />
10<br />
Porphyra suborbiculata<br />
30<br />
8<br />
% Cover<br />
20<br />
10<br />
% Cover<br />
6<br />
4<br />
2<br />
0<br />
0<br />
g<br />
6<br />
5<br />
4<br />
Porphyra leucosticta Type A<br />
h<br />
12<br />
10<br />
8<br />
Porphyra rosengurttii<br />
Zone A<br />
Zone B<br />
Zone C<br />
Zone D<br />
Zone E<br />
% Cover<br />
3<br />
2<br />
% Cover<br />
6<br />
4<br />
1<br />
2<br />
0<br />
0<br />
01-00 05-00 09-00 01-01 05-01 09-01 01-02 05-02<br />
Date<br />
01-00 05-00 09-00 01-01 05-01 09-01 01-02 05-02<br />
Date<br />
Fig. 5 Difference in percentage cover of 8 important species in the littor<strong>al</strong> zones (a–h) at Cove Island, LIS. Note different sc<strong>al</strong>e of percentage<br />
cover axis. (Note that data b<strong>et</strong>ween June and September 2001 are missing.)
J Appl Phycol<br />
Ulothrix/Urospora and U. lactuca decreased from January<br />
2000 to May 2002, whereas other species like the Porphyra<br />
spp., C. virgatum, N. harveyi and C. fragile subsp.<br />
tomentosiodes increased in abundance over the 2 years.<br />
Two-way crossed simulated ANOVA’s (ANOSIM) were<br />
used to test for differences b<strong>et</strong>ween years (averaged across<br />
<strong>al</strong>l zones) and a two-way nested ANOSIM tested for<br />
differences b<strong>et</strong>ween seasons (averaged across zone groups)<br />
as well as among zones across seasons groups. Both<br />
an<strong>al</strong>ysis showed that <strong>al</strong>l years were significantly different<br />
from each other (glob<strong>al</strong> r=0.23, p
J Appl Phycol<br />
Table 7 Average abundance (percentage cover) and contribution of the 7 most important species/taxa groups to the distribution of samples within<br />
each zone in the MDS an<strong>al</strong>ysis (Fig. 6)<br />
Species<br />
Av.<br />
abund.<br />
Av.<br />
abund.<br />
Contrib.<br />
%<br />
Cum.<br />
%<br />
Species<br />
Av.<br />
abund.<br />
Av.<br />
abund.<br />
Contrib.<br />
%<br />
Cum.<br />
%<br />
Zones A and B: average dissimilarity=50.21<br />
Zones C and D: average dissimilarity=63.12<br />
Zone A Zone B Zone C Zone D<br />
Fucus vesiculosus 8.18 68.03 12.46 12.46 Chondrus crispus 0.19 17.24 8.81 8.81<br />
Mytilus edulis 0.27 4.5 9.96 22.42 B<strong>al</strong>anoids 18.99 0.29 7.91 16.72<br />
B<strong>al</strong>anoids 18.16 19.61 9.17 31.6 Codium fragile 0 13.26 7.6 24.32<br />
Ulothrix/Urospora 10.98 1.93 8.99 40.59 Blidingia minima 2.95 0.04 4.48 28.8<br />
Blidingia minima 13.75 7.44 8.57 49.16 Enteromorpha linza 7.67 2.89 4.47 33.27<br />
Enteromorpha linza 2.4 2.62 6.95 56.11 Ceramium rubrum 0.03 5.26 4.25 37.52<br />
Porphyra<br />
1.57 1.14 6.21 62.32 Hildenbrandia rubra 2.45 0.59 4.21 41.73<br />
suborbiculata<br />
Zones A and C: average dissimilarity=56.66<br />
Zones A and E: average dissimilarity=91.39<br />
Zone A Zone C Zone A Zone E<br />
Fucus vesiculosus 8.18 55.42 9.69 9.69 Chondrus crispus 0 77.61 15.15 15.15<br />
Enteromorpha linza 2.4 7.67 8.52 18.22 Ulva lactuca 0 8.99 7.66 22.81<br />
Blidingia minima 13.75 2.95 8.15 26.37 B<strong>al</strong>anoids 18.16 0 7.32 30.12<br />
B<strong>al</strong>anoids 18.16 18.99 7.87 34.24 Blidingia minima 13.75 0 7.2 37.33<br />
Ulothrix/Urospora 10.98 2.79 7.69 41.93 Ulothrix/Urospora 10.98 0.06 5.69 43.02<br />
Hildenbrandia rubra 0.29 2.45 6.35 48.28 Fucus vesiculosus 8.18 1.38 4.32 47.33<br />
Ulva lactuca 0 1.61 6.18 54.46 Polysiphonia<br />
0 1.44 4.23 51.56<br />
urceolata<br />
Zones B and C: average dissimilarity=42.89<br />
Zones B and E: average dissimilarity=89.34<br />
Zone B Zone C Zone B Zone E<br />
Enteromorpha linza 2.62 7.67 8.36 8.36 Chondrus crispus 0.01 77.61 12.46 12.46<br />
Mytilus edulis 4.5 1.23 7.72 16.08 Fucus vesiculosus 68.03 1.38 9 21.46<br />
Blidingia minima 7.44 2.95 7.02 23.1 B<strong>al</strong>anoids 19.61 0 8.36 29.82<br />
Hildenbrandia rubra 0.42 2.45 6.54 29.64 Ulva lactuca 0.06 8.99 5.63 35.44<br />
Ulothrix/Urospora 1.93 2.79 6.44 36.08 Mytilus edulis 4.5 0 5.62 41.07<br />
Ostrea sp 0.67 0.21 6.35 42.43 Blidingia minima 7.44 0 5.34 46.4<br />
Enteromorpha<br />
3.03 5.75 6.35 48.78 Polysiphonia<br />
0 1.44 3.53 49.94<br />
prolifera<br />
urceolata<br />
Zones A and D: average dissimilarity=79.44<br />
Zones C and E: average dissimilarity=82.81<br />
Zone A Zone D Zone C Zone E<br />
Chondrus crispus 0 17.24 9.17 9.17 Chondrus crispus 0.19 77.61 12.67 12.67<br />
Codium fragile 0 13.26 7.3 16.47 Fucus vesiculosus 55.42 1.38 8.88 21.55<br />
Blidingia minima 13.75 0.04 6.82 23.29 B<strong>al</strong>anoids 18.99 0 8.17 29.72<br />
B<strong>al</strong>anoids 18.16 0.29 6.09 29.38 Enteromorpha linza 7.67 0.34 4.68 34.41<br />
Ulva lactuca 0 5.67 5.96 35.34 Hildenbrandia rubra 2.45 0 4.11 38.51<br />
Ulothrix/Urospora 10.98 1.19 4.82 40.16 Blidingia minima 2.95 0 4.01 42.52<br />
Enteromorpha linza 2.4 2.89 4.68 44.84 Ulva lactuca 1.61 8.99 3.96 46.49<br />
Zones B and D: average dissimilarity=70.2<br />
Zones D and E: average dissimilarity=57.79<br />
Zone B Zone D Zone D Zone E<br />
Chondrus crispus 0.01 17.24 8.56 8.56 Fucus vesiculosus 36.53 1.38 9.58 9.58<br />
B<strong>al</strong>anoids 19.61 0.29 7.86 16.43 Chondrus crispus 17.24 77.61 6.31 15.89<br />
Codium fragile 0 13.26 6.95 23.38 Codium fragile 13.26 0.91 5.33 21.22<br />
Mytilus edulis 4.5 0 6.17 29.55 Enteromorpha linza 2.89 0.34 5.18 26.4<br />
Blidingia minima 7.44 0.04 5.71 35.26 Ceramium rubrum 5.26 2.47 4.81 31.21<br />
Ulva lactuca 0.06 5.67 5.11 40.37 Ectocarpaceae 2.68 5.17 4.8 36.01<br />
Ceramium rubrum 0 5.26 3.9 44.27 Ulva lactuca 5.67 8.99 4.13 40.14<br />
zones from A to E, seemed to increase the higher it was<br />
found in the mid-littor<strong>al</strong>. The same pattern has been found<br />
for species of Porphyra occurring in China (person<strong>al</strong><br />
communication). This might be due to the specimens<br />
different exposure to desiccation. Thick cell w<strong>al</strong>ls might<br />
preserve water b<strong>et</strong>ter during period of desiccation than thin<br />
specimens, hence the gradient in thickness. The thinnest<br />
Porphyra sp was P. leucosticta Type A which was found in
J Appl Phycol<br />
Stress: 0.15<br />
2000<br />
2001<br />
Table 9 Result of two-way nested ANOVA (ANOSIM) on community<br />
structure b<strong>et</strong>ween seasons and b<strong>et</strong>ween zones with season groups<br />
as samples. (A-E are the different zones in the intertid<strong>al</strong>)<br />
2002<br />
Groups<br />
Pairwise tests<br />
R statistic Significance level %<br />
Fig. 7 Multidimension<strong>al</strong> Sc<strong>al</strong>ingof the community structure at Cove<br />
Island from January 2000 to May 2002 with years as overlay<br />
the infra-littor<strong>al</strong> fringe and thereby less exposed to<br />
desiccation.<br />
At Cove Island, C. cripsus was the dominating species<br />
around MLLW and beyond (−40cm). A top-down regulation<br />
was suggested to promote establishment of C. crispus<br />
in sheltered areas in New England; predators like starfish<br />
(Asteria forbesi and Asterias vulgaris), dogwinkles<br />
(Nucella lapillus) and periwinkles (Littorina littorea) have<br />
been shown to prevent establishment of the comp<strong>et</strong>itive<br />
dominant Mytilus edulis in mid- and lower mid-littor<strong>al</strong><br />
zones (Lubchenco and Menge 1978; Menge 2000; P<strong>et</strong>raitis<br />
1983, 1987). Periwinkles (Littorina littorea, L. obtusata L.<br />
and sm<strong>al</strong>l Littorina sp.) were observed within the frames<br />
among F. vesiculosus at Cove Island, but their abundance<br />
was low (average < 0.4%). A top-down regulation suggested<br />
by Lubchenco (1983) explains to some extent the main<br />
zonation pattern at Cove Island. A mid-littor<strong>al</strong> zone<br />
consisting of more or less sm<strong>al</strong>l rocks and pebbles next to<br />
the study site (2–3 m) was dominated by periwinkles. Very<br />
Table 8 Result of a two-way crossed ANOVA (ANOSIM) on the<br />
community structure b<strong>et</strong>ween years and b<strong>et</strong>ween zones with years as<br />
samples<br />
Groups<br />
Pairwise tests<br />
R statistic Significance level %<br />
A – B 0.405 0.1<br />
A – C 0.633 0.1<br />
A – D 0.978 0.1<br />
A – E 0.998 0.1<br />
B – C 0.351 0.1<br />
B – D 0.952 0.1<br />
B – E 1 0.1<br />
C – D 0.786 0.1<br />
C – E 0.993 0.1<br />
D – E 0.559 0.1<br />
Tests for differences b<strong>et</strong>ween Year groups (averaged across <strong>al</strong>l Zone<br />
groups): Glob<strong>al</strong> test; sample statistic (Glob<strong>al</strong> R): 0.226 ( p
J Appl Phycol<br />
from each other (Table 6). As shown in Table 8, F.<br />
vesiculosus dominated in the middle zones B, C and D,<br />
and C. crispus was irrefutably the dominant species in the<br />
sublittor<strong>al</strong> fringe (zone E). These patterns coincide with the<br />
structure found in the littor<strong>al</strong> shores of protected and semiprotected<br />
shores in New England (Lubchenco 1980, 1983;<br />
Menge 1976).<br />
The community structure from January to April was<br />
different in 2002 than in the two previous years. This<br />
corresponds with differences in environment<strong>al</strong> data from<br />
LIS (Fig. 3) and climate data from Stamford (Fig. 4), where<br />
the winter months were plotted far from each other. High<br />
temperature in LIS and in the air during the winter 2001/<br />
2002 coincided with the changes in species abundances<br />
during same period. High temperature significantly promoted<br />
the occurrence of Codium fragile, Porphyra spp. and<br />
other red <strong>al</strong>ga like Ceramium virgatum ( p
J Appl Phycol<br />
angle: the seaweed perspective, and the ration<strong>al</strong>e for promoting<br />
integrated aquaculture. Cape Cod Press, F<strong>al</strong>mouth USA<br />
Chopin T, Yarish C, Neefus C, Kraemer GP, Belyea E, Carmona R,<br />
Saunders GW, Bates C, Page F, Dowd M (2001c) Underutilized<br />
tools: seaweeds as bioremediation and diversification tools and<br />
bioindicators for integrated aquaculture and coast<strong>al</strong> management.<br />
J Phycol 37:12–12<br />
Clarke KR (1993) Non-param<strong>et</strong>ric multivariate an<strong>al</strong>ysis of changes in<br />
community structure. Aust J Ecol 18:117–143<br />
Clarke KR, Ainsworth M (1993) A m<strong>et</strong>hod of linking multivariate<br />
community structure to environment<strong>al</strong> variables. Mar Ecol Prog<br />
Ser 92:205–219<br />
Dudgeon SR, Steneck RS, Davison IR, Vadas RL (1999) Coexistence<br />
of similar species in a space-limited intertid<strong>al</strong> zone. Ecol Monogr<br />
69:331–352<br />
Gray JS, Clarke KR, Warwick RM, Hobbs G (1990) D<strong>et</strong>ection of<br />
initi<strong>al</strong> effects of pollution on marine benthos: An example from<br />
the Ekofisk and Eldfisk oilfields, North Sea. Mar Ecol Prog Ser<br />
66:285–299<br />
Hiscock K, Mitchell R (1980) The discription and classification of<br />
sublittor<strong>al</strong> epibenthic ecosystems. In Farnham WF, Irvine DEG,<br />
Price JH (eds) The shore environment, Vol. 2. Ecosystems.<br />
Academic Press, London, 323–370<br />
Hunter MD, Price PW (1992) Playing chutes and ladders: h<strong>et</strong>erogeneity<br />
and the relative roles of bottom-up and top-down forces in natur<strong>al</strong><br />
communities. Ecology 73:724–732<br />
Keser M, Swenarton JT, Vozarik JM, Foertch JF (2003) Decline in<br />
eelgrass (Zostera marina L.) in Long Island Sound near Millstone<br />
Point, Connecticut (USA) unrelated to therm<strong>al</strong> input. J Sea Res<br />
49:11–26<br />
Keser M, Swenarton JT, Foertch JF (2005) Effects of therm<strong>al</strong> input<br />
and climate change on growth of Ascophyllum nodosum (Fuc<strong>al</strong>es,<br />
Phaeophycea) in eastern Long Island Sound (USA). J Sea Res<br />
54:211–220<br />
Lasiak T (2003) Influence of taxonomic resolution, biologic<strong>al</strong> attributes<br />
and data transformations on multivariate comparisons of rocky<br />
macrofaun<strong>al</strong> assemblages. Mar Ecol Prog Ser 250:29–34<br />
Leonard GH (2000) Latitudin<strong>al</strong> variation in species interactions: A test<br />
in the New England rocky intertid<strong>al</strong> zone. Ecology 81:1015–<br />
1030<br />
Leonard GH, Levine JM, Schmidt PR, Bertness MD (1998) Flowdriven<br />
variation in intertid<strong>al</strong> community structure in a Maine<br />
estuary. Ecology 79:1395–1411<br />
Levine IA (1998) Commerci<strong>al</strong> cultivation of Porphyra (nori) in the<br />
United States. World Aquac 29:37–47<br />
Lindstrom SC, Cole KM (1993) The systematics of Porphyra:<br />
Character evolution in closely related species. Hydrobiologia<br />
260–261:151–157<br />
Lubchenco J (1980) Alg<strong>al</strong> zonation in the New England rocky<br />
intertid<strong>al</strong> community: an experiment<strong>al</strong> an<strong>al</strong>ysis. Ecology 61:333–<br />
344<br />
Lubchenco J (1983) Littorina and Fucus: Effects of herbivores,<br />
substratum h<strong>et</strong>erogeneity, and plant escapes during succession.<br />
Ecology 64:1116–1123<br />
Lubchenco J, Menge BA (1978) Community development and<br />
persistence in a low rocky intertid<strong>al</strong> zone. Ecol Monogr:67–94<br />
Mathieson AC, Penniman CA (1986) Species composition and<br />
season<strong>al</strong>ity of New England seaweeds <strong>al</strong>ong an open coast<strong>al</strong>estuarine<br />
gradient. Bot Mar 29:161–176<br />
Mathieson AC, Shipman JW, O’Shea JR, Hasevlat RC (1976)<br />
Season<strong>al</strong> growth and reproduction of estuarine fucoid <strong>al</strong>gae in<br />
New England. J Exp Mar Biol Ecol 25:273–284<br />
Mathieson AC, Hehre EJ, Reynolds NB (1981a) Investigations of New<br />
England marine <strong>al</strong>gae I: A floristic and descriptive ecologic<strong>al</strong><br />
study of the marine <strong>al</strong>gae at Jaffrey Point, New Hampshire,<br />
U.S.A. Bot Mar 24:521–532<br />
Mathieson AC, Reynolds NB, Hehre EJ (1981b) Investigations of<br />
New England marine <strong>al</strong>gae II: The species composition,<br />
distribution and zonation of seaweeds in the Great Bay Estuary<br />
System and the adjacent open coast of New Hampshire. Bot Mar<br />
24:533–546<br />
Menge BA (1976) Organization of the New England rocky intertid<strong>al</strong><br />
community: Role of predation, comp<strong>et</strong>ition and environment<strong>al</strong><br />
h<strong>et</strong>erogeneity. Ecol Monogr 46:355–393<br />
Menge BA (1978a) Predation intensity in a rocky intertid<strong>al</strong> community.<br />
Relation b<strong>et</strong>ween predator foraging activity and environment<br />
harshness. Oecologia 34:1–16<br />
Menge BA (1978b) Predation intensity in a rocky intertid<strong>al</strong> community.<br />
Effect of an <strong>al</strong>g<strong>al</strong> canopy, wave action and desiccation on predator<br />
feeding rates. Oecologia 34:17–35<br />
Menge BA (1983) Components of predation intensity in the low zone<br />
of the New England rocky interdit<strong>al</strong> region. Oecologia 58:141–<br />
155<br />
Menge BA (1991) Gener<strong>al</strong>izing from experiments: Is predation<br />
strong or weak in the New England rocky intertid<strong>al</strong>? Oecologia<br />
88:1–8<br />
Menge BA (2000) Top-down and bottom-up community regulation<br />
in marine rocky intertid<strong>al</strong> habitats. J Exp Mar Biol Ecol: 257–<br />
289<br />
Menge BA, D<strong>al</strong>ey BA, Lubchenco J, Sanford E, Dahlhoff E, H<strong>al</strong>pin<br />
PM, Hudson G, Burnaford JL (1999) Top-down and bottom-up<br />
regulation of New Ze<strong>al</strong>and rocky intertid<strong>al</strong> communities. Ecol<br />
Monogr 69:297–330<br />
Neefus CD, Mathieson AC, Yarish C, Klein A, West A, Teasd<strong>al</strong>e B,<br />
Hehre EJ (2000) Five cryptic species of Porphyra from the<br />
Northwest Atlantic. J Phycol 36:suppl<br />
Neefus CD, Mathieson AC, Klein AS, Teasd<strong>al</strong>e B, Bray T, Yarish C<br />
(2002) Porphyra birdiae sp. nov. (Bangi<strong>al</strong>es, Rhodophyta): A<br />
new species from the Northwest Atlantic. Algae 17:203–216<br />
Nelson WA, Knight GA, Hawkes MW (1998) Porphyra lilliputiana<br />
sp. nov. (Bangi<strong>al</strong>es, Rhodophyta): A diminutive New Ze<strong>al</strong>and<br />
endemic with novel reproductive biology. Phycol Res 46:57–61<br />
Nelson WA, Broom JE, Farr TJ (2000) Confusing convergent morphologies:<br />
Diversity and difficulties in New Ze<strong>al</strong>and Erythropeltid<strong>al</strong>es<br />
and Bangi<strong>al</strong>es. J Phycol 36<br />
Nelson WA, Broom JE, Farr TJ (2001) Four new species of Porphyra<br />
(Bangi<strong>al</strong>es, Rhodophyta) from the New Ze<strong>al</strong>and region described<br />
using tradition<strong>al</strong> characters and 18S rDNA sequence data.<br />
Cryptogamie: Algol 22:263–284<br />
Olsgard F, Somerfield PJ (2000) Surrogates in marine benthic<br />
investigations – which taxonomic unit to targ<strong>et</strong>? J Aquat Ecosyst<br />
Stress Recovery 7:25–42<br />
Olsgard F, Somerfield PJ, Carr MR (1997) Relationships b<strong>et</strong>ween<br />
taxonomic resolution and data transformations in an<strong>al</strong>yses of a<br />
macrobenthic community <strong>al</strong>ong an established pollution gradient.<br />
Mar Ecol Prog Ser 149:1–3<br />
Olsgard F, Somerfield PJ, Carr MR (1998) Relationships b<strong>et</strong>ween<br />
taxonomic resolution, macrobenthic community patterns and<br />
disturbance. Mar Ecol 172:25–36<br />
Oohusa T (1992) Recent trends in nori products and mark<strong>et</strong>s in Asia. J<br />
Appl Phycol 5:155–159<br />
Pearson ES, Hartley HO (1966) Biom<strong>et</strong>rika Tables for Statisticians.<br />
Cambridge<br />
P<strong>et</strong>raitis PS (1983) Grazing patterns of the periwinkle and their effect<br />
on sessile intertid<strong>al</strong> organisms. Ecology 64:522–533<br />
P<strong>et</strong>raitis PS (1987) Factors organizing rocky intertid<strong>al</strong> communities of<br />
New England: Herbivory and predation in sheltered bays. J Exp<br />
Mar Biol Ecol 109:117–136<br />
Sears JR (1998) NEAS Keys to the Benthic Marine Algae of the<br />
Northeastern Coast of North America from Long Island Sound to<br />
the Strait of Belle Isle. Available from the UMass Dartmouth<br />
Campus Book Store, Dartmouth, MA
J Appl Phycol<br />
Terlizzi A, Frasch<strong>et</strong>ti S, Guid<strong>et</strong>ti P, Boero F (2002) The effects of<br />
sewage discharge on sh<strong>al</strong>low hard substrate sessile assemblages.<br />
Mar Pollut Bull 44:544–550<br />
Terlizzi A, Bevilacqua S, Frasch<strong>et</strong>ti S, Boero F (2003) Taxonomic<br />
sufficiency and the increasing insufficiency of taxonomic<br />
expertise. Mar Pollut Bull 46:556–561<br />
Tseng CK, Fei XG (1987) Economic aspects of seaweed cultivation:<br />
Macro<strong>al</strong>g<strong>al</strong> commerci<strong>al</strong>ization in the Orient. Hydrobiol 151–<br />
152:167–172<br />
Warwick RM (1988) Effects on community structure of a pollutant<br />
gradient – summary. Mar Ecol Prog Ser 46:207–211<br />
Yarish C, Frankenstein G, Sperr AE, Fei XC, Mathieson AC, Levine I<br />
(1997) Domestication of Porphyra (=nori) for north-east America.<br />
J Shellf Res 16:296–297<br />
Yarish C, Wilkes R, Chopin T, Fei XG, Mathieson AC, Klein AS,<br />
Neefus CD, Mitman GG, Levine I (1998) Domestication of<br />
indigenous Porphyra (nori) species for commerci<strong>al</strong> cultivation in<br />
Northeast America. World Aquac 29:26–30<br />
Yarish C, Chopin T, Wilkes R, Mathieson AC, Fei XG, Lu S,<br />
Parsons GJ (1999) Domestication of nori for northeast<br />
America: The Asian experience. Bull Aquac Assoc Can 99–<br />
1:11–17