

BPIE: Europe's buildings under the microscope - PU Europe
BPIE: Europe's buildings under the microscope - PU Europe
BPIE: Europe's buildings under the microscope - PU Europe

Create successful ePaper yourself
Turn your PDF publications into a flip-book with our unique Google optimized e-Paper software.
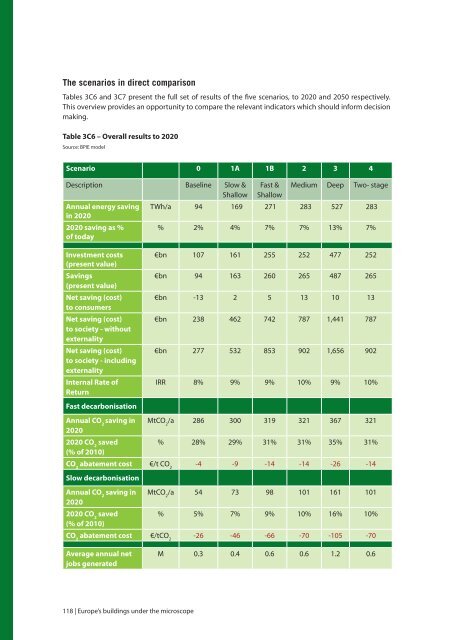
The scenarios in direct comparison<br />
Tables 3C6 and 3C7 present <strong>the</strong> full set of results of <strong>the</strong> five scenarios, to 2020 and 2050 respectively.<br />
This overview provides an opportunity to compare <strong>the</strong> relevant indicators which should inform decision<br />
making.<br />
Table 3C6 – Overall results to 2020<br />
Source: <strong>BPIE</strong> model<br />
Scenario 0 1A 1B 2 3 4<br />
Description Baseline Slow &<br />
Shallow<br />
Annual energy saving<br />
in 2020<br />
2020 saving as %<br />
of today<br />
Investment costs<br />
(present value)<br />
Savings<br />
(present value)<br />
Net saving (cost)<br />
to consumers<br />
Net saving (cost)<br />
to society - without<br />
externality<br />
Net saving (cost)<br />
to society - including<br />
externality<br />
Internal Rate of<br />
Return<br />
Fast decarbonisation<br />
Fast &<br />
Shallow<br />
Medium Deep Two- stage<br />
TWh/a 94 169 271 283 527 283<br />
% 2% 4% 7% 7% 13% 7%<br />
€bn 107 161 255 252 477 252<br />
€bn 94 163 260 265 487 265<br />
€bn -13 2 5 13 10 13<br />
€bn 238 462 742 787 1,441 787<br />
€bn 277 532 853 902 1,656 902<br />
IRR 8% 9% 9% 10% 9% 10%<br />
Annual CO 2<br />
saving in MtCO 2<br />
/a 286 300 319 321 367 321<br />
2020<br />
2020 CO 2<br />
saved<br />
% 28% 29% 31% 31% 35% 31%<br />
(% of 2010)<br />
CO 2<br />
abatement cost €/t CO 2<br />
-4 -9 -14 -14 -26 -14<br />
Slow decarbonisation<br />
Annual CO 2<br />
saving in MtCO 2<br />
/a 54 73 98 101 161 101<br />
2020<br />
2020 CO 2<br />
saved<br />
% 5% 7% 9% 10% 16% 10%<br />
(% of 2010)<br />
CO 2<br />
abatement cost €/tCO 2<br />
-26 -46 -66 -70 -105 -70<br />
Average annual net<br />
jobs generated<br />
M 0.3 0.4 0.6 0.6 1.2 0.6<br />
118 | <strong>Europe</strong>’s <strong>buildings</strong> <strong>under</strong> <strong>the</strong> <strong>microscope</strong>


