

BPIE: Europe's buildings under the microscope - PU Europe
BPIE: Europe's buildings under the microscope - PU Europe
BPIE: Europe's buildings under the microscope - PU Europe

You also want an ePaper? Increase the reach of your titles
YUMPU automatically turns print PDFs into web optimized ePapers that Google loves.
Scenarios 1a (Slow & shallow) and 1b (Fast & shallow)<br />
These two scenarios both take <strong>the</strong> shallow renovation path. They compare <strong>the</strong> impact of a rapid<br />
acceleration in <strong>the</strong> rate of renovation (“Fast & shallow”) with a slow but steady ramping up (“Slow &<br />
shallow”). These scenarios are shown in order to illustrate <strong>the</strong> consequences of focusing mainly on<br />
shallow renovation measures which may be perceived as <strong>the</strong> “cheaper and more pragmatic solution”.<br />
As might be expected, <strong>the</strong> energy savings to 2020 are greater <strong>under</strong> <strong>the</strong> fast scenario (7%) where <strong>the</strong><br />
renovation rate rapidly rises to 2.6% of <strong>the</strong> building stock p.a. The slow scenario achieves a renovation<br />
rate of just 1.4% by 2020, delivering 4% energy savings. However, this position is reversed by 2050 as<br />
more <strong>buildings</strong> are renovated to a greater depth <strong>under</strong> <strong>the</strong> slow scenario. The corresponding figures for<br />
2050 are:<br />
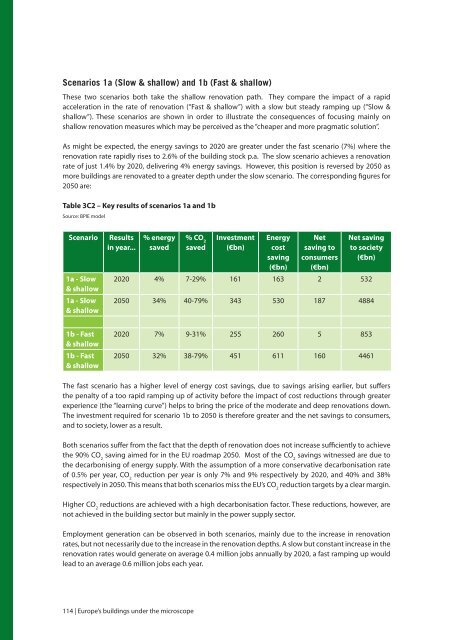
Table 3C2 – Key results of scenarios 1a and 1b<br />
Source: <strong>BPIE</strong> model<br />
Scenario<br />
1a - Slow<br />
& shallow<br />
1a - Slow<br />
& shallow<br />
Results<br />
in year...<br />
% energy<br />
saved<br />
% CO 2<br />
saved<br />
Investment<br />
(€bn)<br />
Energy<br />
cost<br />
saving<br />
(€bn)<br />
Net<br />
saving to<br />
consumers<br />
(€bn)<br />
Net saving<br />
to society<br />
(€bn)<br />
2020 4% 7-29% 161 163 2 532<br />
2050 34% 40-79% 343 530 187 4884<br />
1b - Fast<br />
& shallow<br />
1b - Fast<br />
& shallow<br />
2020 7% 9-31% 255 260 5 853<br />
2050 32% 38-79% 451 611 160 4461<br />
The fast scenario has a higher level of energy cost savings, due to savings arising earlier, but suffers<br />
<strong>the</strong> penalty of a too rapid ramping up of activity before <strong>the</strong> impact of cost reductions through greater<br />
experience (<strong>the</strong> “learning curve”) helps to bring <strong>the</strong> price of <strong>the</strong> moderate and deep renovations down.<br />
The investment required for scenario 1b to 2050 is <strong>the</strong>refore greater and <strong>the</strong> net savings to consumers,<br />
and to society, lower as a result.<br />
Both scenarios suffer from <strong>the</strong> fact that <strong>the</strong> depth of renovation does not increase sufficiently to achieve<br />
<strong>the</strong> 90% CO 2<br />
saving aimed for in <strong>the</strong> EU roadmap 2050. Most of <strong>the</strong> CO 2<br />
savings witnessed are due to<br />
<strong>the</strong> decarbonising of energy supply. With <strong>the</strong> assumption of a more conservative decarbonisation rate<br />
of 0.5% per year, CO 2<br />
reduction per year is only 7% and 9% respectively by 2020, and 40% and 38%<br />
respectively in 2050. This means that both scenarios miss <strong>the</strong> EU’s CO 2<br />
reduction targets by a clear margin.<br />
Higher CO 2<br />
reductions are achieved with a high decarbonisation factor. These reductions, however, are<br />
not achieved in <strong>the</strong> building sector but mainly in <strong>the</strong> power supply sector.<br />
Employment generation can be observed in both scenarios, mainly due to <strong>the</strong> increase in renovation<br />
rates, but not necessarily due to <strong>the</strong> increase in <strong>the</strong> renovation depths. A slow but constant increase in <strong>the</strong><br />
renovation rates would generate on average 0.4 million jobs annually by 2020, a fast ramping up would<br />
lead to an average 0.6 million jobs each year.<br />
114 | <strong>Europe</strong>’s <strong>buildings</strong> <strong>under</strong> <strong>the</strong> <strong>microscope</strong>


