Multiple benefits of renovation in buildings - PU Europe
Multiple benefits of renovation in buildings - PU Europe
Multiple benefits of renovation in buildings - PU Europe

Create successful ePaper yourself
Turn your PDF publications into a flip-book with our unique Google optimized e-Paper software.
<strong>Multiple</strong> <strong>benefits</strong> <strong>of</strong> <strong>in</strong>vest<strong>in</strong>g <strong>in</strong> energy<br />
efficient <strong>renovation</strong> <strong>of</strong> build<strong>in</strong>gs<br />
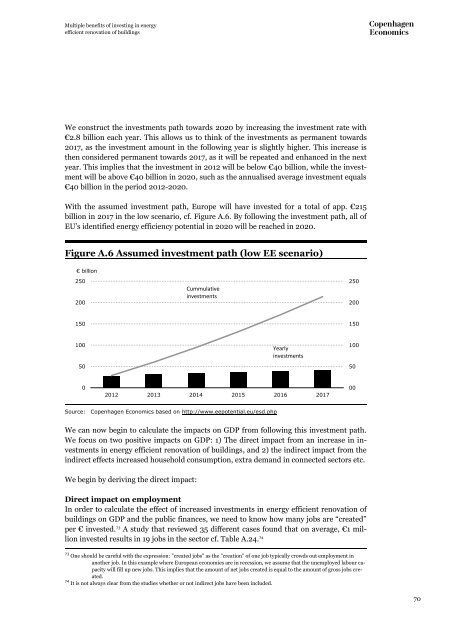
We construct the <strong>in</strong>vestments path towards 2020 by <strong>in</strong>creas<strong>in</strong>g the <strong>in</strong>vestment rate with<br />
€2.8 billion each year. This allows us to th<strong>in</strong>k <strong>of</strong> the <strong>in</strong>vestments as permanent towards<br />
2017, as the <strong>in</strong>vestment amount <strong>in</strong> the follow<strong>in</strong>g year is slightly higher. This <strong>in</strong>crease is<br />
then considered permanent towards 2017, as it will be repeated and enhanced <strong>in</strong> the next<br />
year. This implies that the <strong>in</strong>vestment <strong>in</strong> 2012 will be below €40 billion, while the <strong>in</strong>vestment<br />
will be above €40 billion <strong>in</strong> 2020, such as the annualised average <strong>in</strong>vestment equals<br />
€40 billion <strong>in</strong> the period 2012-2020.<br />
With the assumed <strong>in</strong>vestment path, <strong>Europe</strong> will have <strong>in</strong>vested for a total <strong>of</strong> app. €215<br />
billion <strong>in</strong> 2017 <strong>in</strong> the low scenario, cf. Figure A.6. By follow<strong>in</strong>g the <strong>in</strong>vestment path, all <strong>of</strong><br />
EU’s identified energy efficiency potential <strong>in</strong> 2020 will be reached <strong>in</strong> 2020.<br />
Figure A.6 Assumed <strong>in</strong>vestment path (low EE scenario)<br />
€ billion<br />
250<br />
200<br />
Cummulative<br />
<strong>in</strong>vestments<br />
250<br />
200<br />
150<br />
150<br />
100<br />
50<br />
Yearly<br />
<strong>in</strong>vestments<br />
100<br />
50<br />
0<br />
2012 2013 2014 2015 2016 2017<br />
00<br />
Source: Copenhagen Economics based on http://www.eepotential.eu/esd.php<br />
We can now beg<strong>in</strong> to calculate the impacts on GDP from follow<strong>in</strong>g this <strong>in</strong>vestment path.<br />
We focus on two positive impacts on GDP: 1) The direct impact from an <strong>in</strong>crease <strong>in</strong> <strong>in</strong>vestments<br />
<strong>in</strong> energy efficient <strong>renovation</strong> <strong>of</strong> build<strong>in</strong>gs, and 2) the <strong>in</strong>direct impact from the<br />
<strong>in</strong>direct effects <strong>in</strong>creased household consumption, extra demand <strong>in</strong> connected sectors etc.<br />
We beg<strong>in</strong> by deriv<strong>in</strong>g the direct impact:<br />
Direct impact on employment<br />
In order to calculate the effect <strong>of</strong> <strong>in</strong>creased <strong>in</strong>vestments <strong>in</strong> energy efficient <strong>renovation</strong> <strong>of</strong><br />
build<strong>in</strong>gs on GDP and the public f<strong>in</strong>ances, we need to know how many jobs are “created”<br />
per € <strong>in</strong>vested. 73 A study that reviewed 35 different cases found that on average, €1 million<br />
<strong>in</strong>vested results <strong>in</strong> 19 jobs <strong>in</strong> the sector cf. Table A.24. 74<br />
73 One should be careful with the expression: ”created jobs” as the ”creation” <strong>of</strong> one job typically crowds out employment <strong>in</strong><br />
another job. In this example where <strong>Europe</strong>an economies are <strong>in</strong> recession, we assume that the unemployed labour capacity<br />
will fill up new jobs. This implies that the amount <strong>of</strong> net jobs created is equal to the amount <strong>of</strong> gross jobs created.<br />
74 It is not always clear from the studies whether or not <strong>in</strong>direct jobs have been <strong>in</strong>cluded.<br />
70