first order derivative spectrophotometric and hplc methods for ...
first order derivative spectrophotometric and hplc methods for ...
first order derivative spectrophotometric and hplc methods for ...

You also want an ePaper? Increase the reach of your titles
YUMPU automatically turns print PDFs into web optimized ePapers that Google loves.
394 BEATA STANISZ et al.<br />
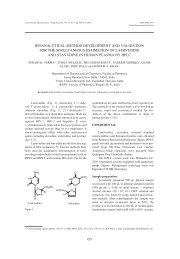
Figure 5. Stability-indicative assay of MOXL by HPLC. Chromatograms obtained <strong>for</strong> MOXL in methanol in t = 0 (A), <strong>and</strong> after <strong>for</strong>ced<br />
degradation test (t = 8 h, RH = 76.4%, T = 363 K) (B) <strong>and</strong> a semi-logarythmic plot of P I /P IS versus time <strong>for</strong> a degradation reaction in a<br />
solid state (C).<br />
the calibration curves were obtained from a linear<br />
regression analysis of the <strong>derivative</strong> amplitudes versus<br />
corresponding drug concentrations. The linearity<br />
of the calibration graph in a range of<br />
0.00012ñ0.00120% was validated by the high value<br />
of correlation coefficient <strong>and</strong> intercept value, which<br />
was statistically insignificant (Table 2). The regression<br />
equation was calculated as Y = aC + b, where<br />
ìCî st<strong>and</strong>s <strong>for</strong> MOXL concentrations <strong>and</strong> the value<br />
of the intercept ìbî is not statistically different from<br />
zero.<br />
In <strong>order</strong> to assess the accuracy of the investigated<br />
method, the recovery study was conducted by<br />
analyzing the synthetic model mixtures of MOXL in<br />
three different ratios according to the procedure<br />
described above. The results are presented in Table<br />
2. High (ca. 100.0%) recovery <strong>and</strong> low st<strong>and</strong>ard<br />
deviation was observed <strong>for</strong> <strong>first</strong> <strong>derivative</strong> UV spectroscopic<br />
method.<br />
The precision of the proposed method was<br />
evaluated by replicate determination of eight samples<br />
at three different concentrations: low<br />
(0.00012%), medium (0.0006%) <strong>and</strong> high<br />
(0.0012%) (Table 2). To assess the repeatability<br />
(intra-day), ten samples were determined <strong>for</strong> MOXL<br />
concentration of 0.0006%. CV(%) value was < 1.5%<br />
indicating a good precision of this measurement<br />
(Table 2).<br />
The validated <strong>first</strong> <strong>derivative</strong> UV <strong>spectrophotometric</strong><br />
method was subsequently evaluated <strong>for</strong> its<br />
utility <strong>for</strong> analysis of MOXL in tablets (Fig. 3). The<br />
absorption spectrum of Cardiotensin 7.5 mg tablets<br />
methanolic extract was recorded <strong>and</strong> compared with<br />
the pure MOXL absorption spectrum (Fig. 3). No<br />
spectral interferences were observed between excipients<br />
used <strong>for</strong> the tabletsí <strong>for</strong>mulation <strong>and</strong> the active<br />
substance, which evidences the methodís applicability<br />
<strong>for</strong> the determination of MOXL in tablets.<br />
Additionally, the results of the determination<br />
of MOXL in tablets obtained by means of the proposed<br />
method were statistically compared with the<br />
results obtained by means of the reference ñ HPLC<br />
method using Student t- <strong>and</strong> -Snedecor F- tests<br />
(Table 2). It was evidenced that there is no significant<br />
difference between the two <strong>methods</strong> with<br />
respect to mean values <strong>and</strong> st<strong>and</strong>ard deviations indicating<br />
that <strong>first</strong> <strong>derivative</strong> UV <strong>spectrophotometric</strong><br />
method is equally precise <strong>and</strong> accurate as HPLC<br />
method <strong>and</strong> can be recommended <strong>for</strong> routine analyses<br />
of MOXL in tablets.<br />
The proposed method was finally tested as a<br />
stability-indicative assay <strong>for</strong> MOXL in solid state<br />
according to the above referenced procedure. It was<br />
observed that the UV spectra of MOXL methanol<br />
solutions subjected to the kinetic studies (over conditions<br />
described in Procedure <strong>for</strong> MOXL kinetic<br />
study) do not differ from those not subjected to<br />
decomposition study (Fig. 4). Changes in MOXL<br />
concentration during time t were observed only in<br />
HPLC method. The results obtained by means of<br />
HPLC evidenced that the MOXL decomposition proceeds<br />
according to the <strong>first</strong> <strong>order</strong> reaction model <strong>and</strong><br />
the decomposition rate constant is k ± Dk = (3.67 ±<br />
0.13) ◊ 10 -5 s -1 . The results are presented in Fig. 5.<br />
CONCLUSION<br />
This is the <strong>first</strong> study investigating the utility of<br />
<strong>first</strong> <strong>derivative</strong> UV <strong>spectrophotometric</strong> method as a<br />
stability-indicative assay <strong>for</strong> MOXL stability evaluation.<br />
The proposed method is accurate (the recovery<br />
about 100%), linear (r = 0.999), precise (SD