first order derivative spectrophotometric and hplc methods for ...
first order derivative spectrophotometric and hplc methods for ...
first order derivative spectrophotometric and hplc methods for ...

You also want an ePaper? Increase the reach of your titles
YUMPU automatically turns print PDFs into web optimized ePapers that Google loves.
Acta Poloniae Pharmaceutica ñ Drug Research, Vol. 69 No. 3 pp. 389ñ395, 2012 ISSN 0001-6837<br />
Polish Pharmaceutical Society<br />
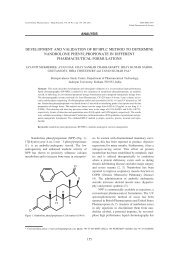
FIRST ORDER DERIVATIVE SPECTROPHOTOMETRIC AND HPLC<br />
METHODS FOR DETERMINATION OF MOEXIPRIL HYDROCHLORIDE<br />
IN THE PURE FORM, PHARMECEUTICAL FORMULATIONS<br />
AND EVALUATION OF ITS STABILITY<br />
BEATA STANISZ* , KATARZYNA REGULSKA <strong>and</strong> TOMASZ RATAJCZAK<br />
Department of Pharmaceutical Chemistry, University of Medical Sciences,<br />
6 Grunwaldzka St., 60-780 PoznaÒ, Pol<strong>and</strong><br />
Abstract: A rapid, linear (over a concentration range of 0.00012ñ0.0012% <strong>and</strong> with correlation coefficient r =<br />
0.999), accurate (an average recovery of 100%), precise (an average st<strong>and</strong>ard deviation < 1.5%) <strong>and</strong> economical<br />
<strong>first</strong> <strong>derivative</strong> UV <strong>spectrophotometric</strong> assay method (λ max = 238 nm) was developed <strong>for</strong> the determination<br />
of moexipril hydrochloride (MOXL) in a pharmaceutical <strong>for</strong>mulation. The method was investigated <strong>for</strong> its utility<br />
<strong>for</strong> the determination of MOXL in commercially available tablets <strong>and</strong> as a stability-indicative assay in solid<br />
state. The results obtained by means of the investigated method were statistically compared (t-Student test <strong>and</strong><br />
F-Snedecor test) with the results obtained by means of the reference method ñ HPLC, which evidenced that<br />
both <strong>methods</strong> are equally precise <strong>and</strong> accurate. It was finally concluded that <strong>first</strong> <strong>derivative</strong> UV spectrophotometry<br />
is selective with reference to excipients used <strong>for</strong> the tabletsí <strong>for</strong>mulation, however, it is not selective<br />
with reference to MOXL degradation products.<br />
Keywords: moexipril hydrochloride (MOXL), HPLC method, <strong>derivative</strong> UV spectroscopic method, validation<br />
Hypertension is currently considered to be one<br />
of the most serious chronic illnesses. The class of<br />
drugs of considerable clinical importance in terms of<br />
cardiovascular diseases management are angiotensin<br />
converting enzyme inhibitors. The physiological<br />
effect of these agents on the renin-angiotensinaldosterone<br />
system is the competitive inhibition of<br />
angiotensin-converting enzyme <strong>and</strong> resulting inhibition<br />
of the conversion of the relatively inactive<br />
angiotensin I to the highly potent vasoconstrictor ñ<br />
angiotensin II. This finally leads to the reduction of<br />
arterial blood pressure (1ñ3).<br />
A new, orally active, non-sulfhydryl containing<br />
representative ñ moexipril hydrochloride, has<br />
been chosen as a subject to our study. Chemically it<br />
is (3S)-2-[(2S)-2-{[(1S)-1-(ethoxycarbonyl)-3-phen-<br />
ylpropyl]amino}-1-oxopropyl]-6,7-dimethoxy-<br />
1,2,3,4-tetrahydroisoquinoline-3-carboxylic acid<br />
hydrochloride (3).<br />
This drug is usually used in the treatment of<br />
hypertension at a typical daily dose of 7.5ñ15 mg<br />
<strong>and</strong> congestive heart failure <strong>and</strong> its administration<br />
regimen includes monotherapy or coadministration<br />
with other antihypertensives or diuretics (4, 5).<br />
Quality assurance in pharmaceutical industry,<br />
in accordance to ICH guidelines, plays a crucial role<br />
in further efficiency <strong>and</strong> safety of a therapy. Purity<br />
or stability of active ingredients <strong>and</strong> medicinal products<br />
is a basic aspect of a drug quality control.<br />
There<strong>for</strong>e, the development <strong>and</strong> further validation of<br />
sensitive, rapid, simple, inexpensive <strong>and</strong> reliable<br />
<strong>methods</strong> <strong>for</strong> stability <strong>and</strong> purity assessment is of<br />
great importance <strong>and</strong> interest (6, 7).<br />
MOXL it is not listed in any pharmacopeia<br />
thus there is no officially approved method <strong>for</strong> its<br />
analysis in its dosage <strong>for</strong>ms nor in biological material.<br />
A literature survey revealed several analytical<br />
procedures that have been described <strong>for</strong> MOXL<br />
determination. These include: <strong>derivative</strong> <strong>spectrophotometric</strong><br />
method <strong>and</strong> isocratic RP-HPLC<br />
method, which have been reported <strong>for</strong> the simultaneous<br />
determination of MOXL <strong>and</strong> hydrochlorothiazide<br />
in its co-<strong>for</strong>mulated <strong>for</strong>m (8), three simple<br />
<strong>spectrophotometric</strong> <strong>methods</strong> described <strong>for</strong> the assay<br />
of MOXL either in bulk <strong>for</strong>m or in the presence of<br />
its degradation products, which have been based on<br />
ion pair complex <strong>for</strong>mation between MOXL <strong>and</strong><br />
bromocresol purple, bromophenol blue <strong>and</strong> bro-<br />
* Corresponding author: e-mail: bstanisz@amp.edu.pl<br />
389
390 BEATA STANISZ et al.<br />
Table 1. λ maks <strong>and</strong> λ min of UV (A, 1 D, 2 D, 3 D) spectra of MOXL in methanol solution.<br />
Method λ maks [nm] λ min [nm] λ maks [nm]<br />
A 204.4 ñ ñ<br />
1<br />
D 210.7 227.2 237.9<br />
2<br />
D 214.4 ñ ñ<br />
3<br />
D 215.3 219.2 ñ<br />
mothymol blue (9). A stability-indicating RP-HPLC<br />
method has also been developed <strong>for</strong> the determination<br />
<strong>and</strong> kinetic studies of MOXL (10, 11).<br />
Furthemore, another HPLC-Electrospray Ionization<br />
MS method (12) <strong>and</strong> a gas chromatographic-mass,<br />
spectrometric method have been established <strong>for</strong> the<br />
determination of MOXL in the presence of its degradation<br />
product in biological samples (13ñ15).<br />
Recently, also electrochemical differential pulse<br />
voltammetric method based on the enhancement<br />
Figure 1. Chemical structure of moexipril hydrochloride<br />
effect of sodium dodecyl sulfate <strong>for</strong> the determination<br />
of MOXL in tablets has been reported (16).<br />
The above referenced <strong>methods</strong> (HPLC-MS,<br />
GC-MS), despite their high accuracy <strong>and</strong> precision,<br />
are inapplicable <strong>for</strong> stability-indicative assessment<br />
since they are time-consuming <strong>and</strong> require a sophisticated<br />
<strong>and</strong> expensive instrumentation.<br />
For all these reasons, among various <strong>methods</strong><br />
available <strong>for</strong> the determination of the drug, HPLC<br />
<strong>and</strong> UV spectrophotometry seem to be the most<br />
appropriate <strong>for</strong> a routine analysis of large number of<br />
samples, due to their simplicity, reasonable sensitivity<br />
<strong>and</strong> a significant economical advantage, which is<br />
highly beneficial in terms of kinetic studies (7, 17).<br />
In this context, an additional advantage of UV <strong>derivative</strong><br />
spectrophotometry over HPLC is a short time<br />
of analysis, which enables a great number of measurements<br />
to be taken <strong>for</strong> stability evaluation needs.<br />
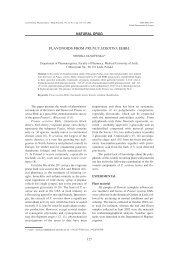
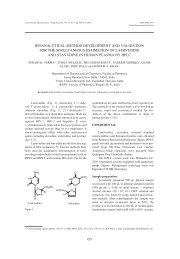
Figure 2. Zero-<strong>order</strong> absorption (A), <strong>first</strong>- (B), second- (C) <strong>and</strong> third-<strong>derivative</strong> (D) absorption spectra of MOXL in a range 200ñ260 nm<br />
(obtained using 1 cm quartz cell)
First <strong>order</strong> <strong>derivative</strong> <strong>spectrophotometric</strong> <strong>and</strong> HPLC <strong>methods</strong>... 391<br />
This is why visible <strong>spectrophotometric</strong> <strong>methods</strong> are<br />
the instrumental <strong>methods</strong> of choice that are commonly<br />
used in industrial laboratories. In the available<br />
literature, however, there is a lack of in<strong>for</strong>mation<br />
regarding the use of UV spectrophotometry <strong>for</strong><br />
kinetic studies of MOXL in solid state.<br />
There<strong>for</strong>e, the main objective of this study was<br />
to develop <strong>and</strong> validate a new, uncomplicated, fast,<br />
inexpensive, sensitive <strong>and</strong> accurate UV <strong>spectrophotometric</strong><br />
method, which could be applied <strong>for</strong> a stability<br />
analysis of MOXL in pure state <strong>and</strong> in pharmaceutical<br />
dosage <strong>for</strong>ms.<br />
Since MOXL molecule contains an uncharacteristic<br />
phenyl chromophore <strong>and</strong> a direct <strong>spectrophotometric</strong><br />
assay is susceptible to interference<br />
from <strong>for</strong>mulation excipients <strong>and</strong> chemical reagents,<br />
<strong>for</strong> its <strong>spectrophotometric</strong> assay the differentiation<br />
of a primary spectrum is essential. This results in<br />
sharpening, shift <strong>and</strong> separation of overlaping<br />
absorption peaks which are unclear in the primary<br />
Table 2. Validation parameters of HPLC <strong>and</strong> <strong>first</strong> <strong>order</strong> <strong>derivative</strong> <strong>spectrophotometric</strong> <strong>methods</strong>.<br />
Spectrophotometric<br />
Parameters HPLC (reference method<br />
method)<br />
First <strong>order</strong> <strong>derivative</strong><br />
Range [%] 0.002ñ0.040 0.00012ñ0.00120<br />
LOD [%] 0.001 0.00004<br />
LOQ [%] 0.02 0.00010<br />
Regression equation<br />
y = ax + b<br />
a ± ∆a 52.14 ± 2.54 12375 ± 518<br />
s a 1.03 224<br />
b ± ∆b 0.0573 ± 0.064 1 0.304 ± 0.122 2<br />
s b 0.0262 0.529<br />
Regression equation<br />
y = ax<br />
a ± ∆a 54.16 ± 2.17 12734 ± 496<br />
s a 0.961 219<br />
r 0.998 0.999<br />
Precision RSD [%]<br />
Intra-day 3 0.94; 0.95; 1.05 1.01; 1.12; 1.29<br />
Inter-day 4 0.76 1.16<br />
Accuracy, recovery Amount found x ± ∆x (%); RSD (%)<br />
model mixture I 98.65 ± 0.71; 98.85 ± 0.68;<br />
RSD = 0.888 RSD = 0.828<br />
model mixture II 99.72 ± 0.94; 99.62 ± 1.04;<br />
RSD = 1.02 RSD = 1.24<br />
model mixture III 99.93 ± 0.39; 99.83 ± 0.59;<br />
RSD = 0.561 RSD = 0.712<br />
Cardiotensin 7.5 analysis [mg] (label claim 7.5 mg MOXL)<br />
Amount found mg<br />
x ± ∆x [mg] 7.551 ± 0.06 7.560 ± 0.05<br />
SD 0.084 0.069<br />
RSD (%) 1.12 0.915<br />
Statistical analysis of the results obtained by means of <strong>first</strong> <strong>derivative</strong><br />
UV spectrophotometry <strong>and</strong> HPLC (reference method)<br />
1<br />
D ↔ HPLC 1.491 < F α,f 0.128 < t α,f<br />
Theoretical F-value (ν = 7, 7) <strong>and</strong> t-value (ν = 14) at 95% confidence<br />
level are 3.79 <strong>and</strong> 2.145, respectively<br />
1<br />
intercept b statistically insignificant (Student t-test, a = 0.05); 2 intercept b statistically significant (Student t-test, a = 0.05); 3 concentrations<br />
of MOXL 0.00012, 0.0006, 0.0012% <strong>for</strong> <strong>spectrophotometric</strong> <strong>methods</strong> <strong>and</strong> <strong>for</strong> HPLC method 0.004, 0.016, 0.04%; 4 concentrations<br />
of MOXL 0.0006% <strong>for</strong> <strong>spectrophotometric</strong> <strong>methods</strong> <strong>and</strong> <strong>for</strong> HPLC method 0.016%. S a ñ st<strong>and</strong>ard deviation of the calibration line; S b ñ<br />
st<strong>and</strong>ard deviation of the intercept b
392 BEATA STANISZ et al.<br />
spectrum. As a result, <strong>derivative</strong> UV spectrophotometry<br />
represents a more sensitive <strong>and</strong> selective<br />
tool in comparison with direct UV absorption measurements.<br />
EXPERIMENTAL<br />
Material, reagents <strong>and</strong> apparatus<br />
Moexipril hydrochloride was supplied by<br />
Schwarz Pharma AG (batch: 28057), each tablet<br />
contained 7.5 mg equivalent of moexipril<br />
hydrochloride (Cardiotensin 7.5).<br />
Methanol <strong>and</strong> acetonitrile were of HPLC grade<br />
(Merck KGaA, Darmstadt, Germany). Potassium<br />
phosphate monobasic was purchased from POCh<br />
S.A., Gliwice, Pol<strong>and</strong>. All other chemicals were of<br />
analytical reagent grade. Water used was freshly<br />
bidistilled.<br />
Spectrophotometric measurements were per<strong>for</strong>med<br />
on a Perkin-Elmer Lambda-6 spectrophotometer<br />
equipped with UV WinLab Version 2.70.01<br />
software. The UV spectra of reference <strong>and</strong> sample<br />
solutions were recorded in 1 cm quartz cells at a<br />
scan speed of 240 nm/min, response time 0.5 s <strong>and</strong><br />
fixed slit width of 3 nm. The concentrations of<br />
MOXL in its solutions in methanol were determined<br />
within wavelength range of 210ñ400 nm.<br />
For HPLC assay a Shimadzu liquid chromatograph<br />
equipped in: Rheodyne 7125 injector with a<br />
fixed loop of 25 µL capability, UV-VIS SPD-6AV<br />
detector, LC-6A pump <strong>and</strong> C-R6A chromatopac<br />
integrator was used.<br />
High per<strong>for</strong>mance liquid chromatography was<br />
per<strong>for</strong>med on a RP-Hypersil MOS 100 C8 (size 10<br />
µm, 250 mm × 4 mm I.D., Merck) column. The<br />
detector wavelength was set at 210 nm <strong>and</strong> mobile<br />
phase was pumped isocratically at a flow rate of 1.1<br />
mL/min. The injection volume was 20 µL. All determinations<br />
were per<strong>for</strong>med at ambient temperature.<br />
Preparation of st<strong>and</strong>ard solutions<br />
Spectrophotometric method: a st<strong>and</strong>ard solution<br />
(0.0012%) of MOXL was prepared by dissolving<br />
an appropriate amount of MOXL in methanol.<br />
HPLC method: a st<strong>and</strong>ard solution (0.04%) of<br />
MOXL was prepared by dissolving an appropriate<br />
amount of MOXL in methanol.<br />
Stored at 6 O C in the dark, st<strong>and</strong>ard solutions<br />
were stable during the period of study.<br />
Analysis of tablets<br />
Twenty tablets (Cardiotensin 7.5) were accurately<br />
weighed <strong>and</strong> powdered in a mortar. An amount<br />
equivalent to one tablet (7.5 mg of MOXL) was<br />
weighed <strong>and</strong> put with addition of 25.0 mL of methanol<br />
into 50 mL volumetric flask. The prepared mixture<br />
was sonicated <strong>for</strong> 15 min <strong>and</strong> filtered (solution A).<br />
Spectrophotometric method: 1.0 mL of solution<br />
A was diluted to 25.0 mL with methanol (solution<br />
A 1 ). The UV spectra D 1 (<strong>first</strong> <strong>order</strong> <strong>derivative</strong><br />
spectra) were recorded against methanol.<br />
HPLC method (reference method): mixture of<br />
1.0 mL of the solution A <strong>and</strong> 1.0 mL of internal<br />
st<strong>and</strong>ard (I.S.) ñ xylomethazoline hydrochloride<br />
(solution R) was analyzed by HPLC. Samples (20<br />
µL) to be analyzed were injected into the HPLC column<br />
<strong>and</strong> the emerging signals were recorded.<br />
Preparation of model mixtures <strong>for</strong> evaluation of<br />
<strong>methods</strong>í accuracy<br />
Model mixtures were prepared using<br />
Cardiotensin 7.5 tablets.<br />
Ten tablets of Cardiotensin 7.5 were grounded<br />
in a mortar with addition of: 25 mg of MOXL<br />
(Model mixture I), 50 mg of MOXL (Model mixture<br />
II) <strong>and</strong> 75 mg of MOXL (Model mixture III).<br />
Each mixture was grounded with a h<strong>and</strong> pistle<br />
<strong>for</strong> 20 min. The recovery was defined as percentage<br />
of the determined concentration of the constituent<br />
under examination with respect to the weighed<br />
amount.<br />
Preparation of mobile phase<br />
The mobile phase used in HPLC method was<br />
aqueous phosphate buffer at pH 2.0 (0.001 mol/L)<br />
<strong>and</strong> acetonitrile (1:1, v/v). The preparation of the<br />
<strong>for</strong>mer included: the dissolution of 0.0681 g of<br />
KH 2 PO 4 (M = 136.09 g/mol) in 400 mL of water in<br />
500 mL volumetric flask, the adjustment to the<br />
desired pH value using 80% orthophosphoric acid<br />
<strong>and</strong> final filling up the volume with water. The prepared<br />
mobile phase was filtered <strong>and</strong> degassed prior<br />
to use.<br />
Procedure <strong>for</strong> MOXL kinetic study<br />
Exactly weighed amounts of MOXL (0.0100 g)<br />
in opened, 5 mL glass vials were used <strong>for</strong> the determination<br />
of stability in the presence of relative<br />
humidity RH = 76.4%. The samples were stored in<br />
dessicator in an automatically controlled heat chamber<br />
at 363 K. After fixed time intervals, the samples<br />
of the investigated material were removed from the<br />
heat chamber, quantitatively transferred into 25 mL<br />
measuring flasks <strong>and</strong> dissolved up to volume with<br />
methanol (solution S).<br />
Spectrophotometric method: 0.5 mL of the<br />
solution S was diluted to 25.0 mL with methanol.<br />
UV spectra D 1 were recorded against methanol.
First <strong>order</strong> <strong>derivative</strong> <strong>spectrophotometric</strong> <strong>and</strong> HPLC <strong>methods</strong>... 393<br />
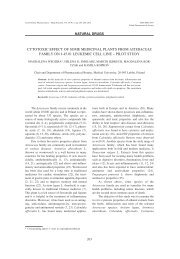
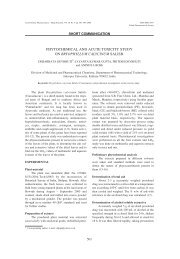
Figure 3. First-<strong>derivative</strong> absorption spectra <strong>for</strong> pure MOXL in a 0.00078% methanolic solution <strong>and</strong> <strong>for</strong> a methanolic extract from MOXL<br />
tablets (MOXL concentration of 0.00078%)<br />
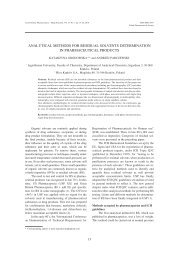
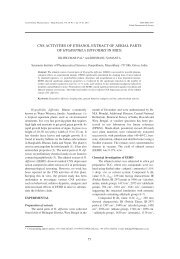
Figure 4. First-<strong>derivative</strong> absorption spectra <strong>for</strong> the MOXL degradation in a solid state (A), <strong>and</strong> a semi-logarythmic plot of <strong>first</strong>-<strong>derivative</strong><br />
versus time <strong>for</strong> the degradation reaction in a solid state (B)<br />
HPLC method (reference method): 1.0 mL of<br />
the solution S was mixed with 1.0 mL of the internal<br />
st<strong>and</strong>ard solution. The obtained mixture was analyzed<br />
by HPLC method. The chromatograms were<br />
interpreted using the following expression: P i /P I.S. =<br />
f(t), where P i st<strong>and</strong>s <strong>for</strong> the area of MOXL signal,<br />
<strong>and</strong> P I.S .- represents the area of I.S. (xylomethazoline<br />
hydrochloride).<br />
RESULTS AND DISCUSSION<br />
Spectrophotometric analysis<br />
The <strong>first</strong> stage of this study included the selection<br />
of an analytical wavelength. For this, primary<br />
(A), <strong>first</strong> (D 1 ), second (D 2 ) <strong>and</strong> third (D 3 ) <strong>derivative</strong><br />
absorption spectra were recorded in 1 cm quartz<br />
cells over a wavelength range of 200ñ300 nm (Table<br />
1, Fig. 2). All the spectra represented a smooth line,<br />
however, only D 1 spectrum was characterized by a<br />
satisfactory analytical wavelength with the maximum<br />
of the absorption at λ max = 238 nm. Absorption<br />
maxima in A, D 2 <strong>and</strong> D 3 spectra were below 220 nm,<br />
which was the reason <strong>for</strong> their rejection since λ max <<br />
220 nm is inapplicable <strong>for</strong> a qualitative pharmaceutical<br />
analysis. Then, the validation process of the<br />
selected D 1 UV <strong>spectrophotometric</strong> method (λ max =<br />
238) was per<strong>for</strong>med <strong>and</strong> sensitivity, linearity, precision<br />
<strong>and</strong> accuracy were evaluated. The equations of
394 BEATA STANISZ et al.<br />
Figure 5. Stability-indicative assay of MOXL by HPLC. Chromatograms obtained <strong>for</strong> MOXL in methanol in t = 0 (A), <strong>and</strong> after <strong>for</strong>ced<br />
degradation test (t = 8 h, RH = 76.4%, T = 363 K) (B) <strong>and</strong> a semi-logarythmic plot of P I /P IS versus time <strong>for</strong> a degradation reaction in a<br />
solid state (C).<br />
the calibration curves were obtained from a linear<br />
regression analysis of the <strong>derivative</strong> amplitudes versus<br />
corresponding drug concentrations. The linearity<br />
of the calibration graph in a range of<br />
0.00012ñ0.00120% was validated by the high value<br />
of correlation coefficient <strong>and</strong> intercept value, which<br />
was statistically insignificant (Table 2). The regression<br />
equation was calculated as Y = aC + b, where<br />
ìCî st<strong>and</strong>s <strong>for</strong> MOXL concentrations <strong>and</strong> the value<br />
of the intercept ìbî is not statistically different from<br />
zero.<br />
In <strong>order</strong> to assess the accuracy of the investigated<br />
method, the recovery study was conducted by<br />
analyzing the synthetic model mixtures of MOXL in<br />
three different ratios according to the procedure<br />
described above. The results are presented in Table<br />
2. High (ca. 100.0%) recovery <strong>and</strong> low st<strong>and</strong>ard<br />
deviation was observed <strong>for</strong> <strong>first</strong> <strong>derivative</strong> UV spectroscopic<br />
method.<br />
The precision of the proposed method was<br />
evaluated by replicate determination of eight samples<br />
at three different concentrations: low<br />
(0.00012%), medium (0.0006%) <strong>and</strong> high<br />
(0.0012%) (Table 2). To assess the repeatability<br />
(intra-day), ten samples were determined <strong>for</strong> MOXL<br />
concentration of 0.0006%. CV(%) value was < 1.5%<br />
indicating a good precision of this measurement<br />
(Table 2).<br />
The validated <strong>first</strong> <strong>derivative</strong> UV <strong>spectrophotometric</strong><br />
method was subsequently evaluated <strong>for</strong> its<br />
utility <strong>for</strong> analysis of MOXL in tablets (Fig. 3). The<br />
absorption spectrum of Cardiotensin 7.5 mg tablets<br />
methanolic extract was recorded <strong>and</strong> compared with<br />
the pure MOXL absorption spectrum (Fig. 3). No<br />
spectral interferences were observed between excipients<br />
used <strong>for</strong> the tabletsí <strong>for</strong>mulation <strong>and</strong> the active<br />
substance, which evidences the methodís applicability<br />
<strong>for</strong> the determination of MOXL in tablets.<br />
Additionally, the results of the determination<br />
of MOXL in tablets obtained by means of the proposed<br />
method were statistically compared with the<br />
results obtained by means of the reference ñ HPLC<br />
method using Student t- <strong>and</strong> -Snedecor F- tests<br />
(Table 2). It was evidenced that there is no significant<br />
difference between the two <strong>methods</strong> with<br />
respect to mean values <strong>and</strong> st<strong>and</strong>ard deviations indicating<br />
that <strong>first</strong> <strong>derivative</strong> UV <strong>spectrophotometric</strong><br />
method is equally precise <strong>and</strong> accurate as HPLC<br />
method <strong>and</strong> can be recommended <strong>for</strong> routine analyses<br />
of MOXL in tablets.<br />
The proposed method was finally tested as a<br />
stability-indicative assay <strong>for</strong> MOXL in solid state<br />
according to the above referenced procedure. It was<br />
observed that the UV spectra of MOXL methanol<br />
solutions subjected to the kinetic studies (over conditions<br />
described in Procedure <strong>for</strong> MOXL kinetic<br />
study) do not differ from those not subjected to<br />
decomposition study (Fig. 4). Changes in MOXL<br />
concentration during time t were observed only in<br />
HPLC method. The results obtained by means of<br />
HPLC evidenced that the MOXL decomposition proceeds<br />
according to the <strong>first</strong> <strong>order</strong> reaction model <strong>and</strong><br />
the decomposition rate constant is k ± Dk = (3.67 ±<br />
0.13) ◊ 10 -5 s -1 . The results are presented in Fig. 5.<br />
CONCLUSION<br />
This is the <strong>first</strong> study investigating the utility of<br />
<strong>first</strong> <strong>derivative</strong> UV <strong>spectrophotometric</strong> method as a<br />
stability-indicative assay <strong>for</strong> MOXL stability evaluation.<br />
The proposed method is accurate (the recovery<br />
about 100%), linear (r = 0.999), precise (SD
First <strong>order</strong> <strong>derivative</strong> <strong>spectrophotometric</strong> <strong>and</strong> HPLC <strong>methods</strong>... 395<br />
1.5%), selective with reference to excipients used in<br />
the pharmaceutical <strong>for</strong>mulation (Fig. 3), sensitive,<br />
rapid (only few minutes are required <strong>for</strong> the analysis),<br />
economical <strong>and</strong> can be used alternatively with<br />
HPLC reference method <strong>for</strong> the routine analysis <strong>and</strong><br />
quality control of MOXL in its solid dosage <strong>for</strong>mulations.<br />
However, the MOXL decomposition in solid<br />
state was observed only in HPLC method while the<br />
<strong>first</strong> <strong>derivative</strong> UV <strong>spectrophotometric</strong> method<br />
turned out to be inappropriate <strong>for</strong> kinetic studies as<br />
a stability-indicative assay (Fig. 4) due to its low<br />
selectivity of MOXL decomposition products.<br />
REFERENCES<br />
1. äpinar J., VÌtovec J.: Int. J. Cardiolog. 100, 199<br />
(2005).<br />
2. Wong J., Patel A.R., Kowey R.P.: Int. J.<br />
Cardiol. 47, 116 (2004).<br />
3. Zajπc M., Pawe≥czyk E., JeliÒska A.: Chemistry<br />
of drugs (Polish), p. 243, Medical Academy,<br />
PoznaÒ 2006.<br />
4. Janiec W., KrupiÒska J.: Pharmacodynamics<br />
(Polish), p. 305, Wydawnictwo Lekarskie<br />
PZWL, Warszawa 2002.<br />
5. Wielosz M.: Clinical Pharmacology (Polish), p.<br />
271-291, Wydawnictwo Czelej, Lublin 2001.<br />
6. Validation of Analytical Procedures: Text <strong>and</strong><br />
Methodology, CMP/ICH/381/95, International<br />
Conference on Harmonization, Geneva,<br />
Switzerl<strong>and</strong>.<br />
7. Zajπc M., JeliÒska A.: Evaluation of quality of<br />
medical substances <strong>and</strong> products (Polish) p. 23,<br />
Medical University, PoznaÒ 2010<br />
8. Erturk S.M., Cetin S., Atmaca S.: J. Pharm.<br />
Biomed. Anal. 33, 505 (2003).<br />
9. Elshanawane A.A., Mostafa M.S., Elgawish<br />
S.M.: Saudi Pharm. J. 16, 222 (2008).<br />
10. Elshanawane A.A., Mostafa M.S., Mohamed S.,<br />
Elgawish S.M.: Chromatographia 67, 567<br />
(2008).<br />
11. Stanisz B.: Acta Pol. Pharm. Drug Res. 61, 91<br />
(2004).<br />
12. KÛti J., H·da V., Petroianu G., Hasan M.Y.,<br />
Tekes K., Sz¸cs Z., Kal·sz H.: J. Chromatogr.<br />
Sci. 44, 214 (2006).<br />
13. Hammes W., Hammes B., B¸chsler U., Paar F.,<br />
Bˆkens H.: J. Chromatogr. B 670, 81 (1995).<br />
14. Kal·sz H., Petroianu G., Tekes K., Klebovich I.,<br />
Lud·nyi K., Guly·s Z.S.: Med. Chem. 3, 101<br />
(2007).<br />
15. Rudzki J.P., Buú K., KsyciÒska H., KobyliÒska<br />
K.: J. Pharm. Biomed. Anal., 44, 356 (2007).<br />
16. Atria K.A.: Talanta 81, 25 (2010).<br />
17. Pawlaczyk J., Zajπc M.: Validation of <strong>methods</strong><br />
in analytical chemistry (Polish), p. 7. Medical<br />
Academy, PoznaÒ 2005.<br />
Received: 6. 05. 2011