bioanalytical method development and validation for the ...
bioanalytical method development and validation for the ...
bioanalytical method development and validation for the ...

Create successful ePaper yourself
Turn your PDF publications into a flip-book with our unique Google optimized e-Paper software.
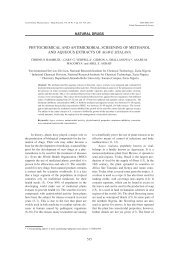
Acta Poloniae Pharmaceutica ñ Drug Research, Vol. 67 No. 4 pp. 429ñ437, 2010 ISSN 0001-6837<br />
Polish Pharmaceutical Society<br />
BIOANALYTICAL METHOD DEVELOPMENT AND VALIDATION<br />
FOR THE SIMULTANEOUS ESTIMATION OF LAMIVUDINE<br />
AND STAVUDINE IN HUMAN PLASMA BY HPLC<br />
SURAJPAL VERMA 1 *, POOJA MULLICK 1 , MD. SLEEM BHATT 2 , NADEEM SIDDIQUI 1 , OZAIR<br />
ALAM 1 , INDU BALA 3 <strong>and</strong> SUROOR A. KHAN 1<br />
1<br />
Department of Pharmaceutical Chemistry, Faculty of Pharmacy,<br />
Jamia Hamdard, New Delhi-110062, India<br />
2<br />
Fortis Clinical Research Ltd., Faridabad, Haryana, India<br />
3<br />
RGPV, Faculty of Pharmacy, Bhopal, M. P., India<br />
Keywords: emtricitabine, lamivudine, liquid-liquid extraction, refrigerated centrifugation, stavudine<br />
Lamivudine (Fig. 1), chemically 2í,3í-dideoxy-3í-thiacytidine,<br />
is a pyrimidine analogue,<br />
whereas stavudine (Fig. 1), 2í,3í-didehydro-3ídeoxythymidine,<br />
is a thymidine analogue. Both are<br />
reverse transcriptase inhibitors reported to be active<br />
against HIV-1, HIV-2 <strong>and</strong> hepatitis B virus.<br />
(ñ) Enantiomer of lamivudine has less cytotoxic <strong>and</strong><br />
greater antiviral activity than its (+) enantiomer. It<br />
shows synergistic effect with o<strong>the</strong>r antiretroviral<br />
agents including stavudine, zidovudine <strong>and</strong> nevirapine<br />
(1, 2).<br />
Lamivudine <strong>and</strong> stavudine are <strong>the</strong> first line regimens<br />
in HIV treatment (3). Various <strong>method</strong>s have<br />
been used <strong>for</strong> quantitative determination of <strong>the</strong>se<br />
two drugs individually in <strong>the</strong> human plasma, such as<br />
HPLC <strong>and</strong> HPLC with t<strong>and</strong>em MS (4ñ6), but <strong>for</strong> <strong>the</strong><br />
Figure 1.<br />
combination no such <strong>method</strong> has been reported yet.<br />
The rationale of <strong>the</strong> present study was to develop an<br />
accurate, rapid <strong>and</strong> economical <strong>method</strong> <strong>for</strong> bioanalysis<br />
of <strong>the</strong> above combination of drugs in<br />
human plasma (7, 8).<br />
EXPERIMENTAL<br />
Lamivudine, stavudine, internal st<strong>and</strong>ard<br />
(emtricitabine) <strong>and</strong> biological matrix were obtained<br />
from Ranbaxy Research Laboratories (India). HPLC<br />
grade solvents (acetonitrile <strong>and</strong> methanol) were procured<br />
from SD Fine Chemicals Ltd. (India).<br />
Analytical grade chemicals were procured from<br />
Qualigens Fine Chemicals (India).<br />
The HPLC system used was Shimadzu LC-<br />
2010 (integrated system) equipped with quaternary<br />
pump (Japan). Refrigerated centrifuge used was<br />
Eppendorf 5810R (Germany).<br />
Sample preparation:<br />
Accurately measured 500 µL plasma sample<br />
was mixed with 100 µL of internal st<strong>and</strong>ard solution<br />
(500 µg mL -1 ), 4 mL of ethyl acetate ñ isopropyl<br />
alcohol mixture (90 : 10, v/v), OPA solution <strong>and</strong><br />
extraction was made by using liquid-liquid extraction<br />
<strong>method</strong>. After centrifugation, <strong>the</strong> sample was<br />
dried in nitrogen evaporator dryer at 50 O C, <strong>the</strong><br />
residue was reconstituted in 400 µL of mobile phase<br />
(ammonium acetate buffer pH 6.00 ± 0.05: acetoni-<br />
* Corresponding author: phone: +00-91-11-2605 9688; Extn.: 5612, fax: +00-91-11-2605 9663, e-mail: poojamullick7@rediffmail.com<br />
429
430 SURAJPAL VERMA et al.<br />
trile 93:7, v/v) <strong>and</strong> 25 µL was injected onto HPLC<br />
column <strong>for</strong> analysis.<br />
Chromatographic conditions<br />
HPLC analysis was per<strong>for</strong>med with Shimadzu<br />
HPLC system equipped with LC-10ATvp pump,<br />
SCL 10Avp system controller, SIL 10ADvp auto<br />
injector, CTO 10Avp column oven <strong>and</strong> SPD 10Avp<br />
UV detector. The chromatographic separation was<br />
per<strong>for</strong>med using a Hypersil BDS (250 mm ◊ 4.6<br />
mm), 5 µm (Thermo Technologies, USA). The<br />
mobile phase consisting of a mixture of ammonium<br />
acetate buffer (pH 6.0 ± 0.2) <strong>and</strong> methanol in <strong>the</strong><br />
ratio of 93 : 7 (v/v) with <strong>the</strong> flow rate of 1.0 mL min -1<br />
was employed. The detector wavelength was set at<br />
270 nm. The injection volume was 25 µL while column<br />
was maintained at 40 O C.<br />
Preparation of st<strong>and</strong>ard calibration curve<br />
Preparation of st<strong>and</strong>ard stock solution of lamivudine<br />
<strong>and</strong> stavudine<br />
Accurately weighed 10 mg each of lamivudine<br />
<strong>and</strong> stavudine was transferred into a 10 mL volumetric<br />
flask, dissolved in sufficient volume of<br />
ethanol <strong>and</strong> <strong>the</strong> final volume was made up to produce<br />
1 mg mL -1 solution. The final concentrations of<br />
both drugs were corrected <strong>for</strong> accounting of <strong>the</strong>ir<br />
potency <strong>and</strong> actual amount weighed. The solutions<br />
were stored in a refrigerator below 8 O C <strong>and</strong> used<br />
within 55 days of its preparation. From <strong>the</strong> above<br />
stock solution, different dilutions of both <strong>the</strong> drugs<br />
were made, after this <strong>the</strong> spiking was done by using<br />
plasma <strong>for</strong> calibartion curve (CC) st<strong>and</strong>ards <strong>and</strong><br />
quality control (QC) samples. The concentration<br />
ranges <strong>for</strong> CC were 5.005ñ0.075 µg mL -1 <strong>and</strong><br />
4.577ñ0.068 µg mL -1 <strong>for</strong> lamivudine <strong>and</strong> stavudine,<br />
respectively. The concentration ranges <strong>for</strong> QC samples<br />
were 4.004ñ0.081 µg mL -1 <strong>and</strong> 3.745ñ0.075 µg<br />
mL -1 <strong>for</strong> lamivudine <strong>and</strong> stavudine, respectively.<br />
Method <strong>validation</strong><br />
Preparation of st<strong>and</strong>ard stock solutions<br />
The IS stock solution was prepared in HPLC<br />
grade methanol by weighing accurately 10 mg of<br />
emtricitabine (IS) working st<strong>and</strong>ard <strong>and</strong> transferred<br />
to a 10 mL volumetric flask. It was dissolved in 5<br />
mL of methanol <strong>and</strong> <strong>the</strong> volume was made up to 10<br />
mL so that a solution of 1 mg/mL concentration was<br />
obtained. This solution was stored below 10 O C in a<br />
refrigerator. The IS stock dilution was prepared<br />
using HPLC grade water as diluents, prior to sample<br />
preparation with final concentration of 50 µg mL -1 .<br />
The lamivudine (analyte) working st<strong>and</strong>ard<br />
stock solution was made by weighing accurately<br />
10.011 mg of lamivudine working st<strong>and</strong>ard <strong>and</strong><br />
transferring it to a 10 mL volumetric flask. It was<br />
dissolved in ethanol <strong>and</strong> <strong>the</strong> volume was made up<br />
with <strong>the</strong> same to get a concentration of 1 mg mL -1 .<br />
The stavudine (analyte) working st<strong>and</strong>ard<br />
stock solution was made by weighing accurately<br />
10.455 mg of stavudine working st<strong>and</strong>ard <strong>and</strong> transferring<br />
it to a 10 mL volumetric flask. It was dissolved<br />
in methanol <strong>and</strong> <strong>the</strong> volume was made up<br />
with <strong>the</strong> same to get a concentration of 1 mg mL -1 .<br />
Just prior to spiking, stock dilutions of lamivudine<br />
<strong>and</strong> stavudine were prepared using HPLC grade<br />
methanol/water (50:50, v/v) mixture as diluents with<br />
final concentrations: 228.862, 200.226, 120.135,<br />
60.067, 30.033, 15.016, 7.508, 3.754 <strong>and</strong> 228.862,<br />
183.089, 109.853, 54.926, 27.463, 13.731, 6.865,<br />
3.432 mg mL -1 <strong>for</strong> lamivudine <strong>and</strong> stavudine,<br />
respectively.<br />
Just prior to spiking <strong>for</strong> <strong>the</strong> QC samples, suitable<br />
stock dilutions of <strong>the</strong> analytes in HPLC grade<br />
methanol/water (50:50, v/v) mixture as diluents,<br />
were prepared with final concentrations: 200.226,<br />
120.135, 7.208, 4.051 <strong>and</strong> 187.250, 112.350, 6.741,<br />
3.788 mg mL -1 <strong>for</strong> lamivudine <strong>and</strong> stavudine, respectively.<br />
Spiking of blank human plasma <strong>for</strong> CC st<strong>and</strong>ards<br />
was done by transferring 200 µL of each of <strong>the</strong><br />
dilutions mentioned above into 10 mL volumetric<br />
flasks <strong>and</strong> volume was made up with blank plasma<br />
to achieve <strong>the</strong> concentrations: 5.005, 4.004, 2.402,<br />
1.201, 0.600, 0.300, 0.150, 0.075 <strong>and</strong> 4.577, 3.661,<br />
2.197, 1.098, 0.549, 0.274, 0.137, 0.068 mg mL -1 <strong>for</strong><br />
lamivudine <strong>and</strong> stavudine, respectively.<br />
Plasma was spiked <strong>for</strong> <strong>the</strong> QC samples by<br />
transferring 2 mL each of <strong>the</strong> dilutions mentioned<br />
above, into 100 mL volumetric flasks <strong>and</strong> <strong>the</strong> volume<br />
was made up by plasma to achieve <strong>the</strong> QC<br />
samples of concentrations 4.004, 2.402, 0.144,<br />
0.081 <strong>and</strong> 3.745, 2.247, 0.134, 0.075 mg mL -1 <strong>for</strong><br />
lamivudine <strong>and</strong> stavudine, respectively. Aliquots of<br />
750 µL of each of <strong>the</strong> spiked plasma st<strong>and</strong>ards were<br />
pipetted out into polypropylene tubes <strong>and</strong> stored<br />
below -30 O C until analyzed.<br />
Preparation of reagents<br />
Preparation of buffer was accomplished by<br />
transferring 3.854 g of ammonium acetate in about<br />
1000 mL reagent bottle <strong>and</strong> made up <strong>the</strong> volume to<br />
1 liter with HPLC water adjusting <strong>the</strong> pH to 6 (± 0.2)<br />
with glacial acetic acid. The buffer was filtered<br />
through 0.2 µm filter <strong>and</strong> sonicated <strong>for</strong> 5 min.<br />
Mobile phase was prepared from 930 mL of 50<br />
mM ammonium acetate buffer (pH 6 ± 0.2) <strong>and</strong> 70<br />
mL of HPLC grade methanol mixed well. After
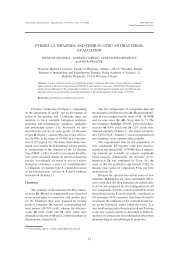
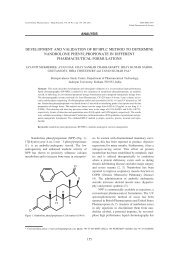
Bioanalytical <strong>method</strong> <strong>development</strong> <strong>and</strong> <strong>validation</strong> <strong>for</strong> <strong>the</strong> simultaneous estimation... 431<br />
Figure 2. Chromatogram of extracted blank plasma sample<br />
Figure 3. Chromatogram of extracted blank plasma with internal st<strong>and</strong>ard<br />
degassing <strong>for</strong> 5 min. <strong>the</strong> mobile phase was used <strong>for</strong><br />
up to 3 days.<br />
Rinsing solution was made from 800 mL of<br />
HPLC grade water <strong>and</strong> 200 mL of HPLC grade<br />
methanol. The solution was used <strong>for</strong> up 5 days.<br />
Validation parameters<br />
System suitability test of <strong>the</strong> HPLC system, to<br />
be used <strong>for</strong> <strong>validation</strong> was done by giving six injections<br />
of aqueous mixture of analytes <strong>and</strong> internal<br />
st<strong>and</strong>ard. The parameters were <strong>the</strong> same as in<br />
<strong>method</strong> <strong>validation</strong>. %CV of areas <strong>and</strong> retention<br />
times were calculated <strong>and</strong> were than 2% <strong>and</strong> less<br />
than 5%, respectively.<br />
The precision of <strong>the</strong> <strong>method</strong> based on withinday<br />
repeatability was determined by replicate<br />
analysis of sets each of high, middle <strong>and</strong> low quality<br />
control samples. The reproducibility (day-to-day<br />
variation) of <strong>the</strong> <strong>method</strong> was validated using similar<br />
six sets of high, middle <strong>and</strong> low quality control<br />
samples on different days. Coefficients of variation<br />
(CVís) were calculated from <strong>the</strong> ratios of st<strong>and</strong>ard<br />
deviation (SD) to <strong>the</strong> mean <strong>and</strong> expressed as percentage.<br />
Accuracy of <strong>the</strong> <strong>method</strong> was determined by<br />
replicate analysis of six sets of samples at high,<br />
middle <strong>and</strong> low quality control concentrations <strong>and</strong><br />
comparing <strong>the</strong> difference between <strong>the</strong> spiked value
432 SURAJPAL VERMA et al.<br />
Figure 4. Chromatogram of mixture of drugs (lamivudine <strong>and</strong> stavudine) <strong>and</strong> internal st<strong>and</strong>ard (emtricitabine)<br />
Figure 5. Chromatogram of extracted st<strong>and</strong>ard (lamivudine 1.20 µg mL -1 <strong>and</strong> stavudine 1.09 µg mL -1 ) sample<br />
Figure 6. Stability data <strong>for</strong> lamivudine , stavudine <strong>and</strong> IS
Bioanalytical <strong>method</strong> <strong>development</strong> <strong>and</strong> <strong>validation</strong> <strong>for</strong> <strong>the</strong> simultaneous estimation... 433<br />
Table 1. Validation results of <strong>the</strong> HPLC <strong>method</strong>.<br />
Validation parameters Lamivudine Stavudine<br />
Linearity range (µg mL -1 ) 0.075ñ5.005 0.0686ñ4.577<br />
Minimum quantifiable (µg mL -1 ) 0.0750 0.686<br />
Within batch accuracy (%) 96.9ñ103.3 92.4ñ103.2<br />
Total accuracy (%) 96.0ñ107.6 99.8ñ106.9<br />
Within batch precision (%CV) 1.3ñ8.7 1.4ñ8.9<br />
Total precision (%CV) 7.8ñ11.8 4.0ñ12.8<br />
% Recovery (Mean)<br />
● Analyte 45.2 61.0<br />
● IS 58.2<br />
% Stability<br />
● Stock stability 98.9 99.0<br />
● Freeze-thaw stability 100.25 88.65<br />
● Bench top stability 102.2 87.45<br />
● In-injector stability 105.05 94.7<br />
● Long-term stability 102.95 94.4<br />
Table 2. Recovery of drugs from human plasma.<br />
% Recovery<br />
Lamivudine Stavudine IS<br />
Mean 45.2 61.0 58.9<br />
SD 1.71 5.05 2.01<br />
%CV 3.8 8.3 11.9<br />
Table 3. Blank plasma screening (Selectivity).<br />
LOQ area<br />
Lamivudine Stavudine IS<br />
Mean 2604.5 4186.5 279266.8<br />
SD 309.62 338.22 8473.04<br />
%CV 11.9 8.1 3.0<br />
Figure 7. Calibration curve <strong>for</strong> lamivudine<br />
Table 4. Stability of stock solution stored between 1ñ10 O C.<br />
Stock solution stability<br />
Lamivudine Stavudine IS<br />
Mean 235060.2 287301.5 190725.2<br />
SD 1661.87 2030.70 1330.13<br />
% CV 0.7 0.7 0.7<br />
%stability 98.9 99.0 99.3<br />
(nominal) <strong>and</strong> that actually found. Accuracy was<br />
expressed as % of nominal concentration.<br />
The analytical recovery of analytes (lamivudine<br />
<strong>and</strong> stavudine) <strong>and</strong> <strong>the</strong> internal st<strong>and</strong>ard<br />
(emtricitabine) was estimated by comparing <strong>the</strong><br />
Figure 8. Calibration curve <strong>for</strong> stavudine
434 SURAJPAL VERMA et al.<br />
Table 5. Freeze-thaw stability after three cycles.<br />
Freeze-thaw stability<br />
LQC conc. (ng/mL)<br />
HQC conc. (ng/mL)<br />
Lamivudine Stavudine Lamivudine Stavudine<br />
Mean 140.7 121.7 4119.4 3256.6<br />
SD 4.7 5.9 141.2 129.2<br />
%CV 3.3 4.8 3.4 4.0<br />
Nominal conc. 144.2 134.8 4004.5 3745.0<br />
% nominal 97.6 90.3 102.9 87.0<br />
Table 6. In-injector stability.<br />
In-injector stability (96 h)<br />
LQC conc. (ng/mL)<br />
HQC conc. (ng/mL)<br />
Lamivudine Stavudine Lamivudine Stavudine<br />
Mean 149.3 123.6 4267.9 3657.4<br />
SD 12.5 11.3 63.6 95.7<br />
%CV 8.3 9.1 1.49 2.62<br />
Nominal conc. 144.2 134.8 4004.5 3745.0<br />
% nominal 103.5 91.7 106.6 97.7<br />
Table 7: Bench top stability.<br />
Bench top stability (6 h)<br />
LQC conc. (ng/mL)<br />
HQC conc. (ng/mL)<br />
Lamivudine Stavudine Lamivudine Stavudine<br />
Mean 145.5 120.4 4145.8 3207.4<br />
SD 5.02 2.01 132.6 111.4<br />
%CV 3.4 1.67 3.2 3.47<br />
Nominal conc. 144.2 134.8 4004.5 3745.0<br />
% nominal 100.9 89.3 103.5 85.6<br />
Table 8. Long-term stability.<br />
Long-term stability (50 days)<br />
LQC conc. (ng/mL)<br />
HQC conc. (ng/mL)<br />
Lamivudine Stavudine Lamivudine Stavudine<br />
Mean 145.1 120.8 4217.4 3714.8<br />
SD 10.59 13.44 74.34 133.16<br />
%CV 7.3 11.1 1.76 3.58<br />
Nominal conc. 144.2 134.8 4004.5 3745.0<br />
% nominal 100.6 89.6 105.3 99.2
Bioanalytical <strong>method</strong> <strong>development</strong> <strong>and</strong> <strong>validation</strong> <strong>for</strong> <strong>the</strong> simultaneous estimation... 435<br />
Table 9. Linear regression data <strong>for</strong> <strong>the</strong> calibration curves (n = 8), concentration ratio vs. area ratio (lamivudine).<br />
Parameter<br />
Values<br />
Correlation coefficient (r) 0.9999<br />
r squared 0.9998<br />
SD of residual from line 0.003134<br />
Slope 0.1065<br />
Confidence limit of slope a<br />
0.1049ñ0.1080<br />
SE of slope 0.0006244<br />
Intercept (y) ñ0.001690<br />
Confidence limit of intercept a<br />
ñ0.005463ñ0.002082<br />
SE of intercept 0.001542<br />
a<br />
95% confidence limit<br />
Table 10. Linear regression data <strong>for</strong> <strong>the</strong> calibration curves (n = 8), concentration ratio vs. area ratio (stavudine).<br />
Parameter<br />
Values<br />
Correlation coefficient (r) 0.9999<br />
r squared 0.9998<br />
SD of residual from line 0.003888<br />
Slope 0.1528<br />
Confidence limit of slope a<br />
0.1507ñ0.1549<br />
SE of slope 0.0008473<br />
Intercept (y) ñ0.002513<br />
Confidence limit of intercept a<br />
ñ0.002168ñ0.007194<br />
SE of intercept 0.002513<br />
a<br />
95% confidence limit<br />
Table 11. Ruggedness data.<br />
Ruggedness<br />
LOQC conc. (ng/mL) LQC conc. MQC conc. (ng/mL) HQC conc. (ng/mL)<br />
Lam. Stav. Lam. Stav. Lam. Stav. Lam. Stav.<br />
Mean 86.1 74.5 157.1 138.9 2515.2 2088.7 4032.3 3317.6<br />
SD 5.8 7.4 7.9 3.0 55.4 31.4 140.5 152.6<br />
%CV 6.7 9.9 5.0 2.1 2.2 1.5 3.5 4.6<br />
Nominal conc. 81.00 75.8 144.2 134.8 2402.7 2247 4004.5 3745<br />
% nominal 106.3 98.3 108.9 103.1 104.7 93.0 100.7 88.6<br />
Lam. = lamivudine, Stav. = stavudine<br />
peak areas of extracted samples at three concentrations,<br />
with <strong>the</strong> response of extracted blank samples<br />
to which analytes <strong>and</strong> <strong>the</strong> internal st<strong>and</strong>ard has been<br />
added at <strong>the</strong> same nominal concentration.<br />
The selectivity of <strong>the</strong> <strong>method</strong> was verified by<br />
checking <strong>the</strong> interference of endogenous compounds<br />
in human plasma at <strong>the</strong> RT of <strong>the</strong> analytes <strong>and</strong> IS by<br />
evaluating eight lots of plasma.<br />
Stability was evaluated by determining five<br />
parameters. The stock solution stability was evaluated<br />
by injecting six replicate samples of old stock<br />
solution <strong>and</strong> comparing <strong>the</strong> response with freshly
436 SURAJPAL VERMA et al.<br />
prepared stock solution. The stock solution stability<br />
of <strong>the</strong> internal st<strong>and</strong>ard stock was evaluated by <strong>the</strong><br />
same process.<br />
The bench top stability was determined at<br />
lower <strong>and</strong> higher quality control samples by evaluating<br />
6 replicate samples at each level. The samples<br />
were processed after keeping <strong>the</strong>m at bench<br />
top (room temperature) <strong>for</strong> about 6 h <strong>and</strong> <strong>the</strong>n analyzed<br />
against freshly spiked calibration curve st<strong>and</strong>ards.<br />
The freeze-thaw stability in matrix was<br />
assessed by assaying six replicates of QC samples at<br />
low <strong>and</strong> high concentrations previously frozen <strong>and</strong><br />
thawed over three cycles against freshly spiked calibration<br />
st<strong>and</strong>ards. The samples were first frozen at<br />
ñ27 O C <strong>for</strong> at least 40 h followed by unassisted thawing<br />
at room temperature. The samples were again<br />
frozen <strong>for</strong> 24 h under <strong>the</strong> same conditions. This<br />
freeze-thaw cycle was repeated two more times <strong>and</strong><br />
<strong>the</strong> samples were <strong>the</strong>n processed after <strong>the</strong> third cycle<br />
<strong>and</strong> analyzed.<br />
In-injector stability was assessed by extracting<br />
six replicates of QC samples at low <strong>and</strong> high concentration<br />
ant putting <strong>the</strong> processed samples in <strong>the</strong><br />
autosampler. The samples were injected after 96 h<br />
along with freshly spiked calibration st<strong>and</strong>ards.<br />
The long-term stability evaluation was per<strong>for</strong>med<br />
after 50 days of storage period, when six<br />
replicates of <strong>the</strong> stored low <strong>and</strong> high concentration<br />
QC samples were removed from <strong>the</strong> freezer/cold<br />
room <strong>and</strong> allowed to thaw. The samples were<br />
processed <strong>and</strong> analyzed against freshly spiked calibration<br />
st<strong>and</strong>ards.<br />
Dilution integrity was assessed by assaying six<br />
replicates of <strong>the</strong> QC samples spiked with approximately<br />
two times of 90% concentration of ULOQ<br />
<strong>and</strong> diluted by factor of two <strong>and</strong> four prior to extraction.<br />
The samples were processed <strong>and</strong> analyzed<br />
against freshly spiked calibration st<strong>and</strong>ards.<br />
RESULT AND DISCUSSION<br />
Under <strong>the</strong> optimal conditions employed, <strong>the</strong><br />
retention times were 9.8 min, 15.7 min <strong>and</strong> 12.7 min<br />
<strong>for</strong> lamivudine, stavudine <strong>and</strong> emtricitabine (IS),<br />
respectively, with good peak shape <strong>and</strong> resolution.<br />
(Fig. 2ñ5).<br />
The within batch/intrabatch precision of <strong>the</strong><br />
<strong>method</strong> was in <strong>the</strong> range of 1.3 to 8.7 % <strong>and</strong> 1.4 to<br />
8.9 % <strong>for</strong> lamivudine <strong>and</strong> stavudine, respectively.<br />
The between batch/interbatch precision of <strong>the</strong><br />
<strong>method</strong> was in <strong>the</strong> range of 7.8 to 11.8 % <strong>and</strong> 4.0 to<br />
12.8 % <strong>for</strong> lamivudine <strong>and</strong> stavudine, respectively.<br />
The within batch/intrabatch accuracy of <strong>the</strong> <strong>method</strong><br />
was in <strong>the</strong> range of 96.9 to 103.3 % <strong>and</strong> 92.4 to 103.2<br />
% <strong>for</strong> lamivudine <strong>and</strong> stavudine, respectively,<br />
whereas <strong>the</strong> between batch/interbatch accuracy was<br />
in <strong>the</strong> range of 96.0 to 107.6% <strong>and</strong> 99.8 to 106.9%<br />
<strong>for</strong> lamivudine <strong>and</strong> stavudine, respectively (Table 1).<br />
The total recovery was found to be 43.6 to<br />
47.1% (mean recovery = 45.2 %) <strong>for</strong> lamivudine,<br />
55.8 to 65.9 % (mean recovery = 61.0 %) <strong>for</strong> stavudine<br />
<strong>and</strong> that of <strong>the</strong> internal st<strong>and</strong>ard was 58.9 %<br />
(Table 1 <strong>and</strong> 2).<br />
Eight lots of blank plasma were evaluated <strong>and</strong><br />
an interfering peak was observed at <strong>the</strong> RT of <strong>the</strong><br />
drug but <strong>the</strong> response of <strong>the</strong> interfering peak was<br />
very low <strong>and</strong> insignificant, however, <strong>the</strong>re was no<br />
interfering peak at <strong>the</strong> RT of IS. Thus <strong>the</strong> <strong>method</strong><br />
seems to be selective enough <strong>for</strong> <strong>the</strong> simultaneous<br />
determination of lamivudine <strong>and</strong> stavudine <strong>for</strong> pharmacokinetic<br />
purposes (Table 3).<br />
Stability<br />
Stabilities of <strong>the</strong> samples were determined in<br />
various phases of <strong>method</strong>. The stability studies<br />
include stock solution stability, freeze-thaw stability,<br />
in-injector stability, bench-top stability <strong>and</strong> longterm<br />
stability. All <strong>the</strong> above stability studies indicate<br />
that <strong>the</strong> samples in various phases were with in <strong>the</strong><br />
acceptance limits.<br />
The results (Table 4) indicate <strong>the</strong> stability of<br />
<strong>the</strong> stock solutions over a minimum of 50 days period<br />
when stored at or below 10 O C in methanol.<br />
The concentration of <strong>the</strong> freeze-thaw samples<br />
were found to be 90.3 to 97.6 % of <strong>the</strong> nominal concentration<br />
<strong>for</strong> lamivudine <strong>and</strong> 87.0 to 102.9 % <strong>for</strong><br />
stavudine, indicating <strong>the</strong> stability of <strong>the</strong> analytes<br />
over three freeze-thaw cycles (Table 5).<br />
The samples were stable <strong>for</strong> at least 96 hours in<br />
<strong>the</strong> autoinjector (below 10 O C). The back calculated<br />
concentration was found to be 91.7 to 103.5 % of <strong>the</strong><br />
nominal concentration <strong>for</strong> lamivudine <strong>and</strong> 97.7 to<br />
106.6 % <strong>for</strong> stavudine (Table 6).<br />
For <strong>the</strong> bench top stability, <strong>the</strong> back calculated<br />
concentration against freshly spiked calibration<br />
st<strong>and</strong>ards was found to be 89.3 to 100.9% of <strong>the</strong><br />
nominal concentration <strong>for</strong> lamivudine <strong>and</strong> 85.6 to<br />
103.5% <strong>for</strong> stavudine (Table 7).<br />
The concentration of <strong>the</strong> long term-stability<br />
samples ranged between 89.6 to 100.6% <strong>and</strong> 99.2 to<br />
105.3% of <strong>the</strong> nominal value, respectively, <strong>for</strong><br />
lamivudine <strong>and</strong> stavudine. The long term stability<br />
duration was calculated as <strong>the</strong> date of analysis of QC<br />
samples, less <strong>the</strong> date of preparation of <strong>the</strong> stability<br />
QC samples (Table 1 <strong>and</strong> 8 <strong>and</strong> Fig. 6).<br />
The linearity of <strong>the</strong> <strong>method</strong> was determined by<br />
a weighed least square regression analysis of stan-
Bioanalytical <strong>method</strong> <strong>development</strong> <strong>and</strong> <strong>validation</strong> <strong>for</strong> <strong>the</strong> simultaneous estimation... 437<br />
dard plot associated with an eight-point st<strong>and</strong>ard<br />
curve. The calibration curves shows linearity in <strong>the</strong><br />
ranges of 0.075ñ5.005 µg mL -1 <strong>and</strong> 0.068ñ4.577 µg<br />
mL -1 <strong>for</strong> lamivudine <strong>and</strong> stavudine, respectively.<br />
Best fit calibration lines of peak area ratio of <strong>the</strong><br />
drug <strong>and</strong> internal st<strong>and</strong>ard vs. concentration of calibration<br />
st<strong>and</strong>ards were determined by weighed least<br />
square regression analysis with a weighing factor of<br />
1/X 2 . The r 2 were consistently greater than 0.98 during<br />
<strong>the</strong> course of <strong>validation</strong> (Tables 1, 9, 10, Fig. 7<br />
<strong>and</strong> 8).<br />
The ruggedness of <strong>the</strong> extraction procedure<br />
<strong>and</strong> <strong>the</strong> chromatographic <strong>method</strong> was evaluated by<br />
analysis of a batch of four sets of QC samples<br />
(including <strong>the</strong> LOQQC) <strong>and</strong> a set of calibration<br />
st<strong>and</strong>ards using a new column <strong>and</strong> made by a different<br />
analyst. Within batch precision of <strong>the</strong> <strong>method</strong><br />
was in <strong>the</strong> range of 3.5 to 6.7 % <strong>and</strong> 2.2 to 9.9 % <strong>for</strong><br />
lamivudine <strong>and</strong> stavudine, respectively. Within<br />
batch accuracy was in <strong>the</strong> range of 100.7 to 106.3%<br />
<strong>and</strong> 88.6 to 108.9% <strong>for</strong> lamivudine <strong>and</strong> stavudine,<br />
respectively. (Table 11).<br />
For dilution integrity <strong>the</strong> back calculated concentrations<br />
against freshly spiked calibration st<strong>and</strong>ards<br />
were in <strong>the</strong> range of 104.1 to 104.8% of <strong>the</strong><br />
nominal concentration <strong>for</strong> lamivudine <strong>and</strong> 101.0 to<br />
109.7% <strong>for</strong> stavudine.<br />
Acknowledgments<br />
The authors are grateful to Jamia Hamdard,<br />
New Delhi <strong>for</strong> assistance. The authors gratefully<br />
acknowledge Ranbaxy Research Laboratories<br />
(India) <strong>for</strong> providing drugs as gift samples.<br />
REFERENCES<br />
1. Eunice K.K., Cristina H., Eunice A.S., Simone<br />
K.M.E., Valentina P.: Int. J. Pharm. 297, 73<br />
(2005).<br />
2. Gholamreza B., Shahla M., Amir K., Bahareh<br />
M.: J. Chromatogr. B 823, 213 (2005).<br />
3. Yazen A., Ca<strong>the</strong>rine A., Michael G.B.: J.<br />
Chromatogr. B 803, 279 (2004).<br />
4. Venn R.F.: Principles <strong>and</strong> practice of bioanalysis.<br />
Indian reprint 2003, Taylor & Francis,<br />
London 2000.<br />
5. Christain G.D.: Analytical Chemistry, 6th edn.,<br />
J. Wiley <strong>and</strong> Sons, New York 2004.<br />
6. Sarkar M., Kh<strong>and</strong>avilli S., Panchangnula R.: J.<br />
Chromatogr. B 830, 349 (2006).<br />
7. Snyder L. R., Glajch J. L., Kirkl<strong>and</strong> J.J.:<br />
Practical HPLC Method Development. 2nd<br />
edn., J. Wiley <strong>and</strong> Sons, Chichester, New York<br />
1997.<br />
8. Wissen C.P.W.G.M.V., Aarnoutse R.E. <strong>and</strong><br />
Burger D.M.: J. Chromatogr. B 816, 121<br />
(2005).<br />
Received: 22. 10. 2009