- Page 1:
i Evaluation of the Australian Wage
- Page 5 and 6:
v Declaration I hereby declare that
- Page 7 and 8:
in method and assumptions. The orth
- Page 9 and 10:
3.3 Data and variables used for est
- Page 11 and 12:
List of Tables and Figures Figure 1
- Page 13 and 14:
Table A2.0b Univariate Probit of pa
- Page 15 and 16:
xv Abstract The job subsidy Special
- Page 17 and 18:
1 1: Wage subsidy theory and evalua
- Page 19 and 20:
3 programs of providing benefits an
- Page 21 and 22:
5 The empirical methods used for th
- Page 23 and 24:
7 how the outcomes from these metho
- Page 25 and 26:
9 employment effect could be mainly
- Page 27 and 28:
11 Real Wage Employment Figure 1.1:
- Page 29 and 30:
13 are two types of unemployment, s
- Page 31 and 32:
15 Real wages are predetermined whe
- Page 33 and 34:
17 Vella (1998), Heckman, Lalonde a
- Page 35 and 36:
19 Each individual has two potentia
- Page 37 and 38:
21 this case, if there was no data
- Page 39 and 40:
23 correlation for the error of the
- Page 41 and 42:
25 Table 1.3 collects together some
- Page 43 and 44:
27 Table 1.3 Brief overview of rece
- Page 45 and 46:
29 necessarily brief. Then, the evi
- Page 47 and 48:
31 limited applications, such as fo
- Page 49 and 50:
33 who participated. It was conclud
- Page 51 and 52:
35 term unemployed for over 12 of t
- Page 53 and 54:
37 importance of the subsidy second
- Page 55 and 56:
39 differences in characteristics t
- Page 57 and 58:
41 Matching methods are theoretical
- Page 59 and 60:
43 2.2 SYETP implementation As SYET
- Page 61 and 62:
45 In July1978, the subsidy was cal
- Page 63 and 64:
47 In January 1979, variations were
- Page 65 and 66:
49 benefits were paid at a slightly
- Page 67 and 68:
51 2.2.3 SYETP operation Earlier re
- Page 69 and 70:
53 ceiling constraints’ applied t
- Page 71 and 72:
55 Award Conditions for employment
- Page 73 and 74:
57 Harris (2001) claims that during
- Page 75 and 76:
59 display boards listed details of
- Page 77 and 78:
61 restriction was used. If there w
- Page 79 and 80:
63 to the end of the 1980’s. An o
- Page 81 and 82:
65 for teens overall had risen, emp
- Page 83 and 84:
67 for Australia using data from th
- Page 85 and 86:
69 training, can provide a form of
- Page 87 and 88:
71 employer survey estimates were t
- Page 89 and 90:
73 provisions for SYETP and extende
- Page 91 and 92:
75 withdrawals occurred at similar
- Page 93 and 94:
77 Table 2.17 State usage of progra
- Page 95 and 96:
79 2.3.1 Stretton (1982, 1984) 53 S
- Page 97 and 98:
81 Stretton attributed the success
- Page 99 and 100:
83 included in the employment model
- Page 101 and 102:
85 completers. Their argument was t
- Page 103 and 104:
87 was an issue for the data. Unlik
- Page 105 and 106:
89 Table 2.21 Richardson (1998) Est
- Page 107 and 108:
91 2.3.5 General discussion Some ge
- Page 109 and 110:
93 Controlling for differences in i
- Page 111 and 112:
95 taken by a previous researcher a
- Page 113 and 114:
97 If employability is assumed to b
- Page 115 and 116:
99 suitability of the underlying as
- Page 117 and 118:
101 Heckman, Lalonde and Smith (199
- Page 119 and 120:
103 effect on employment relative t
- Page 121 and 122:
105 Table 3.1, Part A Employment eq
- Page 123 and 124: 107 (-1.80) (-1.80) Tradesperson -0
- Page 125 and 126: 109 duration of Pre-June 1984 unemp
- Page 127 and 128: 111 4: Study 2 Propensity score mat
- Page 129 and 130: 113 Propensity score matching provi
- Page 131 and 132: 115 4.2 Propensity score matching m
- Page 133 and 134: 117 covariates that influence the a
- Page 135 and 136: 119 (7) E(Y c | D=1) = E P(X) {E[Y
- Page 137 and 138: 121 For CIA to be plausible, a ‘r
- Page 139 and 140: 123 employment and programme partic
- Page 141 and 142: Highest qualification in 1984 (1.56
- Page 143 and 144: 127 4.6 Distribution of the propens
- Page 145 and 146: 129 Figure 4.3 Histograms of estima
- Page 147 and 148: 131 Table 4.5 Summary statistics fo
- Page 149 and 150: 133 Table 4.5, that the variance of
- Page 151 and 152: 135 Table 4.6 Matching results, Sin
- Page 153 and 154: 137 Table 6.3 using Swedish data wi
- Page 155 and 156: 139 matching is the ability to weed
- Page 157 and 158: 141 Table 4.7 Matching results, All
- Page 159 and 160: 143 the unobserved component. If th
- Page 161 and 162: 145 5: Study 3 Attrition and non-re
- Page 163 and 164: 147 occur by design, because the mi
- Page 165 and 166: 149 (1990) extended and improved th
- Page 167 and 168: 151 (10) A* = δ 0 + δ 1 x +δ 2 z
- Page 169 and 170: 153 again from September to Novembe
- Page 171 and 172: 155 5.5.2 Univariate examination of
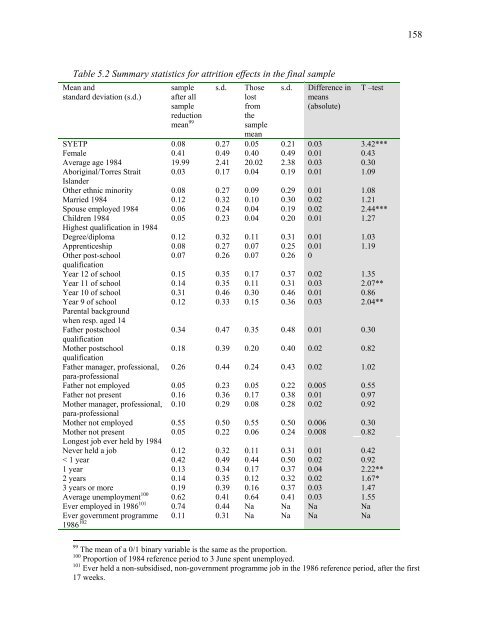
- Page 173: 157 lower, the job lengths are only
- Page 177 and 178: 161 The characteristics of the SYET
- Page 179 and 180: 163 para-professional Mother not em
- Page 181 and 182: 165 comparison group where the shar
- Page 183 and 184: 167 5.5.4 Attrition: natural attrit
- Page 185 and 186: 169 both sources that impose change
- Page 187 and 188: 171 para-professional Father not em
- Page 189 and 190: 173 work in later sections, this su
- Page 191 and 192: 175 Table 5.6: Effect of selection/
- Page 193 and 194: 177 appropriate to discard these fr
- Page 195 and 196: 179 Australia/Tasmania. Amongst tho
- Page 197 and 198: 181 Table 5.5a Summary statistics b
- Page 199 and 200: 183 5.6.1.2 Effects of the non-resp
- Page 201 and 202: 185 3 years + -0.35 -0.47 -0.34 -0.
- Page 203 and 204: 187 5.7 Multivariate analysis of ef
- Page 205 and 206: 189 proportion of time spent unempl
- Page 207 and 208: 191 post-school qualification, and
- Page 209 and 210: 193 Generally, those variables foun
- Page 211 and 212: 195 longj0 Longest job by 1984 < 1
- Page 213 and 214: 197 adopted in order to maintain co
- Page 215 and 216: 199 6: Study 4 Weighting to counter
- Page 217 and 218: 201 Table 6.1, part A Employment eq
- Page 219 and 220: 203 Methodist 0.133 0.261 (0.77) (1
- Page 221 and 222: 205 CEP referrals 1984 0.143* 0.128
- Page 223 and 224: 207 6.2 Results of weighting the PS
- Page 225 and 226:
209 The distribution of the propens
- Page 227 and 228:
211 Table 6.3 Weighted probit used
- Page 229 and 230:
213 (0.76) Tradesperson mtrad 0.20
- Page 231 and 232:
215 Table 6.5 Summary statistics fo
- Page 233 and 234:
217 Table 6.7 Matching results, sin
- Page 235 and 236:
219 6.3 Discussion The comparison o
- Page 237 and 238:
221 the selection into SYETP and th
- Page 239 and 240:
223 Heteroskedasticity is a violati
- Page 241 and 242:
225 Table 7.1, Part A Employment eq
- Page 243 and 244:
227 (1.26) (1.28) (1.16) Mothers oc
- Page 245 and 246:
229 Other Post-School qualification
- Page 247 and 248:
231 7.1.2 Exclusion restriction in
- Page 249 and 250:
233 Finally, the third panel of new
- Page 251 and 252:
235 Table 7.2 summary of changes to
- Page 253 and 254:
237 schooling that was statisticall
- Page 255 and 256:
239 (0.25) (0.21) 3 years + -0.50 -
- Page 257 and 258:
241 Table 7.4 Summary of distributi
- Page 259 and 260:
243 7.2.2 Propensity score matching
- Page 261 and 262:
245 original model, but with the pe
- Page 263 and 264:
247 maintained, then the Heckman bi
- Page 265 and 266:
249 Table 7.6 Weighted Probit used
- Page 267 and 268:
251 Table 7.7 Summary of distributi
- Page 269 and 270:
253 8: Summary and Conclusions The
- Page 271 and 272:
255 over which it ran, the review m
- Page 273 and 274:
257 the Heckman and PSM methods wer
- Page 275 and 276:
259 posited that that such sensitiv
- Page 277 and 278:
261 Description Derivation and deta
- Page 279 and 280:
Appendix 2 Tables 263
- Page 281 and 282:
2 years 0.28 0.07 (1.70) (1.70) 3 y
- Page 283 and 284:
267 Table A2.0b Univariate Probit o
- Page 285 and 286:
269 Religion brought up in (1.52) (
- Page 287 and 288:
271 hq9_84 Year 9 of school or less
- Page 289 and 290:
273 Table A2.1 Continued Means and
- Page 291 and 292:
275 mtrad Tradesperson 0.04 0.04 0.
- Page 293 and 294:
277 Year 9 of school or less -0.19
- Page 295 and 296:
279 Table A2.3 Probit of SYETP part
- Page 297 and 298:
281 (0.22) (0.44) (0.67) (0.89) Tra
- Page 299 and 300:
283 Table A2.5a Univariate probit f
- Page 301 and 302:
285 Manager/professional/para-profe
- Page 303 and 304:
3 years + -0.04 (2.13)* CEP referra
- Page 305 and 306:
289 Table A2.6 Part A Employment eq
- Page 307 and 308:
291 Table A2.6 Part B Selection/par
- Page 309 and 310:
293 Table A2.7 Part A Employment eq
- Page 311 and 312:
295 Table A2.7 Part B Selection/par
- Page 313 and 314:
297 Table A2.8 Part A Employment eq
- Page 315 and 316:
299 Table A2.8 Part B Selection/par
- Page 317 and 318:
301
- Page 319 and 320:
BLMR Bureau of Labour Market Resear
- Page 321 and 322:
Fay, R.G. (1996) "Enhancing the eff
- Page 323 and 324:
Heckman J.J. and Smith, J. A. (1998
- Page 325 and 326:
Lewis, H.G. (1963) "Unionism and re
- Page 327 and 328:
Quandt, R. (1972) "A new approach t
- Page 329 and 330:
Stromback, M. and Dockery, A. (2000


