Evaluation of the Australian Wage Subsidy Special Youth ...
Evaluation of the Australian Wage Subsidy Special Youth ... Evaluation of the Australian Wage Subsidy Special Youth ...
130 10 Treated propensity scores, Untreated propensity scores, 5 0 0 .2 .4 .6 Pr(syetp) kernel densities of propensity scores of the treated vs untreated Note: Epanechnikov kernel.
131 Table 4.5 Summary statistics for distribution of propensity scores Comparison group Percentiles Smallest 1% .0004381 .0000598 5% .0023942 .0000982 10% .0056824 .0001258 Observations 1179 25% .0174015 .0001335 50% .0488829 Mean .073496 Largest Std. Dev. .0784812 75% .1021392 .4204476 90% .1756042 .4249502 Variance .0061593 95% .2366404 .5203477 Skewness 1.912722 99% .3523099 .5458441 Kurtosis 7.518665 SYETP group Percentiles Smallest 1% .0224789 .0147686 5% .0303421 .0224789 10% .038564 .0227128 Observations 104 25% .0867105 .0228779 50% .1439536 Mean .1658229 Largest Std. Dev. .1082047 75% .2126023 .3920572 90% .3091516 .4926768 Variance .0117083 95% .3695493 .5044287 Skewness 1.04344 99% .5044287 .5258619 Kurtosis 4.192943
- Page 95 and 96: 79 2.3.1 Stretton (1982, 1984) 53 S
- Page 97 and 98: 81 Stretton attributed the success
- Page 99 and 100: 83 included in the employment model
- Page 101 and 102: 85 completers. Their argument was t
- Page 103 and 104: 87 was an issue for the data. Unlik
- Page 105 and 106: 89 Table 2.21 Richardson (1998) Est
- Page 107 and 108: 91 2.3.5 General discussion Some ge
- Page 109 and 110: 93 Controlling for differences in i
- Page 111 and 112: 95 taken by a previous researcher a
- Page 113 and 114: 97 If employability is assumed to b
- Page 115 and 116: 99 suitability of the underlying as
- Page 117 and 118: 101 Heckman, Lalonde and Smith (199
- Page 119 and 120: 103 effect on employment relative t
- Page 121 and 122: 105 Table 3.1, Part A Employment eq
- Page 123 and 124: 107 (-1.80) (-1.80) Tradesperson -0
- Page 125 and 126: 109 duration of Pre-June 1984 unemp
- Page 127 and 128: 111 4: Study 2 Propensity score mat
- Page 129 and 130: 113 Propensity score matching provi
- Page 131 and 132: 115 4.2 Propensity score matching m
- Page 133 and 134: 117 covariates that influence the a
- Page 135 and 136: 119 (7) E(Y c | D=1) = E P(X) {E[Y
- Page 137 and 138: 121 For CIA to be plausible, a ‘r
- Page 139 and 140: 123 employment and programme partic
- Page 141 and 142: Highest qualification in 1984 (1.56
- Page 143 and 144: 127 4.6 Distribution of the propens
- Page 145: 129 Figure 4.3 Histograms of estima
- Page 149 and 150: 133 Table 4.5, that the variance of
- Page 151 and 152: 135 Table 4.6 Matching results, Sin
- Page 153 and 154: 137 Table 6.3 using Swedish data wi
- Page 155 and 156: 139 matching is the ability to weed
- Page 157 and 158: 141 Table 4.7 Matching results, All
- Page 159 and 160: 143 the unobserved component. If th
- Page 161 and 162: 145 5: Study 3 Attrition and non-re
- Page 163 and 164: 147 occur by design, because the mi
- Page 165 and 166: 149 (1990) extended and improved th
- Page 167 and 168: 151 (10) A* = δ 0 + δ 1 x +δ 2 z
- Page 169 and 170: 153 again from September to Novembe
- Page 171 and 172: 155 5.5.2 Univariate examination of
- Page 173 and 174: 157 lower, the job lengths are only
- Page 175 and 176: 159 Work limited by health 1984 0.1
- Page 177 and 178: 161 The characteristics of the SYET
- Page 179 and 180: 163 para-professional Mother not em
- Page 181 and 182: 165 comparison group where the shar
- Page 183 and 184: 167 5.5.4 Attrition: natural attrit
- Page 185 and 186: 169 both sources that impose change
- Page 187 and 188: 171 para-professional Father not em
- Page 189 and 190: 173 work in later sections, this su
- Page 191 and 192: 175 Table 5.6: Effect of selection/
- Page 193 and 194: 177 appropriate to discard these fr
- Page 195 and 196: 179 Australia/Tasmania. Amongst tho
131<br />
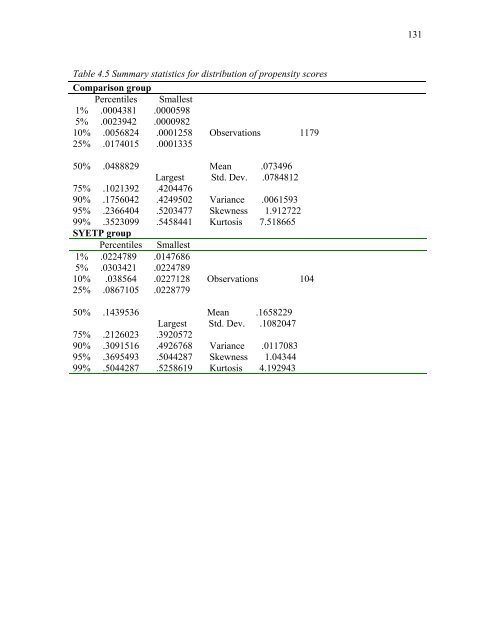
Table 4.5 Summary statistics for distribution <strong>of</strong> propensity scores<br />
Comparison group<br />
Percentiles Smallest<br />
1% .0004381 .0000598<br />
5% .0023942 .0000982<br />
10% .0056824 .0001258 Observations 1179<br />
25% .0174015 .0001335<br />
50% .0488829 Mean .073496<br />
Largest Std. Dev. .0784812<br />
75% .1021392 .4204476<br />
90% .1756042 .4249502 Variance .0061593<br />
95% .2366404 .5203477 Skewness 1.912722<br />
99% .3523099 .5458441 Kurtosis 7.518665<br />
SYETP group<br />
Percentiles Smallest<br />
1% .0224789 .0147686<br />
5% .0303421 .0224789<br />
10% .038564 .0227128 Observations 104<br />
25% .0867105 .0228779<br />
50% .1439536 Mean .1658229<br />
Largest Std. Dev. .1082047<br />
75% .2126023 .3920572<br />
90% .3091516 .4926768 Variance .0117083<br />
95% .3695493 .5044287 Skewness 1.04344<br />
99% .5044287 .5258619 Kurtosis 4.192943


