a complete copy of the 2012 CAFR Report! - PSERs
a complete copy of the 2012 CAFR Report! - PSERs
a complete copy of the 2012 CAFR Report! - PSERs
You also want an ePaper? Increase the reach of your titles
YUMPU automatically turns print PDFs into web optimized ePapers that Google loves.
INVESTMENT SECTION<br />
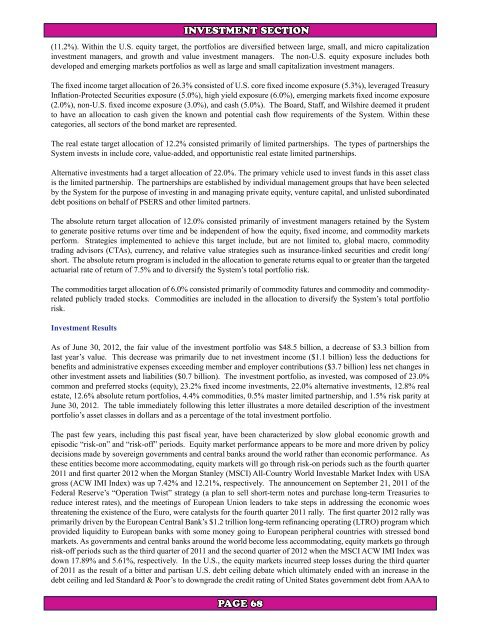
(11.2%). Within <strong>the</strong> U.S. equity target, <strong>the</strong> portfolios are diversified between large, small, and micro capitalization<br />
investment managers, and growth and value investment managers. The non-U.S. equity exposure includes both<br />
developed and emerging markets portfolios as well as large and small capitalization investment managers.<br />
The fixed income target allocation <strong>of</strong> 26.3% consisted <strong>of</strong> U.S. core fixed income exposure (5.3%), leveraged Treasury<br />
Inflation-Protected Securities exposure (5.0%), high yield exposure (6.0%), emerging markets fixed income exposure<br />
(2.0%), non-U.S. fixed income exposure (3.0%), and cash (5.0%). The Board, Staff, and Wilshire deemed it prudent<br />
to have an allocation to cash given <strong>the</strong> known and potential cash flow requirements <strong>of</strong> <strong>the</strong> System. Within <strong>the</strong>se<br />
categories, all sectors <strong>of</strong> <strong>the</strong> bond market are represented.<br />
The real estate target allocation <strong>of</strong> 12.2% consisted primarily <strong>of</strong> limited partnerships. The types <strong>of</strong> partnerships <strong>the</strong><br />
System invests in include core, value-added, and opportunistic real estate limited partnerships.<br />
Alternative investments had a target allocation <strong>of</strong> 22.0%. The primary vehicle used to invest funds in this asset class<br />
is <strong>the</strong> limited partnership. The partnerships are established by individual management groups that have been selected<br />
by <strong>the</strong> System for <strong>the</strong> purpose <strong>of</strong> investing in and managing private equity, venture capital, and unlisted subordinated<br />
debt positions on behalf <strong>of</strong> PSERS and o<strong>the</strong>r limited partners.<br />
The absolute return target allocation <strong>of</strong> 12.0% consisted primarily <strong>of</strong> investment managers retained by <strong>the</strong> System<br />
to generate positive returns over time and be independent <strong>of</strong> how <strong>the</strong> equity, fixed income, and commodity markets<br />
perform. Strategies implemented to achieve this target include, but are not limited to, global macro, commodity<br />
trading advisors (CTAs), currency, and relative value strategies such as insurance-linked securities and credit long/<br />
short. The absolute return program is included in <strong>the</strong> allocation to generate returns equal to or greater than <strong>the</strong> targeted<br />
actuarial rate <strong>of</strong> return <strong>of</strong> 7.5% and to diversify <strong>the</strong> System’s total portfolio risk.<br />
The commodities target allocation <strong>of</strong> 6.0% consisted primarily <strong>of</strong> commodity futures and commodity and commodityrelated<br />
publicly traded stocks. Commodities are included in <strong>the</strong> allocation to diversify <strong>the</strong> System’s total portfolio<br />
risk.<br />
Investment Results<br />
As <strong>of</strong> June 30, <strong>2012</strong>, <strong>the</strong> fair value <strong>of</strong> <strong>the</strong> investment portfolio was $48.5 billion, a decrease <strong>of</strong> $3.3 billion from<br />
last year’s value. This decrease was primarily due to net investment income ($1.1 billion) less <strong>the</strong> deductions for<br />
benefits and administrative expenses exceeding member and employer contributions ($3.7 billion) less net changes in<br />
o<strong>the</strong>r investment assets and liabilities ($0.7 billion). The investment portfolio, as invested, was composed <strong>of</strong> 23.0%<br />
common and preferred stocks (equity), 23.2% fixed income investments, 22.0% alternative investments, 12.8% real<br />
estate, 12.6% absolute return portfolios, 4.4% commodities, 0.5% master limited partnership, and 1.5% risk parity at<br />
June 30, <strong>2012</strong>. The table immediately following this letter illustrates a more detailed description <strong>of</strong> <strong>the</strong> investment<br />
portfolio’s asset classes in dollars and as a percentage <strong>of</strong> <strong>the</strong> total investment portfolio.<br />
The past few years, including this past fiscal year, have been characterized by slow global economic growth and<br />
episodic “risk-on” and “risk-<strong>of</strong>f” periods. Equity market performance appears to be more and more driven by policy<br />
decisions made by sovereign governments and central banks around <strong>the</strong> world ra<strong>the</strong>r than economic performance. As<br />
<strong>the</strong>se entities become more accommodating, equity markets will go through risk-on periods such as <strong>the</strong> fourth quarter<br />
2011 and first quarter <strong>2012</strong> when <strong>the</strong> Morgan Stanley (MSCI) All-Country World Investable Market Index with USA<br />
gross (ACW IMI Index) was up 7.42% and 12.21%, respectively. The announcement on September 21, 2011 <strong>of</strong> <strong>the</strong><br />
Federal Reserve’s “Operation Twist” strategy (a plan to sell short-term notes and purchase long-term Treasuries to<br />
reduce interest rates), and <strong>the</strong> meetings <strong>of</strong> European Union leaders to take steps in addressing <strong>the</strong> economic woes<br />
threatening <strong>the</strong> existence <strong>of</strong> <strong>the</strong> Euro, were catalysts for <strong>the</strong> fourth quarter 2011 rally. The first quarter <strong>2012</strong> rally was<br />
primarily driven by <strong>the</strong> European Central Bank’s $1.2 trillion long-term refinancing operating (LTRO) program which<br />
provided liquidity to European banks with some money going to European peripheral countries with stressed bond<br />
markets. As governments and central banks around <strong>the</strong> world become less accommodating, equity markets go through<br />
risk-<strong>of</strong>f periods such as <strong>the</strong> third quarter <strong>of</strong> 2011 and <strong>the</strong> second quarter <strong>of</strong> <strong>2012</strong> when <strong>the</strong> MSCI ACW IMI Index was<br />
down 17.89% and 5.61%, respectively. In <strong>the</strong> U.S., <strong>the</strong> equity markets incurred steep losses during <strong>the</strong> third quarter<br />
<strong>of</strong> 2011 as <strong>the</strong> result <strong>of</strong> a bitter and partisan U.S. debt ceiling debate which ultimately ended with an increase in <strong>the</strong><br />
debt ceiling and led Standard & Poor’s to downgrade <strong>the</strong> credit rating <strong>of</strong> United States government debt from AAA to<br />
PAGE 68


