

a complete copy of the 2012 CAFR Report! - PSERs
a complete copy of the 2012 CAFR Report! - PSERs
a complete copy of the 2012 CAFR Report! - PSERs

You also want an ePaper? Increase the reach of your titles
YUMPU automatically turns print PDFs into web optimized ePapers that Google loves.
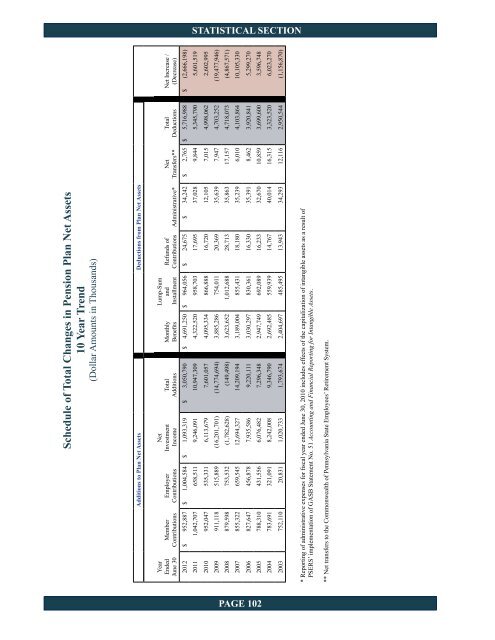
STATISTICAL SECTION<br />
Schedule <strong>of</strong> Total Changes in Pension Plan Net Assets<br />
10 Year Trend<br />
(Dollar Amounts in Thousands)<br />
Additions to Plan Net Assets Deductions from Plan Net Assets<br />
Year<br />
Ended<br />
June 30<br />
Member<br />
Contributions<br />
Employer<br />
Contributions<br />
Net<br />
Investment<br />
Income<br />
Total<br />
Additions<br />
Monthly<br />
Benefits<br />
Lump-Sum<br />
and<br />
Installment<br />
Refunds <strong>of</strong><br />
Contributions Administrative*<br />
Net<br />
Transfers**<br />
Total<br />
Deductions<br />
Net Increase /<br />
(Decrease)<br />
<strong>2012</strong> $ 952,887 $ 1,004,584 $ 1,093,319 $ 3,050,790 $ 4,691,250 $ 964,056 $ 24,675 $ 34,242 $ 2,765 $ 5,716,988 $ (2,666,198)<br />
2011 1,042,707 658,511 9,246,091 10,947,309 4,322,520 958,703 17,695 37,028 9,844 5,345,790 5,601,519<br />
2010 952,047 535,331 6,113,679 7,601,057 4,095,334 866,888 16,720 12,105 7,015 4,998,062 2,602,995<br />
2009 911,118 515,889 (16,201,701) (14,774,694) 3,885,286 754,011 20,369 35,639 7,947 4,703,252 (19,477,946)<br />
2008 879,598 753,532 (1,782,628) (149,498) 3,623,652 1,012,688 28,713 35,863 17,157 4,718,073 (4,867,571)<br />
2007 855,322 659,545 12,694,327 14,209,194 3,189,004 855,431 18,180 35,239 6,010 4,103,864 10,105,330<br />
2006 827,647 456,878 7,935,586 9,220,111 3,030,297 830,361 16,330 35,391 8,462 3,920,841 5,299,270<br />
2005 788,310 431,556 6,076,482 7,296,348 2,947,749 692,089 16,233 32,670 10,859 3,699,600 3,596,748<br />
2004 783,691 321,091 8,242,008 9,346,790 2,692,485 559,939 14,767 40,014 16,315 3,323,520 6,023,270<br />
2003 752,110 20,831 1,020,733 1,793,674 2,404,697 485,495 13,943 34,293 12,116 2,950,544 (1,156,870)<br />
* <strong>Report</strong>ing <strong>of</strong> administrative expenses for fiscal year ended June 30, 2010 includes effects <strong>of</strong> <strong>the</strong> capitalization <strong>of</strong> intangible assets as a result <strong>of</strong><br />
PSERS’ implementation <strong>of</strong> GASB Statement No. 51 Accounting and Financial <strong>Report</strong>ing for Intangible Assets.<br />
** Net transfers to <strong>the</strong> Commonwealth <strong>of</strong> Pennsylvania State Employees’ Retirement System.<br />
PAGE 102


