a complete copy of the 2012 CAFR Report! - PSERs
a complete copy of the 2012 CAFR Report! - PSERs
a complete copy of the 2012 CAFR Report! - PSERs
You also want an ePaper? Increase the reach of your titles
YUMPU automatically turns print PDFs into web optimized ePapers that Google loves.
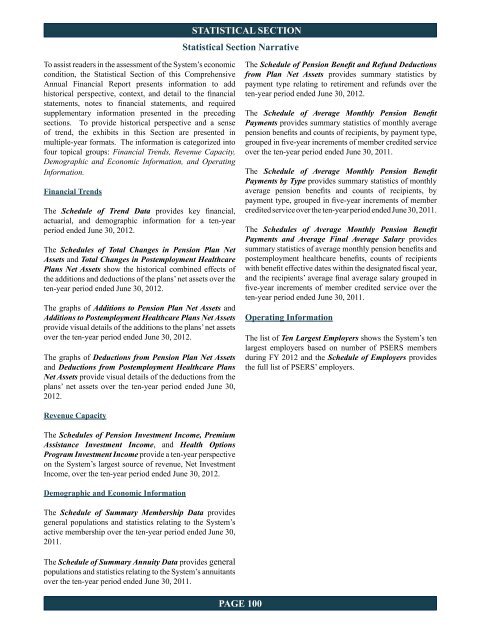
STATISTICAL SECTION<br />
Statistical Section Narrative<br />
To assist readers in <strong>the</strong> assessment <strong>of</strong> <strong>the</strong> System’s economic<br />
condition, <strong>the</strong> Statistical Section <strong>of</strong> this Comprehensive<br />
Annual Financial <strong>Report</strong> presents information to add<br />
historical perspective, context, and detail to <strong>the</strong> financial<br />
statements, notes to financial statements, and required<br />
supplementary information presented in <strong>the</strong> preceding<br />
sections. To provide historical perspective and a sense<br />
<strong>of</strong> trend, <strong>the</strong> exhibits in this Section are presented in<br />
multiple-year formats. The information is categorized into<br />
four topical groups: Financial Trends, Revenue Capacity,<br />
Demographic and Economic Information, and Operating<br />
Information.<br />
Financial Trends<br />
The Schedule <strong>of</strong> Trend Data provides key financial,<br />
actuarial, and demographic information for a ten-year<br />
period ended June 30, <strong>2012</strong>.<br />
The Schedules <strong>of</strong> Total Changes in Pension Plan Net<br />
Assets and Total Changes in Postemployment Healthcare<br />
Plans Net Assets show <strong>the</strong> historical combined effects <strong>of</strong><br />
<strong>the</strong> additions and deductions <strong>of</strong> <strong>the</strong> plans’ net assets over <strong>the</strong><br />
ten-year period ended June 30, <strong>2012</strong>.<br />
The graphs <strong>of</strong> Additions to Pension Plan Net Assets and<br />
Additions to Postemployment Healthcare Plans Net Assets<br />
provide visual details <strong>of</strong> <strong>the</strong> additions to <strong>the</strong> plans’ net assets<br />
over <strong>the</strong> ten-year period ended June 30, <strong>2012</strong>.<br />
The graphs <strong>of</strong> Deductions from Pension Plan Net Assets<br />
and Deductions from Postemployment Healthcare Plans<br />
Net Assets provide visual details <strong>of</strong> <strong>the</strong> deductions from <strong>the</strong><br />
plans’ net assets over <strong>the</strong> ten-year period ended June 30,<br />
<strong>2012</strong>.<br />
The Schedule <strong>of</strong> Pension Benefit and Refund Deductions<br />
from Plan Net Assets provides summary statistics by<br />
payment type relating to retirement and refunds over <strong>the</strong><br />
ten-year period ended June 30, <strong>2012</strong>.<br />
The Schedule <strong>of</strong> Average Monthly Pension Benefit<br />
Payments provides summary statistics <strong>of</strong> monthly average<br />
pension benefits and counts <strong>of</strong> recipients, by payment type,<br />
grouped in five-year increments <strong>of</strong> member credited service<br />
over <strong>the</strong> ten-year period ended June 30, 2011.<br />
The Schedule <strong>of</strong> Average Monthly Pension Benefit<br />
Payments by Type provides summary statistics <strong>of</strong> monthly<br />
average pension benefits and counts <strong>of</strong> recipients, by<br />
payment type, grouped in five-year increments <strong>of</strong> member<br />
credited service over <strong>the</strong> ten-year period ended June 30, 2011.<br />
The Schedules <strong>of</strong> Average Monthly Pension Benefit<br />
Payments and Average Final Average Salary provides<br />
summary statistics <strong>of</strong> average monthly pension benefits and<br />
postemployment healthcare benefits, counts <strong>of</strong> recipients<br />
with benefit effective dates within <strong>the</strong> designated fiscal year,<br />
and <strong>the</strong> recipients’ average final average salary grouped in<br />
five-year increments <strong>of</strong> member credited service over <strong>the</strong><br />
ten-year period ended June 30, 2011.<br />
Operating Information<br />
The list <strong>of</strong> Ten Largest Employers shows <strong>the</strong> System’s ten<br />
largest employers based on number <strong>of</strong> PSERS members<br />
during FY <strong>2012</strong> and <strong>the</strong> Schedule <strong>of</strong> Employers provides<br />
<strong>the</strong> full list <strong>of</strong> PSERS’ employers.<br />
Revenue Capacity<br />
The Schedules <strong>of</strong> Pension Investment Income, Premium<br />
Assistance Investment Income, and Health Options<br />
Program Investment Income provide a ten-year perspective<br />
on <strong>the</strong> System’s largest source <strong>of</strong> revenue, Net Investment<br />
Income, over <strong>the</strong> ten-year period ended June 30, <strong>2012</strong>.<br />
Demographic and Economic Information<br />
The Schedule <strong>of</strong> Summary Membership Data provides<br />
general populations and statistics relating to <strong>the</strong> System’s<br />
active membership over <strong>the</strong> ten-year period ended June 30,<br />
2011.<br />
The Schedule <strong>of</strong> Summary Annuity Data provides general<br />
populations and statistics relating to <strong>the</strong> System’s annuitants<br />
over <strong>the</strong> ten-year period ended June 30, 2011.<br />
PAGE 100


