

Fidelity VIP Index 500 Portfolio - Prudential
Fidelity VIP Index 500 Portfolio - Prudential
Fidelity VIP Index 500 Portfolio - Prudential

You also want an ePaper? Increase the reach of your titles
YUMPU automatically turns print PDFs into web optimized ePapers that Google loves.
<strong>Fidelity</strong> <strong>VIP</strong> <strong>Index</strong> <strong>500</strong> <strong>Portfolio</strong><br />
<strong>Fidelity</strong> Variable Insurance Products<br />
Investment Objective<br />
The Fund seeks investment results that correspond to the total return of common<br />
stocks publicly traded in the United States, as represented by the S&P <strong>500</strong> <strong>Index</strong>.<br />
There is no guarantee that these objectives will be achieved.<br />
Fact Sheet as of 09/30/2013<br />
Share Class<br />
Service Class<br />
Lipper Classification<br />
S&P <strong>500</strong> <strong>Index</strong> Funds<br />
Performance Overview<br />
Cumulative<br />
Annualized<br />
QTD YTD 1 Yr 3 Yr 5 Yr 10 Yr<br />
Since<br />
Incep<br />
Var Ins Prod2:Idx 5;Svc 5.19 19.61 19.10 16.05 9.89 7.39 2.73<br />
S&P <strong>500</strong> Daily Reinv IX 1 5.25 19.79 19.34 16.27 10.02 7.57 -<br />
1<br />
Fund Manager Benchmark<br />
Past performance does not guarantee future returns. The investment return and<br />
principal value of an investment will fluctuate so that the units, when redeemed,<br />
may be worth more or less than their original cost. Current performance may be<br />
lower or higher than the past performance data quoted. Performance information<br />
as of the most recent month-end is available upon request.<br />
Total return performance includes the reinvestment of all income dividends and<br />
capital gains distributions and DOES NOT include the effects of sales charges.<br />
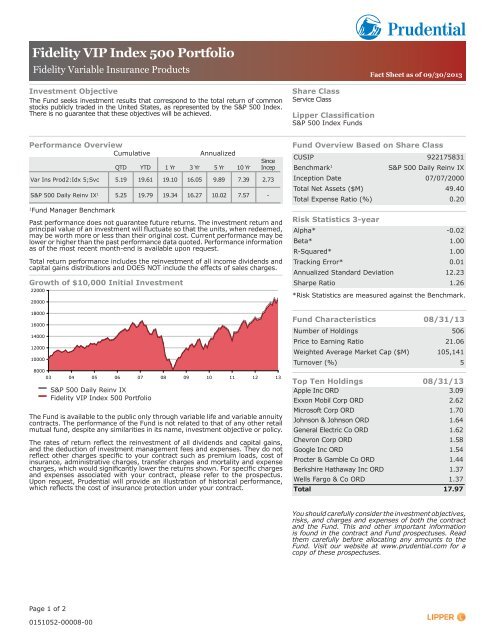
Growth of $10,000 Initial Investment<br />
22000<br />
20000<br />
18000<br />
16000<br />
14000<br />
12000<br />
10000<br />
8000<br />
03 04 05 06 07 08 09 10 11 12 13<br />
S&P <strong>500</strong> Daily Reinv IX<br />
<strong>Fidelity</strong> <strong>VIP</strong> <strong>Index</strong> <strong>500</strong> <strong>Portfolio</strong><br />
The Fund is available to the public only through variable life and variable annuity<br />
contracts. The performance of the Fund is not related to that of any other retail<br />
mutual fund, despite any similarities in its name, investment objective or policy.<br />
The rates of return reflect the reinvestment of all dividends and capital gains,<br />
and the deduction of investment management fees and expenses. They do not<br />
reflect other charges specific to your contract such as premium loads, cost of<br />
insurance, administrative charges, transfer charges and mortality and expense<br />
charges, which would significantly lower the returns shown. For specific charges<br />
and expenses associated with your contract, please refer to the prospectus.<br />
Upon request, <strong>Prudential</strong> will provide an illustration of historical performance,<br />
which reflects the cost of insurance protection under your contract.<br />
Fund Overview Based on Share Class<br />
CUSIP 922175831<br />
Benchmark 1<br />
S&P <strong>500</strong> Daily Reinv IX<br />
Inception Date 07/07/2000<br />
Total Net Assets ($M) 49.40<br />
Total Expense Ratio (%) 0.20<br />
Risk Statistics 3-year<br />
Alpha* -0.02<br />
Beta* 1.00<br />
R-Squared* 1.00<br />
Tracking Error* 0.01<br />
Annualized Standard Deviation 12.23<br />
Sharpe Ratio 1.26<br />
*Risk Statistics are measured against the Benchmark.<br />
Fund Characteristics 08/31/13<br />
Number of Holdings 506<br />
Price to Earning Ratio 21.06<br />
Weighted Average Market Cap ($M) 105,141<br />
Turnover (%) 5<br />
Top Ten Holdings 08/31/13<br />
Apple Inc ORD 3.09<br />
Exxon Mobil Corp ORD 2.62<br />
Microsoft Corp ORD 1.70<br />
Johnson & Johnson ORD 1.64<br />
General Electric Co ORD 1.62<br />
Chevron Corp ORD 1.58<br />
Google Inc ORD 1.54<br />
Procter & Gamble Co ORD 1.44<br />
Berkshire Hathaway Inc ORD 1.37<br />
Wells Fargo & Co ORD 1.37<br />
Total 17.97<br />
You should carefully consider the investment objectives,<br />
risks, and charges and expenses of both the contract<br />
and the Fund. This and other important information<br />
is found in the contract and Fund prospectuses. Read<br />
them carefully before allocating any amounts to the<br />
Fund. Visit our website at www.prudential.com for a<br />
copy of these prospectuses.<br />
Page 1 of 2<br />
0151052-00008-00
<strong>Fidelity</strong> <strong>VIP</strong> <strong>Index</strong> <strong>500</strong> <strong>Portfolio</strong><br />
<strong>Fidelity</strong> Variable Insurance Products<br />
Sector Allocation 08/31/13<br />
1 Financials 17.07<br />
9 10<br />
8<br />
1<br />
7<br />
6<br />
2<br />
5<br />
3<br />
4<br />
2 Technology 15.12<br />
3 Consumer Services 12.80<br />
4 Health Care 12.06<br />
5 Industrials 11.47<br />
6 Consumer Goods 10.57<br />
7 Oil & Gas 10.24<br />
8 Utilities 3.31<br />
9 Basic Materials 2.76<br />
10 Telecommunications 2.45<br />
Managed By<br />
ADVISOR<br />
<strong>Fidelity</strong> Management & Research Company<br />
SUB-ADVISOR(S)<br />
Geode Capital Management, LLC<br />
FMR Co., Inc. (FMRC)<br />
Asset Allocation 08/31/13<br />
Equity<br />
98.19<br />
Other<br />
Cash<br />
Fixed Income<br />
1.01<br />
0.74<br />
0.06<br />
0 25 50 75 100 125<br />
% of Investments<br />
Top Holdings, Asset Allocation, Quality Analysis &<br />
Sector Weightings<br />
Data is based on information collected from the investment<br />
company, is updated as of the date shown in the section’s title, and<br />
will vary over time. Asset Allocation may equal less than or greater<br />
than 100% due to hedged funds or leveraged cash positions by the<br />
Fund. Holdings and allocations are subject to change.<br />
Risk Measures<br />
Alpha - Measures a manager’s contribution to performance due to<br />
security selection or market timing relative to the index.<br />
Beta – Measures a portfolio’s sensitivity to market movements in<br />
the index.<br />
R-Squared - A measure that indicates the extent to which fluctuations<br />
in portfolio returns are correlated with those of the index.<br />
Standard Deviation – A measure of risk that gauges the variability<br />
of actual returns from the expected values and the dispersion of<br />
these variations over time.<br />
Sharpe Ratio – A measure that uses standard deviation and excess<br />
return to determine reward per unit of risk.<br />
Tracking Error – A divergence between the price behavior of a<br />
position or portfolio and the price behavior of a benchmark.<br />
Indices<br />
The S&P <strong>500</strong> <strong>Index</strong> is widely regarded as the best single gauge<br />
of the U.S. equities market, this world-renowned index includes<br />
a representative sample of <strong>500</strong> leading companies in leading<br />
industries of the U.S. economy. Although the S&P <strong>500</strong> focuses on<br />
the Large-Cap segment of the market, with over 80% coverage<br />
of U.S. equities, it is also an ideal proxy for the total market.<br />
The value of the index includes reinvestment of all dividends. An<br />
investor cannot invest directly in an index.<br />
S&P <strong>500</strong> Funds<br />
The S&P <strong>500</strong> <strong>Index</strong> Fund is an unmanaged index of <strong>500</strong> Large-Cap<br />
U.S. stocks that is generally considered to be representative of U.S.<br />
stock market activity. The S&P <strong>500</strong> <strong>Index</strong> is not available for direct<br />
investment and its returns do not reflect the fees and expenses<br />
that have been deducted from the fund’s return.<br />
Group variable life insurance products are issued by The <strong>Prudential</strong> Insurance Company of America (“<strong>Prudential</strong>”) and distributed through<br />
<strong>Prudential</strong> Investment Management Services LLC (“PIMS”). The <strong>Prudential</strong> Insurance Company of America is located at 751 Broad Street,<br />
Newark, NJ 07102 and PIMS is located at Three Gateway Center, 14th Floor, Newark, NJ 07102. Both are <strong>Prudential</strong> Financial companies<br />
and each is solely responsible for its financial and contractual obligations.<br />
©2013 <strong>Prudential</strong> Financial, Inc. and its related entities. <strong>Prudential</strong>, the <strong>Prudential</strong> logo and the Rock symbol are service marks of<br />
<strong>Prudential</strong> Financial, Inc. and its related entities, registered in many jurisdictions worldwide.<br />
<strong>Prudential</strong> and <strong>Fidelity</strong> Investments are not affiliated.<br />
Fund data provided by Lipper. © 2013 Thomson Reuters. All rights reserved. Any copying, republication or redistribution of Lipper content<br />
is expressly prohibited without the prior written consent of Lipper. The information contained herein is not represented or warranted to be<br />
accurate, complete, or timely. Past performance is no guarantee of future performance.<br />
Page 2 of 2


