2012 PROCEEDINGS - Public Relations Society of America
2012 PROCEEDINGS - Public Relations Society of America
2012 PROCEEDINGS - Public Relations Society of America

Create successful ePaper yourself
Turn your PDF publications into a flip-book with our unique Google optimized e-Paper software.
Van Der Pool, L. (2003). PR firms catering to do-gooder clients. Adweek Eastern Edition, 44(28),<br />
12.<br />
Waters, R. D. (2009). Measuring stewardship in public relations: A test exploring impact on the<br />
fundraising relationship. <strong>Public</strong> <strong>Relations</strong> Review, 35(2), 113-119.<br />
doi:10.1016/j.pubrev.2009.01.012.<br />
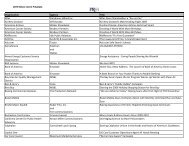
Table 1: Distribution <strong>of</strong> Practitioners Across Employer Types<br />
Employer Type Frequency Percent<br />
Corporation 324 23.5<br />
Educational institution 133 9.7<br />
Government or military 126 9.2<br />
Independent practitioner 100 7.3<br />
Nonpr<strong>of</strong>it or association 298 21.6<br />
Pr<strong>of</strong>essional services 49 3.6<br />
<strong>Public</strong> relations consultancy or agency 307 22.3<br />
Other 40 2.9<br />
Total 1,377 100.0<br />
Table 2: Distribution Across Employer Types by Gender<br />
Employer Type Male % (N) Female % (N) Total % (N)<br />
Corporation 28.0% (90) 27.0% (234) 27.3% (324)<br />
Educational institution 9.3% (30) 11.9% (103) 11.2% (133)<br />
Government or military 13.4% (43) 9.6% (83) 10.6% (126)<br />
Nonpr<strong>of</strong>it or association 19.6% (63) 27.1% (235) 25.1% (298)<br />
<strong>Public</strong> relations consultancy or agency 29.8% (96) 24.4% (211) 25.8% (307)<br />
Total 100.0% (322) 100.0% (866) 100.0% (1188)<br />
Notes: Pearson Chi-square = 12.67; df = 4; p < .05<br />
Table 3: Distribution Across Employer Types by Education Level<br />
Employer Type<br />
Associate‘s & Bachelor‘s Master‘s & Total % (N)<br />
Below % (N) Degree % (N) Above % (N)<br />
Corporation 18.2% (4) 26.8% (201) 28.6% (118) 27.3% (323)<br />
Educational institution 4.5% (1) 9.9% (74) 14.1% (58) 11.2% (133)<br />
Government or military 22.7% (5) 8.3% (62) 14.1% (58) 10.6% (125)<br />
Nonpr<strong>of</strong>it or association 13.6% (3) 27.4% (205) 21.6% (89) 25.1% (297)<br />
<strong>Public</strong> relations consultancy or 40.9% (9) 27.6% (207) 21.6% (89) 25.8% (305)<br />
agency<br />
Total 100.0% (22) 100.0% (749) 100.0% (412) 100.0% (1183)<br />
Notes: Pearson Chi-square = 28.10; df = 8; p < .001<br />
82