

Chapter 2: Graphs, Charts, and Tables--Describing Your Data
Chapter 2: Graphs, Charts, and Tables--Describing Your Data
Chapter 2: Graphs, Charts, and Tables--Describing Your Data

Create successful ePaper yourself
Turn your PDF publications into a flip-book with our unique Google optimized e-Paper software.
40 CHAPTER 2 • GRAPHS, CHARTS, AND TABLES—DESCRIBING YOUR DATA<br />
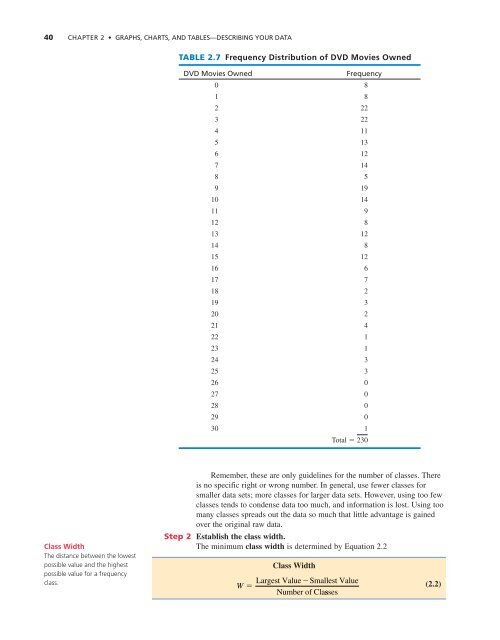
TABLE 2.7 Frequency Distribution of DVD Movies Owned<br />
DVD Movies Owned<br />
Frequency<br />
0 8<br />
1 8<br />
2 22<br />
3 22<br />
4 11<br />
5 13<br />
6 12<br />
7 14<br />
8 5<br />
9 19<br />
10 14<br />
11 9<br />
12 8<br />
13 12<br />
14 8<br />
15 12<br />
16 6<br />
17 7<br />
18 2<br />
19 3<br />
20 2<br />
21 4<br />
22 1<br />
23 1<br />
24 3<br />
25 3<br />
26 0<br />
27 0<br />
28 0<br />
29 0<br />
30 1<br />
Total 230<br />
Class Width<br />
The distance between the lowest<br />
possible value <strong>and</strong> the highest<br />
possible value for a frequency<br />
class.<br />
Remember, these are only guidelines for the number of classes. There<br />
is no specific right or wrong number. In general, use fewer classes for<br />
smaller data sets; more classes for larger data sets. However, using too few<br />
classes tends to condense data too much, <strong>and</strong> information is lost. Using too<br />
many classes spreads out the data so much that little advantage is gained<br />
over the original raw data.<br />
Step 2 Establish the class width.<br />
The minimum class width is determined by Equation 2.2<br />
Class Width<br />
Largest ValueSmallest Value<br />
W <br />
Number of Classes<br />
(2.2)


