

F&N Bulletin Vol 23 No 1b - United Nations University
F&N Bulletin Vol 23 No 1b - United Nations University
F&N Bulletin Vol 23 No 1b - United Nations University

You also want an ePaper? Increase the reach of your titles
YUMPU automatically turns print PDFs into web optimized ePapers that Google loves.
44<br />
E-S. Tee et al.<br />
weight-for-age Z score of boys and girls. The mean<br />
weight-for-age Z score of girls was significantly lower<br />
than that for 8- and 10-year-old boys and for all the<br />
age groups combined.<br />
Weight-for-height Z score could not be analyzed<br />
for about 3% of the boys and 30% of the girls. This<br />
was because the Anthro software program, which is<br />
based on the NCHS data, has an inherent limit to the<br />
maximum height and age that it can handle. Thus, it<br />
was not possible to compare the weight-for-height Z<br />
scores of 10-year-old boys and girls.<br />
The difference in mean weight-for-height Z score of<br />
the children followed the same pattern as that observed<br />
for weight-for-age Z score. The mean weight-forheight<br />
Z score of girls was significantly lower than that<br />
of 8- and 9-year-old boys and for all the age groups<br />
combined. Except for 8-year-old children, in which<br />
there was no difference between boys and girls, the<br />
prevalence of wasting was 1.1 times higher among<br />
boys and for all age groups combined. The overall<br />
prevalence was 4.7% for boys and 4.4% for girls.<br />
Prevalence of overweight<br />
The prevalence of overweight (weight-for-height Z<br />
score > 2 SD) was 7.7% (table 2). This was about<br />
1.6 times greater than the prevalence of wasting. The<br />
prevalence of overweight among boys (9.5%) was<br />
about 1.9 times greater than that among girls (5.1%).<br />
For all age groups, this prevalence was 1.2 to 2.3 times<br />
higher in boys. As explained earlier, the weight-forheight<br />
Z scores for 10-year-old girls could not be<br />
analyzed by the Anthro program.<br />
Prevalence of thinness and overweight according to<br />
BMI-for-age<br />
Because it was not possible to analyze about 30% of<br />
the weight-for-height data for girls, especially the<br />
older children, BMI-for-age was used to determine<br />
the prevalences of thinness and overweight of all the<br />
children in the study. The prevalence of thinness (BMI<br />
< 5th percentile of NHANES I reference data [1]) was<br />
13.7% for boys (N = 3,037) and 15.4% for girls (N =<br />
2,958); the combined prevalence for both was 14.5%<br />
(N = 5,995). The prevalence of risk of overweight<br />
(≥ 85th percentile of NHANES I reference data) was<br />
19.2% for boys and 16.5% for girls, with a combined<br />
prevalence of 17.8% (table 3).<br />
When the prevalences based on BMI-for-age are<br />
compared with figures derived from weight-for-height<br />
Z scores based on the NCHS reference (table 3), the<br />
prevalence of thinness was found to be about three<br />
times higher, whereas the prevalence of overweight<br />
was about two to three times higher. The comparisons<br />
made are not strictly valid, because the children in both<br />
groups are not exactly the same. Further investigations<br />
were therefore carried out by analyzing the prevalences<br />
of thinness and overweight for the same group of<br />
children using the two methods.<br />
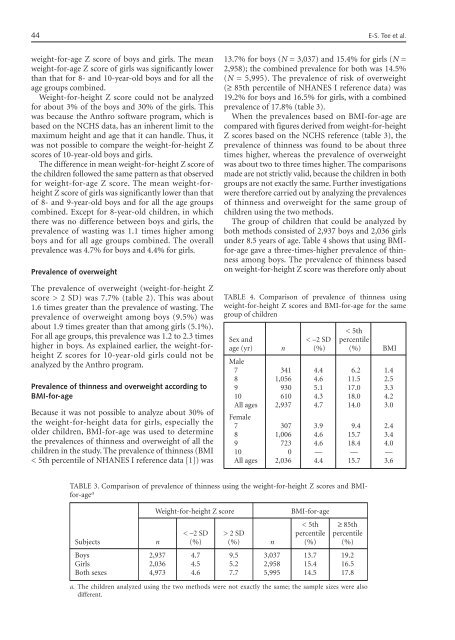
The group of children that could be analyzed by<br />
both methods consisted of 2,937 boys and 2,036 girls<br />
under 8.5 years of age. Table 4 shows that using BMIfor-age<br />
gave a three-times-higher prevalence of thinness<br />
among boys. The prevalence of thinness based<br />
on weight-for-height Z score was therefore only about<br />
TABLE 4. Comparison of prevalence of thinness using<br />
weight-for-height Z scores and BMI-for-age for the same<br />
group of children<br />
< 5th<br />
Sex and < –2 SD percentile<br />
age (yr) n (%) (%) BMI<br />
Male<br />
7 341 4.4 6.2 1.4<br />
8 1,056 4.6 11.5 2.5<br />
9 930 5.1 17.0 3.3<br />
10 610 4.3 18.0 4.2<br />
All ages 2,937 4.7 14.0 3.0<br />
Female<br />
7 307 3.9 9.4 2.4<br />
8 1,006 4.6 15.7 3.4<br />
9 7<strong>23</strong> 4.6 18.4 4.0<br />
10 0 — — —<br />
All ages 2,036 4.4 15.7 3.6<br />
TABLE 3. Comparison of prevalence of thinness using the weight-for-height Z scores and BMIfor-age<br />
a Weight-for-height Z score BMI-for-age<br />
< 5th ≥ 85th<br />
< –2 SD > 2 SD percentile percentile<br />
Subjects n (%) (%) n (%) (%)<br />
Boys 2,937 4.7 9.5 3,037 13.7 19.2<br />
Girls 2,036 4.5 5.2 2,958 15.4 16.5<br />
Both sexes 4,973 4.6 7.7 5,995 14.5 17.8<br />
a. The children analyzed using the two methods were not exactly the same; the sample sizes were also<br />
different.


