

F&N Bulletin Vol 23 No 1b - United Nations University
F&N Bulletin Vol 23 No 1b - United Nations University
F&N Bulletin Vol 23 No 1b - United Nations University

Create successful ePaper yourself
Turn your PDF publications into a flip-book with our unique Google optimized e-Paper software.
34<br />
Soekirman et al.<br />
stunting (height-for-age), and obesity (BMI) status.<br />
However, data from only 1,245 children could be<br />
analyzed for wasting (based on weight-for-height)<br />
status, because of the limitation of the weight-forheight<br />
reference in the WHO publication (female up<br />
to 137 cm and male up to 145 cm). There were 890<br />
children in West Jakarta and 477 children in Bogor.<br />
Mean weight and height<br />
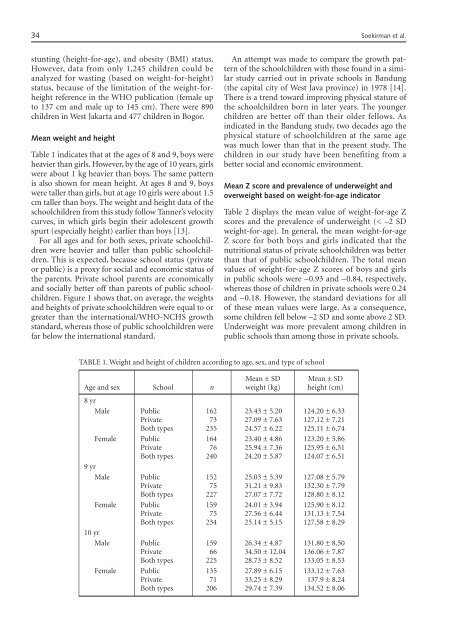
Table 1 indicates that at the ages of 8 and 9, boys were<br />
heavier than girls. However, by the age of 10 years, girls<br />
were about 1 kg heavier than boys. The same pattern<br />
is also shown for mean height. At ages 8 and 9, boys<br />
were taller than girls, but at age 10 girls were about 1.5<br />
cm taller than boys. The weight and height data of the<br />
schoolchildren from this study follow Tanner’s velocity<br />
curves, in which girls begin their adolescent growth<br />
spurt (especially height) earlier than boys [13].<br />
For all ages and for both sexes, private schoolchildren<br />
were heavier and taller than public schoolchildren.<br />
This is expected, because school status (private<br />
or public) is a proxy for social and economic status of<br />
the parents. Private school parents are economically<br />
and socially better off than parents of public schoolchildren.<br />
Figure 1 shows that, on average, the weights<br />
and heights of private schoolchildren were equal to or<br />
greater than the international/WHO-NCHS growth<br />
standard, whereas those of public schoolchildren were<br />
far below the international standard.<br />
An attempt was made to compare the growth pattern<br />
of the schoolchildren with those found in a similar<br />
study carried out in private schools in Bandung<br />
(the capital city of West Java province) in 1978 [14].<br />
There is a trend toward improving physical stature of<br />
the schoolchildren born in later years. The younger<br />
children are better off than their older fellows. As<br />
indicated in the Bandung study, two decades ago the<br />
physical stature of schoolchildren at the same age<br />
was much lower than that in the present study. The<br />
children in our study have been benefiting from a<br />
better social and economic environment.<br />
Mean Z score and prevalence of underweight and<br />
overweight based on weight-for-age indicator<br />
Table 2 displays the mean value of weight-for-age Z<br />
scores and the prevalence of underweight (< –2 SD<br />
weight-for-age). In general, the mean weight-for-age<br />
Z score for both boys and girls indicated that the<br />
nutritional status of private schoolchildren was better<br />
than that of public schoolchildren. The total mean<br />
values of weight-for-age Z scores of boys and girls<br />
in public schools were –0.93 and –0.84, respectively,<br />
whereas those of children in private schools were 0.24<br />
and –0.18. However, the standard deviations for all<br />
of these mean values were large. As a consequence,<br />
some children fell below –2 SD and some above 2 SD.<br />
Underweight was more prevalent among children in<br />
public schools than among those in private schools.<br />
TABLE 1. Weight and height of children according to age, sex, and type of school<br />
Mean ± SD Mean ± SD<br />
Age and sex School n weight (kg) height (cm)<br />
8 yr<br />
Male Public 162 <strong>23</strong>.43 ± 5.20 124.20 ± 6.33<br />
Private 73 27.09 ± 7.63 127.12 ± 7.21<br />
Both types <strong>23</strong>5 24.57 ± 6.22 125.11 ± 6.74<br />
Female Public 164 <strong>23</strong>.40 ± 4.86 1<strong>23</strong>.20 ± 5.86<br />
Private 76 25.94 ± 7.36 125.95 ± 6.51<br />
Both types 240 24.20 ± 5.87 124.07 ± 6.51<br />
9 yr<br />
Male Public 152 25.03 ± 5.39 127.08 ± 5.79<br />
Private 75 31.21 ± 9.83 132.30 ± 7.79<br />
Both types 227 27.07 ± 7.72 128.80 ± 8.12<br />
Female Public 159 24.01 ± 3.94 125.90 ± 8.12<br />
Private 75 27.56 ± 6.44 131.13 ± 7.54<br />
Both types <strong>23</strong>4 25.14 ± 5.15 127.58 ± 8.29<br />
10 yr<br />
Male Public 159 26.34 ± 4.87 131.80 ± 8.50<br />
Private 66 34.50 ± 12.04 136.06 ± 7.87<br />
Both types 225 28.73 ± 8.52 133.05 ± 8.53<br />
Female Public 135 27.89 ± 6.15 133.12 ± 7.63<br />
Private 71 33.25 ± 8.29 137.9 ± 8.24<br />
Both types 206 29.74 ± 7.39 134.52 ± 8.06


