The epidemiology of good nutritional status among children - BVSDE
The epidemiology of good nutritional status among children - BVSDE
The epidemiology of good nutritional status among children - BVSDE

Create successful ePaper yourself
Turn your PDF publications into a flip-book with our unique Google optimized e-Paper software.
314<br />
JA Pryer et al.<br />
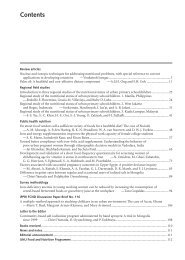
Table 2 Mother’s and father’s characteristics and other variables by worse (HAZ ,22) and better<br />
(HAZ .22) <strong>nutritional</strong> <strong>status</strong> in <strong>children</strong><br />
Worse (n ¼ 266) Better (n ¼ 126)<br />
Variable n (%) n (%) x 2 P-value<br />
Mother’s age (years)<br />
17–21 67 (25) 26 (20) 5.252 0.154<br />
22–24 60 (22) 20 (15)<br />
25–29 68 (26) 44 (34)<br />
30–50 71 (27) 32 (25)<br />
Mother’s height (cm)<br />
135.2–144.9 71 (26) 19 (15) 10.082 0.018<br />
145–148.9 68 (25) 26 (20)<br />
149–151.9 57 (21) 35 (28)<br />
152–166 57 (21) 38 (30)<br />
Mother’s weight (kg)<br />
28.8–37 73 (27) 20 (16) 9.5417 0.023<br />
37.1–40.9 57 (21) 35 (28)<br />
41–44.9 64 (24) 25 (20)<br />
45–60 54 (20) 36 (29)<br />
Mother’s home days <strong>of</strong>f due to disabling illness<br />
0–1 190 (71) 70 (55) 8.5619 0.031<br />
2–10 63 (23) 45 (35)<br />
11–28 13 (4) 11 (8)<br />
Mother’s educational level<br />
No schooling 166 (62) 80 (70) 0.4368 0.979<br />
1 year <strong>of</strong> schooling 3 (3) 3 (3)<br />
2–3 years <strong>of</strong> schooling 3 (3) 2 (2)<br />
3–5 years <strong>of</strong> schooling 55 (22) 23 (20)<br />
6 þ years <strong>of</strong> schooling 12 (5) 6 (5)<br />
Area <strong>of</strong> residence<br />
Agargoan 121 (45) 64 (51) 9.1993 0.027<br />
Central Mohammadpur 88 (33) 50 (39)<br />
Beri Badh 52 (12) 12 (9)<br />
Head <strong>of</strong> household’s gender<br />
Male 252 (94) 104 (83) 7.7501 0.049<br />
Female 14 (5) 20 (16)<br />
Financial <strong>status</strong> (last month)<br />
Very short <strong>of</strong> money 85 (32) 29 (23) 5.6142 0.132<br />
Short <strong>of</strong> money 82 (31) 36 (29)<br />
Broke even 88 (33) 52 (41)<br />
Surplus money 11 (4) 9 (7)<br />
Father’s work days <strong>of</strong>f due to illness<br />
0 76 (29) 26 (21) 7.850 0.0474<br />
1–30 190 (71) 100 (79)<br />
Head <strong>of</strong> household’s occupation<br />
Regular salaried worker 13 (4) 10 (7) 7.4964 0.186<br />
Casual wage worker (skilled) 21 (7) 14 (11)<br />
Casual wage worker (unskilled) 39 (14) 8 (6)<br />
Dependent self-employed 65 (24) 29 (23)<br />
Self-employed 103 (38) 49 (39)<br />
Family worker (unpaid) 3 (1) 2 (1)<br />
HAZ – height-for-age Z-score.<br />
higher <strong>nutritional</strong> <strong>status</strong> was less likely to be <strong>good</strong>). In a<br />
previous analysis examining ‘negative deviance’ (HAZ<br />
#23 as dependent variable), families with malnourished<br />
<strong>children</strong> reported a deficit financial situation, although no<br />
relationship was demonstrated with food expenditure or<br />
savings 17 .<br />
Pryer previously used cluster analysis to identify<br />
livelihood groups in this population 17 . Twenty per cent<br />
<strong>of</strong> households in the richest group lost labour days,<br />
compared with 44% in the poorest group. In the poorest<br />
group income lost amounted to 30% <strong>of</strong> household income,<br />
and in the richest group around 11% <strong>of</strong> income. Mother’s<br />
illness resulted in 5 days at home in the poorest group, and<br />
3 days in the richest group 17 . In this analysis, number <strong>of</strong><br />
father’s days <strong>of</strong>f due to illness was negatively related to<br />
better <strong>nutritional</strong> <strong>status</strong>. We suggest that this might be<br />
indicative <strong>of</strong> an important link between father’s illness and<br />
household income. Interestingly, mother’s home days <strong>of</strong>f<br />
due to illness was significantly related to better <strong>nutritional</strong><br />
<strong>status</strong> in our logistic regression model. <strong>The</strong> reasons for this<br />
are not known. In previous analyses to examine ‘negative<br />
deviance’ (HAZ #23), neither father’s work days <strong>of</strong>f due