- Page 1 and 2: APPENDIX B FINAL 2008 BIOLOGICAL SU
- Page 4: FINAL 2008 BIOLOGICAL SURVEYS OF LO
- Page 7 and 8: Table of Contents 3.4.3 Summary of
- Page 9: Table of Contents 8.2.1 Aerial Phot
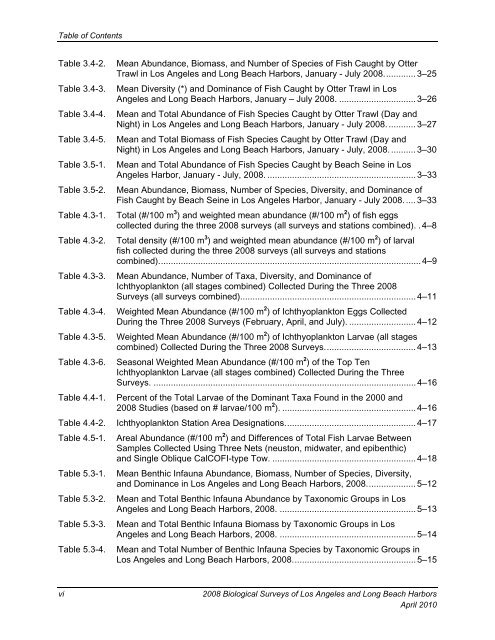
- Page 13 and 14: Table of Contents Table 8.3-3. Tabl
- Page 15 and 16: Table of Contents Figure 6.2-1. Rip
- Page 17 and 18: Table of Contents This page intenti
- Page 19 and 20: Executive Summary otter trawls to s
- Page 21 and 22: Executive Summary Van Veen) and ana
- Page 23 and 24: Executive Summary which was collect
- Page 26 and 27: 1.0 Introduction 1.0 INTRODUCTION T
- Page 28 and 29: 1.0 Introduction 1.4 STUDY OBJECTIV
- Page 30 and 31: 1.0 Introduction Historical compari
- Page 32 and 33: 1.0 Introduction Figure 1.1-2. Map
- Page 34: CHAPTER 2 WATER QUALITY
- Page 37 and 38: 2.0 Water Quality The CTD was deplo
- Page 39 and 40: 2.0 Water Quality Outer Harbor area
- Page 41 and 42: 2.0 Water Quality Table 2.2-1. Wate
- Page 43 and 44: 2.0 Water Quality Table 2.3-1. Wate
- Page 45 and 46: 2.0 Water Quality Table 2.3-1. Wate
- Page 47 and 48: 2.0 Water Quality Figure 2.2-1. Wat
- Page 49 and 50: 2.0 Water Quality This page intenti
- Page 52 and 53: 3.0 Adult and Juvenile Fishes 3.0 A
- Page 54 and 55: 3.0 Adult and Juvenile Fishes speci
- Page 56 and 57: 3.0 Adult and Juvenile Fishes and b
- Page 58 and 59: 3.0 Adult and Juvenile Fishes sampl
- Page 60 and 61:
3.0 Adult and Juvenile Fishes No si
- Page 62 and 63:
3.0 Adult and Juvenile Fishes croak
- Page 64 and 65:
3.0 Adult and Juvenile Fishes gobie
- Page 66 and 67:
3.0 Adult and Juvenile Fishes Table
- Page 68 and 69:
3.0 Adult and Juvenile Fishes Table
- Page 70 and 71:
3.0 Adult and Juvenile Fishes Table
- Page 72 and 73:
3.0 Adult and Juvenile Fishes Table
- Page 74 and 75:
3.0 Adult and Juvenile Fishes Table
- Page 76 and 77:
3.0 Adult and Juvenile Fishes Table
- Page 78 and 79:
3.0 Adult and Juvenile Fishes Table
- Page 80 and 81:
3.0 Adult and Juvenile Fishes Table
- Page 82 and 83:
3.0 Adult and Juvenile Fishes Table
- Page 84 and 85:
3.0 Adult and Juvenile Fishes Table
- Page 86 and 87:
3.0 Adult and Juvenile Fishes Figur
- Page 88 and 89:
3.0 Adult and Juvenile Fishes Figur
- Page 90 and 91:
3.0 Adult and Juvenile Fishes Figur
- Page 92:
CHAPTER 4 ICHTHYOPLANKTON
- Page 95 and 96:
4.0 Ichthyoplankton studies (Horn a
- Page 97 and 98:
4.0 Ichthyoplankton more likely to
- Page 99 and 100:
4.0 Ichthyoplankton The results of
- Page 101 and 102:
4.0 Ichthyoplankton Table 4.3-1. To
- Page 103 and 104:
4.0 Ichthyoplankton Table 4.3-2. To
- Page 105 and 106:
4.0 Ichthyoplankton Table 4.3-4. We
- Page 107 and 108:
4.0 Ichthyoplankton Table 4.3-5. We
- Page 109 and 110:
4.0 Ichthyoplankton Table 4.3-6. Se
- Page 111 and 112:
4.0 Ichthyoplankton Table 4.5-1. Ar
- Page 113 and 114:
4.0 Ichthyoplankton LA05 LA14 2D St
- Page 116 and 117:
5.0 Benthic and Epibenthic Inverteb
- Page 118 and 119:
5.0 Benthic and Epibenthic Inverteb
- Page 120 and 121:
5.0 Benthic and Epibenthic Inverteb
- Page 122 and 123:
5.0 Benthic and Epibenthic Inverteb
- Page 124 and 125:
5.0 Benthic and Epibenthic Inverteb
- Page 126 and 127:
5.0 Benthic and Epibenthic Inverteb
- Page 128 and 129:
5.0 Benthic and Epibenthic Inverteb
- Page 130 and 131:
5.0 Benthic and Epibenthic Inverteb
- Page 132 and 133:
5.0 Benthic and Epibenthic Inverteb
- Page 134 and 135:
5.0 Benthic and Epibenthic Inverteb
- Page 136 and 137:
5.0 Benthic and Epibenthic Inverteb
- Page 138 and 139:
5.0 Benthic and Epibenthic Inverteb
- Page 140 and 141:
5.0 Benthic and Epibenthic Inverteb
- Page 142 and 143:
5.0 Benthic and Epibenthic Inverteb
- Page 144:
CHAPTER 6 RIPRAP BIOTA
- Page 147 and 148:
6.0 Riprap Biota diver collection m
- Page 149 and 150:
6.0 Riprap Biota relatively small b
- Page 151 and 152:
6.0 Riprap Biota sea cucumber (Para
- Page 153 and 154:
6.0 Riprap Biota polychaete worms.
- Page 155 and 156:
6.0 Riprap Biota Table 6.3-1. Mean
- Page 157 and 158:
6.0 Riprap Biota Table 6.3-2. Mean
- Page 159 and 160:
6.0 Riprap Biota Table 6.3-4. Mean
- Page 161 and 162:
6.0 Riprap Biota Table 6.3-5. Mean
- Page 163 and 164:
6.0 Riprap Biota Figure 6.2-1. Ripr
- Page 166 and 167:
7.0 Kelp and Macroalgae 7.0 KELP AN
- Page 168 and 169:
7.0 Kelp and Macroalgae the laborat
- Page 170 and 171:
7.0 Kelp and Macroalgae sediment us
- Page 172 and 173:
7.0 Kelp and Macroalgae Overall, ou
- Page 174 and 175:
7.0 Kelp and Macroalgae pose a sign
- Page 176 and 177:
7.0 Kelp and Macroalgae Figure 7.2-
- Page 178 and 179:
7.0 Kelp and Macroalgae Figure 7.3-
- Page 180 and 181:
7.0 Kelp and Macroalgae Figure 7.3-
- Page 182:
CHAPTER 8 EELGRASS
- Page 185 and 186:
8.0 Eelgrass distribution of eelgra
- Page 187 and 188:
8.0 Eelgrass adjacent to most trans
- Page 189 and 190:
8.0 Eelgrass load on the plants was
- Page 191 and 192:
8.0 Eelgrass (Table 8.3-5), based o
- Page 193 and 194:
8.0 Eelgrass surveys. No eelgrass b
- Page 195 and 196:
8.0 Eelgrass Areas containing eelgr
- Page 197 and 198:
8.0 Eelgrass Seasonal patterns amon
- Page 199 and 200:
8.0 Eelgrass 2002) inferred that th
- Page 201 and 202:
8.0 Eelgrass Table 8.3-2. Spring 20
- Page 203 and 204:
8.0 Eelgrass Table 8.3-4. Fall 2008
- Page 205 and 206:
8.0 Eelgrass Table 8.3-6. Fall 2008
- Page 207 and 208:
8.0 Eelgrass Table 8.3-8. Fall 2008
- Page 209 and 210:
8.0 Eelgrass Table 8.3-12. Oceanic
- Page 211 and 212:
8.0 Eelgrass Figure 8.3-2. Eelgrass
- Page 213 and 214:
8.0 Eelgrass Figure 8.3-4. Eelgrass
- Page 215 and 216:
8.0 Eelgrass Figure 8.3-6. Spatial
- Page 217 and 218:
8.0 Eelgrass Figure 8.3-8. Eelgrass
- Page 220 and 221:
9.0 Birds 9.0 BIRDS 9.1 INTRODUCTIO
- Page 222 and 223:
9.0 Birds changes in species number
- Page 224 and 225:
9.0 Birds the Brown Pelican populat
- Page 226 and 227:
9.0 Birds 9.4.2.10 9.4.2.11 9.4.2.1
- Page 228 and 229:
9.0 Birds 9.5.1 Distribution and Ab
- Page 230 and 231:
9.0 Birds discussed in Section 9.4.
- Page 232 and 233:
9.0 Birds Angeles Harbor. The relat
- Page 234 and 235:
9.0 Birds Table 9.4-1. Percent Comp
- Page 236 and 237:
9.0 Birds Table 9.4-3. Nest Numbers
- Page 238 and 239:
9.0 Birds Table 9.5-2. Species Comp
- Page 240 and 241:
9.0 Birds Table 9.5-4. Percent Comp
- Page 242 and 243:
9.0 Birds Table 9.6-1. Historical C
- Page 244 and 245:
9.0 Birds 70 12000 60 10000 50 40 3
- Page 246 and 247:
9.0 Birds 3500 shallow water sandy
- Page 248 and 249:
9.0 Birds 40 35 30 riprap aerial Nu
- Page 250 and 251:
9.0 Birds Number Observed 3500 3000
- Page 252 and 253:
9.0 Birds Figure 9.5-1. Total numbe
- Page 254 and 255:
9.0 Birds Number of Individuals 400
- Page 256 and 257:
9.0 Birds 7000 Mean Number of Indiv
- Page 258:
CHAPTER 10 MARINE MAMMALS
- Page 261 and 262:
10.0 Marine Mammals Gray whales dif
- Page 263 and 264:
10.0 Marine Mammals This page inten
- Page 266 and 267:
11.0 References 11.0 REFERENCES Abb
- Page 268 and 269:
11.0 References Dennison, W.C. and
- Page 270 and 271:
11.0 References Jacques, D.L., C.S.
- Page 272 and 273:
11.0 References North, W.J. 1983. S
- Page 274:
APPENDIX A STATION LOCATIONS
- Page 277 and 278:
Appendix A Station Coordinates (NAD
- Page 280 and 281:
Appendix B (A) Temperature (°C), S
- Page 282 and 283:
Appendix B (A) Temperature (°C), S
- Page 284 and 285:
Appendix B (A) Temperature (°C), S
- Page 286 and 287:
Appendix B (A) Temperature (°C), S
- Page 288 and 289:
Appendix B (A) Temperature (°C), S
- Page 290 and 291:
Appendix B (A) Temperature (°C), S
- Page 292 and 293:
Appendix B (A) Temperature (°C), S
- Page 294 and 295:
Appendix B (A) Temperature (°C), S
- Page 296 and 297:
Appendix B (A) Temperature (°C), S
- Page 298 and 299:
Appendix B (A) Temperature (°C), S
- Page 300 and 301:
Appendix B (A) Temperature (°C), S
- Page 302 and 303:
Appendix B (A) Temperature (°C), S
- Page 304 and 305:
Appendix B (A) Temperature (°C), S
- Page 306 and 307:
Appendix B (A) Temperature (°C), S
- Page 308 and 309:
Appendix B (A) Temperature (°C), S
- Page 310:
APPENDIX C FISHES
- Page 313 and 314:
Appendix C Table C-1. Combined Fish
- Page 315 and 316:
Appendix C LA01 LA02 LA03 LA04 LA05
- Page 317 and 318:
Appendix C Table C-3. Otter Trawl C
- Page 319 and 320:
Appendix C LA01 LA02 LA03 LA04 LA05
- Page 321 and 322:
Appendix C LA01 LA02 LA03 LA04 LA05
- Page 323 and 324:
Appendix C Table C-5. Otter Trawl B
- Page 325 and 326:
Appendix C LA01 LA02 LA03 LA04 LA05
- Page 327 and 328:
Appendix C LA01 LA02 LA03 LA04 LA05
- Page 329 and 330:
Appendix C Table C-7. Otter Trawl B
- Page 331 and 332:
Appendix C Table C-8. Lampara Catch
- Page 333 and 334:
Appendix C Table C-10. Lampara Catc
- Page 335 and 336:
Appendix C Scientific Name Table C-
- Page 337 and 338:
Appendix C Table C-14. Beach Seine
- Page 340 and 341:
Appendix D Table D-1. Ichthyoplankt
- Page 342 and 343:
Appendix D fish eggs (undeveloped)
- Page 344 and 345:
Appendix D fish eggs unid. unidenti
- Page 346 and 347:
fish eggs unid. unidentified fish e
- Page 348 and 349:
Appendix D Eggs Oligocottus / Clino
- Page 350 and 351:
Appendix D Eggs Rhinogobiops nichol
- Page 352 and 353:
Appendix D Juvenile Eggs Heterostic
- Page 354 and 355:
Appendix D Eggs Liparis spp. snailf
- Page 356 and 357:
Appendix D Juvenile Eggs Heterostic
- Page 358 and 359:
Appendix D Table D-11. Ichthyoplank
- Page 360:
APPENDIX E INFAUNA
- Page 363 and 364:
Appendix E Taxon LA-1 LA-10 LA-11 L
- Page 365 and 366:
Appendix E Taxon LA-1 LA-10 LA-11 L
- Page 367 and 368:
Appendix E Taxon LA-1 LA-10 LA-11 L
- Page 369 and 370:
Appendix E Taxon LA-1 LA-10 LA-11 L
- Page 371 and 372:
Appendix E Taxon LA-1 LA-10 LA-11 L
- Page 373 and 374:
Appendix E Protothaca laciniata Tax
- Page 375 and 376:
Appendix E Taxon LA-1 LA-10 LA-11 L
- Page 377 and 378:
Appendix E Taxon LA-1 LA-10 LA-11 L
- Page 379 and 380:
Appendix E Taxon LA1 LA2 LA3 LA4 LA
- Page 381 and 382:
Appendix E Table E-4. Otter Trawl,
- Page 383 and 384:
Appendix E Taxon LA1 LA2 LA3 LA4 LA
- Page 385 and 386:
Appendix E Octopus sp. 1 Philine sp
- Page 387 and 388:
Appendix E This page intentionally
- Page 390 and 391:
Appendix F Table F-1. Total Abundan
- Page 392 and 393:
Appendix F LARR-1 LARR-2 LARR-3 LAR
- Page 394 and 395:
Appendix F LARR-1 LARR-2 LARR-3 LAR
- Page 396 and 397:
Appendix F LARR-1 LARR-2 LARR-3 LAR
- Page 398 and 399:
Appendix F LARR-1 LARR-2 LARR-3 LAR
- Page 400 and 401:
Appendix F LARR-1 LARR-2 LARR-3 LAR
- Page 402 and 403:
Appendix F LARR-1 LARR-2 LARR-3 LAR
- Page 404 and 405:
Appendix F LARR-1 LARR-2 LARR-3 LAR
- Page 406 and 407:
Appendix F LARR-1 LARR-2 LARR-3 LAR
- Page 408 and 409:
Appendix F LARR-1 LARR-2 LARR-3 LAR
- Page 410:
APPENDIX G KELP AND MACROALGAE
- Page 413 and 414:
Appendix G Date Survey Site Observe
- Page 415 and 416:
Appendix G Date Survey Site Observe
- Page 417 and 418:
Appendix G Date Survey Site Observe
- Page 419 and 420:
Appendix G Date Survey Site Observe
- Page 421 and 422:
Appendix G Date Survey Site Observe
- Page 423 and 424:
Appendix G Date Survey Site Observe
- Page 425 and 426:
Appendix G Date Survey Site Observe
- Page 427 and 428:
Appendix G Date Survey Site Observe
- Page 429 and 430:
Appendix G Date Survey Site Observe
- Page 431 and 432:
Appendix G Species T1 T2 T3 T4 T5 T
- Page 434 and 435:
Appendix H APPENDIX H-1 AVIAN ECOLO
- Page 436 and 437:
Appendix H Table H-1. Avian Ecologi
- Page 438 and 439:
Appendix H GUILD 8 - UPLAND BIRDS G
- Page 440 and 441:
Appendix H APPENDIX H-2 NUMBER OF I
- Page 442 and 443:
Appendix H Table H-2. December A 20
- Page 444 and 445:
Appendix H Table H-3. December B 20
- Page 446 and 447:
Appendix H Table H-4. January A 200
- Page 448 and 449:
Appendix H Table H-5. January B 200
- Page 450 and 451:
Appendix H Table H-6. February A 20
- Page 452 and 453:
Appendix H Table H-7. February B 20
- Page 454 and 455:
Appendix H Table H-8. March A 2008
- Page 456 and 457:
Appendix H Table H-9. March B 2008
- Page 458 and 459:
Appendix H Table H-10. April A 2008
- Page 460 and 461:
Appendix H Table H-11. May A 2008 S
- Page 462 and 463:
Appendix H Table H-13. July A 2008
- Page 464 and 465:
Appendix H Table H-15. August B 200
- Page 466 and 467:
Appendix H Table H-16. September A
- Page 468 and 469:
Appendix H Table H-17. September B
- Page 470 and 471:
Appendix H Species Totals Zones 1 2
- Page 472 and 473:
Appendix H Species Totals Zones 1 2
- Page 474 and 475:
Appendix H Zones Species Totals 1 2
- Page 476 and 477:
Appendix H Zones Species Totals 1 2
- Page 478 and 479:
Appendix H Date ELEGANT TERN — OB
- Page 480:
APPENDIX I MARINE MAMMALS
- Page 483 and 484:
Appendix I Common Survey Station/ N
- Page 485 and 486:
Appendix I Common Name Survey Type
- Page 487 and 488:
Appendix I Common Name Survey Type
- Page 489 and 490:
Appendix I Common Name Survey Type
- Page 491 and 492:
Appendix I Common Name Survey Type
- Page 493:
Appendix I This page intentionally


