96-DETC / DTM-1610

You also want an ePaper? Increase the reach of your titles
YUMPU automatically turns print PDFs into web optimized ePapers that Google loves.
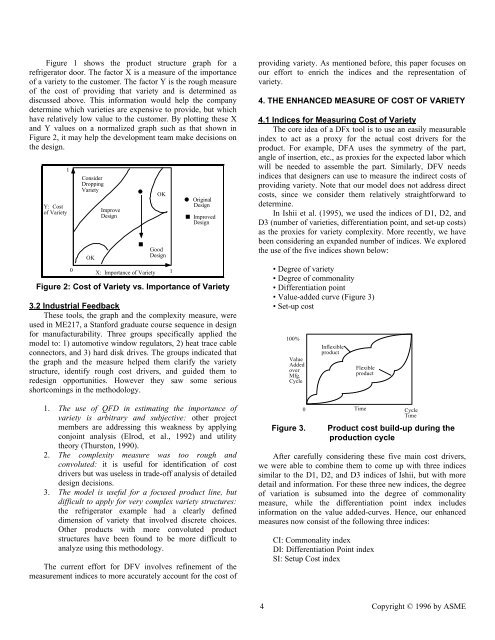
Figure 1 shows the product structure graph for a<br />
refrigerator door. The factor X is a measure of the importance<br />
of a variety to the customer. The factor Y is the rough measure<br />
of the cost of providing that variety and is determined as<br />
discussed above. This information would help the company<br />
determine which varieties are expensive to provide, but which<br />
have relatively low value to the customer. By plotting these X<br />
and Y values on a normalized graph such as that shown in<br />
Figure 2, it may help the development team make decisions on<br />
the design.<br />
1<br />
Y: Cost<br />
of Variety<br />
Consider<br />
Dropping<br />
Variety<br />
OK<br />
Improve<br />
Design<br />
●<br />
■<br />
OK<br />
Good<br />
Design<br />
0<br />
X: Importance of Variety 1<br />
● Original<br />
Design<br />
■ Improved<br />
Design<br />
Figure 2: Cost of Variety vs. Importance of Variety<br />
3.2 Industrial Feedback<br />
These tools, the graph and the complexity measure, were<br />
used in ME217, a Stanford graduate course sequence in design<br />
for manufacturability. Three groups specifically applied the<br />
model to: 1) automotive window regulators, 2) heat trace cable<br />
connectors, and 3) hard disk drives. The groups indicated that<br />
the graph and the measure helped them clarify the variety<br />
structure, identify rough cost drivers, and guided them to<br />
redesign opportunities. However they saw some serious<br />
shortcomings in the methodology.<br />
1. The use of QFD in estimating the importance of<br />
variety is arbitrary and subjective: other project<br />
members are addressing this weakness by applying<br />
conjoint analysis (Elrod, et al., 1992) and utility<br />
theory (Thurston, 1990).<br />
2. The complexity measure was too rough and<br />
convoluted: it is useful for identification of cost<br />
drivers but was useless in trade-off analysis of detailed<br />
design decisions.<br />
3. The model is useful for a focused product line, but<br />
difficult to apply for very complex variety structures:<br />
the refrigerator example had a clearly defined<br />
dimension of variety that involved discrete choices.<br />
Other products with more convoluted product<br />
structures have been found to be more difficult to<br />
analyze using this methodology.<br />
The current effort for DFV involves refinement of the<br />
measurement indices to more accurately account for the cost of<br />
providing variety. As mentioned before, this paper focuses on<br />
our effort to enrich the indices and the representation of<br />
variety.<br />
4. THE ENHANCED MEASURE OF COST OF VARIETY<br />
4.1 Indices for Measuring Cost of Variety<br />
The core idea of a DFx tool is to use an easily measurable<br />
index to act as a proxy for the actual cost drivers for the<br />
product. For example, DFA uses the symmetry of the part,<br />
angle of insertion, etc., as proxies for the expected labor which<br />
will be needed to assemble the part. Similarly, DFV needs<br />
indices that designers can use to measure the indirect costs of<br />
providing variety. Note that our model does not address direct<br />
costs, since we consider them relatively straightforward to<br />
determine.<br />
In Ishii et al. (1995), we used the indices of D1, D2, and<br />
D3 (number of varieties, differentiation point, and set-up costs)<br />
as the proxies for variety complexity. More recently, we have<br />
been considering an expanded number of indices. We explored<br />
the use of the five indices shown below:<br />
• Degree of variety<br />
• Degree of commonality<br />
• Differentiation point<br />
• Value-added curve (Figure 3)<br />
• Set-up cost<br />
100%<br />
Value<br />
Added<br />
over<br />
Mfg.<br />
Cycle<br />
Figure 3.<br />
Inflexible<br />
product<br />
Flexible<br />
product<br />
0 Time<br />
Cycle<br />
Time<br />
Product cost build-up during the<br />
production cycle<br />
After carefully considering these five main cost drivers,<br />
we were able to combine them to come up with three indices<br />
similar to the D1, D2, and D3 indices of Ishii, but with more<br />
detail and information. For these three new indices, the degree<br />
of variation is subsumed into the degree of commonality<br />
measure, while the differentiation point index includes<br />
information on the value added-curves. Hence, our enhanced<br />
measures now consist of the following three indices:<br />
CI: Commonality index<br />
DI: Differentiation Point index<br />
SI: Setup Cost index<br />
4 Copyright © 19<strong>96</strong> by ASME