Northwest Trajectory Analysis Capability: A Platform for Enhancing ...
Northwest Trajectory Analysis Capability: A Platform for Enhancing ...
Northwest Trajectory Analysis Capability: A Platform for Enhancing ...

Create successful ePaper yourself
Turn your PDF publications into a flip-book with our unique Google optimized e-Paper software.
<strong>Northwest</strong> <strong>Trajectory</strong> <strong>Analysis</strong> <strong>Capability</strong>: A <strong>Plat<strong>for</strong>m</strong><br />
<strong>for</strong> <strong>Enhancing</strong> Computational Biophysics <strong>Analysis</strong><br />
Elena S. Peterson 1 , Eric G. Stephan 1 , Abbie Corrigan 1 , Roberto Lins 1 , Thereza A. Soares 1 , Randy<br />
Scarberry 2 , Stuart Rose 2 , Leigh Williams 2 , Canhai Lai 1 , Terence Critchlow 1 , T.P. Straatsma 1<br />
1 Computational Sciences & Mathematics Division, PNNL, Richland, WA, USA<br />
2 Computational & Statistical Analytics Division, PNNL, Richland, WA, USA<br />
Abstract - As computational resources continue to increase,<br />
the ability of computational simulations to effectively<br />
complement, and in some cases replace, experimentation in<br />
scientific exploration also increases. Today, large-scale<br />
simulations are recognized as an effective tool <strong>for</strong> scientific<br />
exploration in many disciplines including chemistry and<br />
biology. A natural side effect of this trend has been the need<br />
<strong>for</strong> an increasingly complex analytical environment. In this<br />
paper, we describe <strong>Northwest</strong> <strong>Trajectory</strong> <strong>Analysis</strong> <strong>Capability</strong><br />
(NTRAC), an analytical software suite developed to enhance<br />
the efficiency of computational biophysics analyses. Our<br />
strategy is to layer higher-level services and introduce<br />
improved tools within the user’s familiar environment without<br />
preventing researchers from using traditional tools and<br />
methods. Our desire is to share these experiences to serve as<br />
an example <strong>for</strong> effectively analyzing data intensive large scale<br />
simulation data.<br />
have applications outside the highly controlled laboratory<br />
setting. The successful usage of this technology relies on the<br />
molecular level understanding of the factors behind the<br />
stability of Top7. This can be, in principle, achieved by<br />
per<strong>for</strong>ming a wide array of simulations of several protein<br />
variants under a variety of physico-chemical conditions (pH,<br />
temperature, ionic strength). However, to manage and analyze<br />
the several TB of generated data would be rather challenging<br />
by traditional means.<br />
Keywords: Data Management, Computation Biology<br />
Software, Molecular Dynamics, Data Intensive Computing.<br />
1 Introduction<br />
The Data Intensive Computing <strong>for</strong> Complex Biological<br />
Systems (DICCBS) project, at Pacific <strong>Northwest</strong> National<br />
Laboratory (PNNL) and Oak Ridge National Laboratory<br />
(ORNL), per<strong>for</strong>ms leading-edge computational biology and<br />
computational chemistry with the goal of improving the<br />
understanding of complex protein interactions [1]. Scientists<br />
on this project make extensive use of several highper<strong>for</strong>mance<br />
computational tools including: NWChem [2], a<br />
complex, parallel computational chemistry/biophysics<br />
simulation code; and DIAna [3], a parallel data analysis tool.<br />
For example, some of the scientific research that has already<br />
benefited from this infrastructure resulted in the design of a<br />
protein-based scaffold with potential application as biosensors<br />
<strong>for</strong> in vitro diagnostics of diseases and environmental<br />
pollutants. As scaffold, scientists at PNNL have used the<br />
computationally designed protein Top7 [4] [5]. Because the<br />
Top7-based scaffold exhibits an unusual stability at extreme<br />
temperature and chemical conditions, these biosensors will<br />
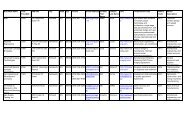
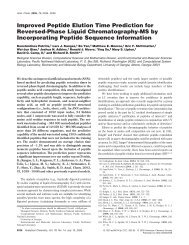
Figure 1. The three-dimensional structure of the Top7-<br />
based scaffold. Residues in stick correspond to the new<br />
sequence inserted in the original Top7 protein.<br />
While the data files produced in this experiment are not<br />
particularly large by today’s standards, the overall collection<br />
of simulation and analysis results is significant. The problem<br />
deepens if comparative analysis involving different<br />
simulations are necessary to answer a specific scientific<br />
question. Also the analytic tools require a large set of specific<br />
inputs and produce a complicated set of results data. An<br />
efficient method <strong>for</strong> handling the data and results involved in<br />
this paradigm is required [6]. This includes the ability to<br />
search <strong>for</strong> input data and results data based on metadata about<br />
the simulation as well as general provenance in<strong>for</strong>mation<br />
about the setup and running of each simulation (i.e. who ran<br />
it, when it was ran, general input parameters, etc). The ability<br />
to tie all this together in a tool suite allows the researchers to<br />
work in one environment that meets their exact needs.
2 Background and Approach<br />
Our goal was to develop an analytical environment to<br />
increase the efficiency of large scale data analyses without<br />
being intrusive to the scientist’s analytical approach. Our first<br />
task was to discover how the scientists per<strong>for</strong>med their<br />
analysis. In our initial requirements investigation we<br />
discovered researchers relied upon many command line tools<br />
and visualization tools that they had grown accustomed to, but<br />
turned out to be inefficient and cumbersome. The<br />
inefficiencies of their process and tools didn’t create problems<br />
until they started on larger scale data analysis which required<br />
dealing with larger data and other collaborators. This<br />
generated some new requirements:<br />
• Search capabilities: Scientists could no longer store<br />
simulations on local disk. The scientists required a<br />
more sophisticated means to store the simulations<br />
without needing to track the simulations by hand or<br />
continually download hundreds of gigabytes of files<br />
to search through their results.<br />
• Data conversion/visualization tools: Various<br />
visualization tools were used by scientists but each<br />
had their own data <strong>for</strong>matting requirements. The<br />
scientists would have to remember which tool could<br />
graph which type of analysis file and then convert<br />
their data to that tool’s particular <strong>for</strong>mat.<br />
• Data Management/Archive: As stated earlier, there<br />
was too much data to manage on local disks so a long<br />
term storage system was needed. Along with storing<br />
the data they wanted to be able to share it with their<br />
collaborators.<br />
Based on the requirements analysis it was abundantly clear<br />
that in order <strong>for</strong> NTRAC to be useful it had to dovetail high<br />
level capabilities into the existing infrastructure and<br />
capabilities. Our motivation was in part focused on seeking<br />
early adoption to address user needs immediately because we<br />
knew scientists were ultimately more interested in<br />
accomplishing their science than waiting <strong>for</strong> an end-to-end<br />
solution.<br />
With this rationale we designed a solution that provided<br />
users multiple access levels. On one level is a suite of<br />
advanced client side analytical capabilities and data<br />
management tools. On another level, however, the scientists<br />
use traditional methods to directly store and retrieve data. We<br />
also gave users the ability to mix and match the advanced<br />
capabilities with traditional methods. An example of this was<br />
allowing users to have full access to the analytical tools<br />
without the GUI.<br />
For scientists wanting to use traditional methods NTRAC<br />
imposed little impact. These users would be requested to<br />
share their data in an archive shared area, rather than store it<br />
locally. For scientists having more demanding needs such as<br />
searches and visualization they could take advantage of the<br />
new tools. We made our approach generic enough to allow<br />
our new tools to be plugged into any underlying archive<br />
infrastructure.<br />
Based on these requirements we developed a preliminary<br />
design that included user interface mockups, application<br />
interfaces, and example visualizations. The requirements<br />
analysis, preliminary design, and extensive user interviews<br />
provided us with a basis to develop a system that was<br />
applicable to the users needs and unobtrusive in its<br />
implementation. Because many of the software components<br />
to be developed were not directly dependent on each we were<br />
able to design and implement them in parallel. This allowed<br />
us to get prototypes into the users hands quickly.<br />
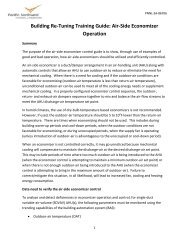
3 Architecture<br />
There are three main parts to the overall architecture of our<br />
system all three of which are both integrated and can be used<br />
alone. First is the user interface tool suite that allows the users<br />
to search <strong>for</strong> simulation files, launch the analysis tool(s), and<br />
visualize the outputs of that analysis. Then there is the data<br />
storage and movement architecture, and finally the metadata<br />
[7] services architecture.<br />
HPC<br />
NWChem<br />
Archive<br />
Tool<br />
Archive<br />
D<br />
I<br />
A<br />
N<br />
A<br />
Simulations<br />
Simulations<br />
Simulations<br />
Input Deck<br />
Local Disk<br />
Harvester<br />
NTRAC Central<br />
SQL<br />
Launch<br />
Viz<br />
Search<br />
JDBC<br />
Metadata<br />
Figure 2. NTRAC Architecture depicting data flow from<br />
simulation to storage and to user analysis.<br />
3.1 NTRAC Central – User Environment<br />
For integrated analysis capabilities we designed a client that<br />
provided an intuitive user interface <strong>for</strong> the scientists to work<br />
in. Scientists could use this tool exclusively to search <strong>for</strong> all<br />
or part of archived NWChem simulations, to launch DIAna to<br />
analyze the simulation results, and to visualize the analysis<br />
results.<br />
The NTRAC workflow typically begins with the search<br />
capability. Queries to select simulations <strong>for</strong> DIAna analysis<br />
are per<strong>for</strong>med using a simple database call to the metadata<br />
repository (described below). Search criteria can include<br />
selections about the simulation run itself (e.g. scientist name,
simulation name, system type, method, and status) or<br />
properties of the simulation. The query results are presented<br />
to the user through a table/excel like interface and they can<br />
sort and subset from there.<br />
Once a set of simulations is chosen, those files are<br />
downloaded to the local machine through the same protocols<br />
described below as the archive tool. The user can then use the<br />
DIAna input tool to select their input deck to the analysis tool.<br />
DIAna is a complex analysis tool written in Fortran 90.<br />
Analyses are carried out using an input deck describing the<br />
required analyses and proper inputs. The <strong>for</strong>mat of the file<br />
requires extensive knowledge of DIAna and the kind of<br />
analyses a user wants to carry out. As a result <strong>for</strong>matting an<br />
input file correctly was quite difficult even to the expert users.<br />
To make DIAna more usable and robust, the user interface<br />
guarantees the scientist that the input file created is well<br />
<strong>for</strong>med and will provide the results requested. Once the initial<br />
input is created users have the option of fine tuning their input<br />
prior to analysis by editing the file directly from the user<br />
interface. This accomplished two objectives, creating a sense<br />
of trust with the scientists – they could see exactly what the<br />
user interface was producing, and because the DIAna tool is<br />
changing rapidly they could make edits/additions without<br />
waiting <strong>for</strong> an update to the user interface.<br />
Once the DIAna analysis is successfully completed we<br />
provide a rich set of graphing tools to visualize the results. As<br />
a foundation <strong>for</strong> our visualization environment we<br />
incorporated the JGraph [8] open source software to support<br />
the ability to provide various types of graphs given one set of<br />
inputs. To handle the numerous output <strong>for</strong>mats we created a<br />
generic parser structure that requires only a few minor changes<br />
to produce a new type of visualization. As well, the various<br />
visualization screens all have similar behavior and look and<br />
feel.<br />
To support persistence in user sessions we created a<br />
“context” file that tracks the state of the tools so that a user<br />
isn’t constrained to per<strong>for</strong>ming all of their analysis in one<br />
execution of the client.<br />
3.2 Data Management Tools<br />
In order to move beyond the initial ad hoc data management<br />
approach used by our scientists, we needed to address the<br />
major underlying issues that gave rise to it: the system<br />
administrators <strong>for</strong> each computational and storage resources<br />
were balancing different and conflicting requirements <strong>for</strong><br />
these resources. As a result, each cluster and archive had its<br />
own management policy and configuration, making it<br />
extremely difficult to provide consistent capabilities across the<br />
computation environment utilized by scientists. The original<br />
policies were so diverse it wasn’t always easy to know that the<br />
best data transfer method was being chosen. Lacking a<br />
ubiquitous data transfer capability, scientists ended up using<br />
only a subset of the available resources and thus were unable<br />
to take full advantage of the available capabilities.<br />
To create that ubiquitous data transfer capability meant<br />
having a single tool that would pick the most efficient transfer<br />
method. We wrote a light-weight copy script in Python that<br />
works the same on all compute nodes. This script relies upon a<br />
protocol registry database that describes how available<br />
computational resources talk to each other. Using a data<br />
driven approach <strong>for</strong> determining the best method of data<br />
transfer rather than hardwiring a solution has given us the<br />
flexibility to dynamically alter data transfer strategies. Based<br />
on the selected protocol the script automatically builds the<br />
transfer commands and transfers the files. By masking the<br />
complexity of the environment through this script, our<br />
scientists no longer need to worry about the nuances of the<br />
underlying capabilities<br />
3.2.1 Archive<br />
For archiving we relied upon the PNNL’s Environmental<br />
Molecular Science’s Laboratory (EMSL) [9] 300 terabyte<br />
archive, NWfs. NWfs was created as a long term storage<br />
system but not necessarily as a data repository and definitely<br />
not <strong>for</strong> data sharing. As such it is large and regularly backed<br />
up but has only minimal data management support and no onbox<br />
computation capability. We worked with the NWfs team<br />
to create a solution by creating a “user-group”, setting<br />
permissions appropriately and adding our researchers and their<br />
collaborators to that group. This gave the researchers one<br />
place <strong>for</strong> all of their data to be shared. While this is obviously<br />
not the entire data repository solution it did help us to lay a<br />
foundation with the scientists <strong>for</strong> creating a better long term<br />
solution.<br />
3.3 Metadata Services<br />
Because of the limited access to the archive, harvesting<br />
metadata [10] similar to the way web crawlers search the web<br />
to refresh search engines was a reasonable approach. The<br />
metadata services consist of three components: an intelligent<br />
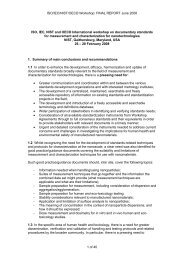
harvester, a results parser, and a metadata store.<br />
Figure 3. Examples of NTRAC Central user interface
While archiving and sharing data sets is an important data<br />
management capability, being able to efficiently identify the<br />
subset of in<strong>for</strong>mation currently of interest is critical in<br />
effectively managing the repository over time. We believe a<br />
metadata service approach, which supports complex user<br />
queries over metadata extracted from the simulation and<br />
analysis data sets, is the best way to deliver this capability.<br />
File <strong>Analysis</strong>_file <strong>Analysis</strong><br />
Simulation_file<br />
Simulation<br />
Scientist<br />
Application<br />
Simulation_Metadata<br />
<strong>Analysis</strong>_Metadata<br />
Key_Types<br />
Figure 4. Metadata service schema<br />
We have two services that obtain metadata. The first is an<br />
automatic extraction of metadata from known file types. We<br />
use the Defuddle [11] [12] parser to extract approximately 40<br />
metadata attributes from NWChem and DIAna. This service<br />
automatically crawls the archive to identify new files,<br />
determines if the file is of a known type, and if it is, extracts<br />
the metadata. The second service is built on top of the copy<br />
capability, and allows scientists to manually annotate their<br />
data through a simple GUI when they archive it. This allows<br />
us to obtain high-level in<strong>for</strong>mation, which is outside the scope<br />
of the automatically generated metadata, about the results<br />
being archived. These annotations are extremely important<br />
since they allow the simulation to be placed in the appropriate<br />
context long after the experiment was per<strong>for</strong>med.<br />
The extracted metadata is stored in the archive as a<br />
collection of self-describing XML files, one <strong>for</strong> each archive<br />
file. We also load this in<strong>for</strong>mation into a PostgresQL TM<br />
database <strong>for</strong> ease of search later on.<br />
While the use of an intermediate, self-describing, XML<br />
<strong>for</strong>mat may seem inefficient at first glance, we believe it is<br />
important to the long-term success of NTRAC. Both<br />
NWChem and DIAna are actively evolving, constantly adding<br />
new capabilities and improving existing features. XML is an<br />
extremely flexible data description <strong>for</strong>mat. This flexibility is<br />
enhanced by Defuddle code, which generates an XML<br />
representation of a file based on a declarative description of<br />
the original file <strong>for</strong>mat. As a result, we believe that this<br />
architecture will allow us to easily adapt to changes in the<br />
underlying simulation and analysis codes.<br />
4 Discussion<br />
Our development approach was to target early adopters and<br />
put discrete software capabilities into the researchers’ hands as<br />
quickly as possible. This rapid prototyping approach gave the<br />
developers early evidence about the usefulness of the tools<br />
and guided new capability development or changed the<br />
requirements to better fit the scientists’ needs.<br />
The data management developers teamed with our internal<br />
computing infrastructure to define and implement faster<br />
methods of managing the large amounts of simulation results<br />
data files that often had to be moved from the compute<br />
machines to the storage areas. We were able to replace the<br />
long and painful process with a simpler and faster one and<br />
gain the trust of our users immediately.<br />
During a three month evaluation period the value of this<br />
approach became apparent. During the early part of the<br />
evaluation period the secure copy protocol (scp) out<br />
per<strong>for</strong>med the secure file transfer protocol (SFTP) by a factor<br />
of 100%. At the end of the evaluation period sftp became<br />
inefficient and scp outper<strong>for</strong>med sftp by almost 100%. The<br />
many aspects (i.e. network configuration, firewalls, etc) that<br />
account <strong>for</strong> these results are out of our control and beyond the<br />
capability of the general scientist to understand and<br />
manipulate. This simple litmus test helps give our users a best<br />
practices approach to data transfer.<br />
To develop the metadata services we worked with users to<br />
develop a schema to support metadata collection and defined a<br />
raw data translator using Defuddle team to make configuring<br />
the metadata services completely data driven.<br />
Without a metadata service identifying data of interest<br />
requires scientists to manually identify the appropriate<br />
simulation result files, download them, and inspect their<br />
metadata to determine which data should participate in the<br />
analysis. This is an extremely time consuming and painful<br />
process. Obviously, the complexity of identifying the<br />
appropriate simulation, or set of simulations in the case of a<br />
comparative analysis, increases as the data archive grows. As<br />
a result, it is easy to overlook relevant simulations.<br />
Furthermore, the data and analysis files are intended <strong>for</strong><br />
software processing, not manual examination, and thus it is<br />
challenging to determine which datasets should be analyzed.<br />
Without using a metadata service setting up an analysis could<br />
take from days to weeks. Now with the help of the NTRAC<br />
Central search tool the metadata repository can per<strong>for</strong>m<br />
queries in milliseconds.<br />
The client tools were created to ease the process and<br />
provide support <strong>for</strong> the current workflow again without being<br />
intrusive or creating something unknown to the scientists. We<br />
were able to increase efficiency and accuracy to the overall<br />
process and gained user acceptance by providing small pieces<br />
in a timely manner.
As mentioned earlier this resource proved invaluable<br />
because now visualization and analysis were stream-lined and<br />
avoided the hours of mundane steps it took to re<strong>for</strong>mat results<br />
during analysis. This capability now enabled the scientists to<br />
see their data in a matter of minutes.<br />
5 Conclusion<br />
NTRAC proved to be a robust, cost effective solution to<br />
support computational biophysics analysis at PNNL. As the<br />
analysis tools built around NWChem evolve and become<br />
available to the scientific community at large we will also<br />
provide them with our NTRAC Central solutions.<br />
Through our experiences we found NTRAC serves as an<br />
example <strong>for</strong> ways research teams can enhance the analytical<br />
experience that data intensive applications require even while<br />
the application is evolving. Our long term vision is to apply<br />
the lessons of NTRAC to other large scale bioin<strong>for</strong>matics and<br />
computational biology problems and to incorporate leading<br />
edge research such as incorporation of scientific workflows<br />
and provenance tracking to capture data lineage, and<br />
interconnect with other biological grids.<br />
6 Acknowledgements<br />
This work was funded by the U. S. Department of Energy<br />
Office of Advanced Scientific Computing Research. PNNL is<br />
operated by Battelle <strong>for</strong> the U. S. Dept. of Energy<br />
[5] T.A. Soares; T.P. Straatsma. “Design of the Top7<br />
protein as a scaffold <strong>for</strong> antigen-binding epitopes”; Presented<br />
by Thereza Soares (Invited Speaker) at the American<br />
Chimical Society NORM, June, 2007.<br />
[6] T.P. Straatsma. “Data-intensive computing laying the<br />
foundation <strong>for</strong> biological breakthroughs”; Breakthroughs, 10,<br />
Spring 2007.<br />
[7] K. Jeffery. “Metadata: An Overview and Some Issues”;<br />
ERCIM News, 35, October 1998.<br />
[8] James S. Plank. “Jgraph – A Filter <strong>for</strong> Plotting Graphs in<br />
PostScript”; USENIX Technical Conference Proceedings,<br />
(61-66), Winter 1993.<br />
[9] Environmental Molecular Sciences Laboratory<br />
http://www.emsl.pnl.gov<br />
[10] http://lftp.yar.ru<br />
[11] B. Wu; T.D. Talbott; K.L. Schuchardt; E.G. Stephan;<br />
J.D. Myers. “Mapping Phyisical Formats to Logical Models<br />
to Extract Data and Metadata: The Defuddle Parsing<br />
Engine”; IPAW’06 Internation Provenance and Annotation<br />
Workshop, May 2006.<br />
[12] Martin Westhead, Ted Wen, Reobert Carroll.<br />
“Describing Data on the Grid”; fourth International Workshop<br />
on Grid Computing (134), 2003.<br />
7 References<br />
[1] Data-Intensive Computing <strong>for</strong> Complex Biological<br />
Science http://www.biopilot.org<br />
[2] R.A. Kendall; E. Apra; D.E. Bernholdt; E.J. Bylaska; M.<br />
Dupuis; G.I. Fann; R.J. Harrison; J. Ju; J.A. Nichols; J.<br />
Nieplocha; T.P. Straatsma; T.L. Windus; A.T. Wong. “High<br />
Per<strong>for</strong>mance Computational Chemistry: An Overview of<br />
NWChem a Distributed Parallel Application”; Computer<br />
Shys. Comm, 128, (260-283), 2000.<br />
[3] T.P. Straatsma. “Data Intesive <strong>Analysis</strong> of Biomelecular<br />
Simulations”; International Conference of Computational<br />
Methods in Sciences and Engineering, 963(2), (1379-1382),<br />
2007.<br />
[4] B. Kuhlman; G Dantas; G.C. Ireton; G. Varani; B.L.<br />
Stoddard; D. Baker. “Design of a novel globular protein fold<br />
with atomic-level accuracy”; Science, 302, (1364-1368),<br />
2003.