Biorefinery concept development based on wheat flour milling
Biorefinery concept development based on wheat flour milling
Biorefinery concept development based on wheat flour milling

Create successful ePaper yourself
Turn your PDF publications into a flip-book with our unique Google optimized e-Paper software.
<str<strong>on</strong>g>Biorefinery</str<strong>on</strong>g> <str<strong>on</strong>g>c<strong>on</strong>cept</str<strong>on</strong>g> <str<strong>on</strong>g>development</str<strong>on</strong>g> <str<strong>on</strong>g>based</str<strong>on</strong>g> <strong>on</strong> <strong>wheat</strong> <strong>flour</strong> <strong>milling</strong><br />
Douglas C. Elliott *a , Rick J. Orth a , Johnway Gao a , Todd A. Werpy a , David E. Eakin a , Andrew J.<br />
Schmidt a , Gary G. Neuenschwander a , Anth<strong>on</strong>y J. Flagg b , Jim Murry b , Lyle Lahman c , C.J. Lin c ,<br />
D<strong>on</strong>ald L. Mennel c , R<strong>on</strong> Landucci d<br />
a Pacific Northwest Nati<strong>on</strong>al Laboratory, P.O. Box 999, Richland, Washingt<strong>on</strong>, USA 99352<br />
b Pendlet<strong>on</strong> Flour Mills, LLC., P.O. Box 1427, Pendlet<strong>on</strong>, Oreg<strong>on</strong>, USA 97801<br />
c The Mennel Milling Company, P.O. Box 806, Fostoria, Ohio, USA 44830-0806<br />
d ProForma Systems, Inc., 13902 W. 20 th Place, Golden, Colorado, USA 80401-2193<br />
Abstract -- We are developing an innovative process for the recovery of a starch-rich product<br />
from millfeed, the low-value byproduct of <strong>wheat</strong> <strong>flour</strong> <strong>milling</strong>; enzymatic processing of the<br />
starch to glucose; and the subsequent processes for c<strong>on</strong>versi<strong>on</strong> of that glucose into a value-added<br />
product by either a catalytic or a fermentati<strong>on</strong> process. We have completed the <str<strong>on</strong>g>development</str<strong>on</strong>g> of<br />
the starch recovery step with enzymatic processing and the assessment of its ec<strong>on</strong>omic viability.<br />
The processes to use the glucose product as feedstock for catalytic processing and fermentati<strong>on</strong><br />
processing have been tested in the laboratory. Catalytic processing of the glucose from the<br />
extracted starch for polyol producti<strong>on</strong> is <str<strong>on</strong>g>based</str<strong>on</strong>g> <strong>on</strong> catalytic hydrogenati<strong>on</strong> to sorbitol.<br />
Alternatively, fermentati<strong>on</strong> of the extracted starch-derived glucose also provides a pathway to<br />
value-added chemical products via a platform chemical, lactic acid.<br />
The paper includes results from all the processing areas addressed. Starch extracti<strong>on</strong> and glucose<br />
generati<strong>on</strong> from <strong>wheat</strong> <strong>milling</strong> byproducts are presented with laboratory and scaled-up<br />
processing results. Results of fermentati<strong>on</strong> of the glucose product to lactic acid in shaker flask<br />
tests are presented, documenting the minimal requirements for nutrient additi<strong>on</strong>. Stirred batch<br />
reactor tests of catalytic hydrogenati<strong>on</strong> of the glucose product to sorbitol are presented with a<br />
discussi<strong>on</strong> of c<strong>on</strong>taminant effects <strong>on</strong> the catalyst.<br />
Key Words: <strong>wheat</strong>, millfeed, starch, glucose, extracti<strong>on</strong>, hydrolysis, fermentati<strong>on</strong>, hydrogenati<strong>on</strong><br />
Background<br />
Wheat is the sec<strong>on</strong>d largest agricultural commodity in the United States with a net producti<strong>on</strong> of<br />
56.1 milli<strong>on</strong> t<strong>on</strong>nes in 1995 (2.1 billi<strong>on</strong> bushels). Of that producti<strong>on</strong>, about half is exported; and<br />
of the balance, 85% is dry-milled within the U.S. to produce 17.8 milli<strong>on</strong> t<strong>on</strong>nes of <strong>flour</strong> for<br />
human food c<strong>on</strong>sumpti<strong>on</strong>. The remaining 5.9 milli<strong>on</strong> t<strong>on</strong>nes are low-value byproducts, which
are disposed as animal feed, for the most part. These byproducts, collectively referred to as<br />
millfeed, c<strong>on</strong>tain the bran, germ, and a porti<strong>on</strong> of the endosperm, which c<strong>on</strong>tains a significant<br />
amount of starch not recovered in the <strong>milling</strong> process.<br />
Millfeed is a combinati<strong>on</strong> of cellular structures and comp<strong>on</strong>ents left from the <strong>wheat</strong> kernel after<br />
the <strong>flour</strong> removal; it c<strong>on</strong>tains about 75% carbohydrate, 17% protein, 3% fat, and 5% mineral<br />
matter. Millfeed is not a single homogeneous stream but a collecti<strong>on</strong> of several streams from the<br />
process of making <strong>flour</strong>. In additi<strong>on</strong>, millfeed compositi<strong>on</strong> varies depending <strong>on</strong> the variety of<br />
<strong>wheat</strong> being processed into <strong>flour</strong>. Millfeed producti<strong>on</strong> varies slightly depending <strong>on</strong> mill<br />
operati<strong>on</strong> and variety of <strong>wheat</strong> processed. Flour extracti<strong>on</strong> ranges from 73 to 77% resulting in an<br />
average millfeed producti<strong>on</strong> of about 25% by weight of the <strong>wheat</strong> introduced to the mill.<br />
C<strong>on</strong>sidering that the <strong>wheat</strong> kernel c<strong>on</strong>tains 83% endosperm (the starchy source of white <strong>flour</strong>), it<br />
is apparent that the millfeed c<strong>on</strong>tains, in additi<strong>on</strong> to the bran, a significant porti<strong>on</strong> of the starchy<br />
endosperm. A rough calculati<strong>on</strong> suggests that millfeed is composed of up to 35% starch that<br />
originated from the endosperm.<br />
Wheat Milling Byproducts Used for Chemical Producti<strong>on</strong><br />
We are developing an innovative process for the recovery of a starch-rich product from millfeed,<br />
the low-value byproduct of <strong>wheat</strong> <strong>flour</strong> <strong>milling</strong>; enzymatic processing of the starch to glucose;<br />
and the subsequent processes for c<strong>on</strong>versi<strong>on</strong> of that glucose into a value-added product by either<br />
a catalytic or a fermentati<strong>on</strong> process. We have completed the <str<strong>on</strong>g>development</str<strong>on</strong>g> of the starch recovery<br />
step with enzymatic processing and the assessment of its ec<strong>on</strong>omic viability. The processes to<br />
use the glucose product as feedstock for catalytic processing and fermentati<strong>on</strong> processing have<br />
been tested in the laboratory. Catalytic processing of the glucose from the extracted starch for<br />
polyol producti<strong>on</strong> is <str<strong>on</strong>g>based</str<strong>on</strong>g> <strong>on</strong> catalytic hydrogenati<strong>on</strong> to sorbitol. Alternatively, fermentati<strong>on</strong> of<br />
the extracted starch-derived glucose also provides a pathway to value-added chemical products<br />
via a platform chemical, lactic acid.<br />
In either pathway to value-added products (catalytic or fermentati<strong>on</strong>), use of the residual millfeed<br />
will be an important c<strong>on</strong>siderati<strong>on</strong>. If the residual material has value as a premium animal feed,<br />
it will reduce the actual cost of the extracted starch. By extracting the starch from the millfeed,<br />
the food value of the remaining material may actually be increased by c<strong>on</strong>centrating the protein<br />
c<strong>on</strong>tent. The improved value of this starch-extracted millfeed for animal feeding has underg<strong>on</strong>e<br />
preliminary evaluati<strong>on</strong> but needs to be validated in animal feeding tests.<br />
Technical Results<br />
The paper includes results from all the processing areas addressed. Starch extracti<strong>on</strong> and glucose<br />
generati<strong>on</strong> from <strong>wheat</strong> <strong>milling</strong> byproducts are presented with laboratory and scaled-up<br />
processing results. Results of fermentati<strong>on</strong> of the glucose product to lactic acid in shaker flask<br />
tests are presented, documenting the minimal requirements for nutrient additi<strong>on</strong>. Stirred batch<br />
reactor tests of catalytic hydrogenati<strong>on</strong> of the glucose product to sorbitol are presented with a<br />
discussi<strong>on</strong> of c<strong>on</strong>taminant effects <strong>on</strong> the catalyst.
Starch Extracti<strong>on</strong> and Glucose Producti<strong>on</strong><br />
This secti<strong>on</strong> describes the results of the starch extracti<strong>on</strong> and glucose producti<strong>on</strong> process<br />
<str<strong>on</strong>g>development</str<strong>on</strong>g> phase. The primary tasks under this phase were 1) millfeed analyses, 2) benchscale<br />
testing, 3) pilot-scale testing.<br />
Wheat Millfeed Analyses: Several different <strong>wheat</strong> millfeed types and fracti<strong>on</strong>s were received for<br />
testing purposes. Five fracti<strong>on</strong>s were derived from soft red winter <strong>wheat</strong> including “midds, bran<br />
and screenings”, “midds and bran”, “red dog” (similar to midds), “bran”, and “screenings”.<br />
From four other <strong>wheat</strong> types: soft white winter, hard red winter, hard amber durum, and hard red<br />
spring, the fracti<strong>on</strong>s included millfeed stream with or without the screenings, "shorts," (similar to<br />
midds) and "bran" from each <strong>wheat</strong> type and a combined screenings sample.<br />
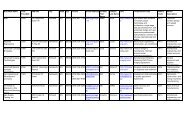
These byproduct millfeed samples were analyzed and the data are presented in Table 1.<br />
Bench-scale Testing for Process Optimizati<strong>on</strong>: The process optimizati<strong>on</strong> testing was c<strong>on</strong>ducted <strong>on</strong><br />
the bench-scale. Process optimizati<strong>on</strong> testing was c<strong>on</strong>ducted, using a systematic approach to<br />
evaluate each key-processing step in the order that it appears in the process (see Figure 1). After<br />
testing each of the individual unit operati<strong>on</strong>s, the optimized c<strong>on</strong>diti<strong>on</strong>s were then tested together<br />
to arrive at an optimized starch extracti<strong>on</strong> process.<br />
A specified amount of water was added to a 250-mL flask, and then placed in an incubator (and<br />
c<strong>on</strong>stantly shaken at 300 rpm) for heat-up to a predetermined temperature. Millfeed was then<br />
added to the 250-mL flask, and it was placed back into the incubator for a predetermined time<br />
(“initial water wash”). The millfeed slurry was then removed from the incubator and “coursed<br />
filtered” via vacuum filtrati<strong>on</strong> for 10-minutes through a 4-inch Buchner filter (no filter paper<br />
used). The filtercake from the course filtrati<strong>on</strong> was typically dried and retained for analyses.<br />
The filtrate was collected, pH-adjusted if necessary, and placed back into the incubator for heatup<br />
to a predetermined “liquefacti<strong>on</strong>” temperature. After reaching, the specified liquefacti<strong>on</strong><br />
temperature, α-amylase was added, and “liquefacti<strong>on</strong>” was initiated.<br />
Following the liquefacti<strong>on</strong> step, the incubator temperature was adjusted to a predetermined<br />
“saccharificati<strong>on</strong>” temperature and pH adjustments were made if necessary. After reaching the<br />
desired “saccharificati<strong>on</strong>” temperature, glucoamylase was added to the soluti<strong>on</strong>, and it was<br />
placed in the incubator for a specified “saccharificati<strong>on</strong>” time.<br />
Following a specified time, the product from “saccharificati<strong>on</strong>” was removed, and again filtered.<br />
This sec<strong>on</strong>d filtering operati<strong>on</strong>, termed “fine filtrati<strong>on</strong>” was c<strong>on</strong>ducted via vacuum filtrati<strong>on</strong> for<br />
10-minutes, using a 4-inch Buchner funnel with Whatman #4 filter paper. Following “fine<br />
filtrati<strong>on</strong>”, the filtercake was typically dried and retained for analyses. The filtrate from the “fine<br />
filtrati<strong>on</strong>” step was also collected for analytical purposes. All of the optimizati<strong>on</strong> testing was<br />
c<strong>on</strong>ducted using “soft white winter all inclusive without screenings” millfeed”.
Table 1. Analytical Results of Wheat Millfeeds.<br />
Comp<strong>on</strong>ent C<strong>on</strong>centrati<strong>on</strong> (wt%)<br />
Moisture Ash Carb<strong>on</strong> Hydrogen Nitrogen Protein (a) Fat NDF (b) Starch (c)<br />
Millfeed Type<br />
Soft Red Winter<br />
Midds, Bran &<br />
Screenings<br />
11.2,<br />
11.6<br />
5.23,<br />
5.08<br />
45.7 6.12 2.71,<br />
2.82<br />
16.9,<br />
17.6<br />
3.64 39.2 33.5,<br />
34.6<br />
Midds & Bran 11.0,<br />
10.9<br />
5.36,<br />
5.49<br />
45.3 6.36 2.88,<br />
2.86<br />
18.0,<br />
17.9<br />
3.95 41.7 29.8,<br />
31.1<br />
Red Dog 9.77,<br />
9.72<br />
3.70,<br />
3.73<br />
46.2 6.51 2.89,<br />
2.85<br />
18.1,<br />
17.8<br />
4.98 27.1 34.6,<br />
46.4<br />
Bran 11.0,<br />
10.2<br />
6.61,<br />
6.83<br />
45.3 6.15 2.46,<br />
2.71<br />
15.4,<br />
16.9<br />
2.33 48.4 22.4,<br />
25.6<br />
Screenings 12.4 2.40 45.4 6.20 2.45 15.3 NA NA NA<br />
Soft White Winter<br />
All Inclusive 9.32,<br />
9.85<br />
4.71,<br />
4.79<br />
45.5 6.15 2.77,<br />
3.07<br />
17.3,<br />
19.2<br />
2.82 34.4 31.7,<br />
38.9<br />
All Inclusive<br />
without Screenings<br />
9.05 5.27 45.5 6.39 2.65 16.6 3.05 41.5 22.0,<br />
31.3<br />
Shorts 8.78,<br />
9.46<br />
4.44,<br />
4.67<br />
46.1 6.05 2.73,<br />
2.91<br />
17.1,<br />
18.2<br />
4.19 33.1 30.5,<br />
39.8<br />
Bran 9.25,<br />
10.2<br />
6.12,<br />
6.11<br />
45.3 6.07 2.89,<br />
2.84<br />
18.1,<br />
17.7<br />
2.59 44.7 18.8,<br />
28.9<br />
Hard Red Winter<br />
All Inclusive 8.75,<br />
9.57<br />
4.45,<br />
4.77<br />
45.8 6.06 2.74,<br />
3.04<br />
17.1,<br />
19.0<br />
3.07 37.8 31.3,<br />
35.3<br />
All Inclusive<br />
without Screenings<br />
8.38 5.23 45.8 5.98 2.76 17.3 4.55 43.9 16.1,<br />
27.3<br />
Shorts 8.94,<br />
9.24<br />
4.75,<br />
4.82<br />
46.2 6.12 3.05,<br />
3.05<br />
19.1,<br />
19.1<br />
4.41 39.1 25.6,<br />
32.7<br />
Bran 9.10,<br />
9.67<br />
6.28,<br />
6.58<br />
45.8 6.21 2.70,<br />
2.91<br />
16.9,<br />
18.2<br />
3.68 53.1 11.8,<br />
18.4<br />
Hard Amber Durum<br />
All Inclusive 9.63,<br />
9.84<br />
4.16,<br />
4.58<br />
46.4 6.28 2.94,<br />
3.05<br />
18.4,<br />
19.1<br />
4.77 33.0 37.0,<br />
38.5<br />
All Inclusive<br />
without Screenings<br />
8.77,<br />
9.67<br />
4.87,<br />
4.71<br />
46.0 6.00 3.18,<br />
3.31<br />
19.9,<br />
20.7<br />
5.03 31.1 31.3,<br />
38.4<br />
Shorts 8.93,<br />
9.54<br />
3.91,<br />
3.75<br />
NA NA 3.34 20.9 4.73 22.3 43.7,<br />
48.4<br />
Bran 9.09,<br />
9.50<br />
5.77,<br />
5.85<br />
46.4 6.09 2.79,<br />
3.02<br />
17.4,<br />
18.9<br />
5.82 43.6 18.0,<br />
25.8<br />
Hard Red Spring<br />
All Inclusive 9.25,<br />
9.62<br />
4.91 NA NA 2.98 18.6 3.02 39.4 30.4,<br />
34.0<br />
All Inclusive<br />
without Screenings<br />
8.80,<br />
10.3<br />
6.17 NA NA 3.30 20.6 3.83 48.6 23.0,<br />
20.8<br />
Shorts 9.00,<br />
9.49<br />
3.94 NA NA 3.20 20.0 4.56 28.1 35.6,<br />
43.5<br />
Bran 8.95,<br />
8.10<br />
6.45,<br />
7.02<br />
NA NA 3.04 19.0 3.41 54.9 13.7,<br />
15.7<br />
Combined Screenings<br />
9.16,<br />
9.05<br />
2.68,<br />
2.77<br />
45.9 6.31 2.71,<br />
2.91<br />
16.9,<br />
18.2<br />
2.27 23.7 53.7,<br />
53.1<br />
(a): Protein obtained by multiplying nitrogen value by 6.25.<br />
(b): NDF = neutral detergent fiber (~ cellulose + hemicellulose + lignin).<br />
(c): First listed starch value obtained via direct analyses, sec<strong>on</strong>d listed starch value obtained indirectly by taking 100-NDF-Fat-<br />
Protein-Ash.
Wheat Mill Feed + Water<br />
Initial Water Wash<br />
Course Filtrati<strong>on</strong><br />
(Buchner Funnel)<br />
Filtercake #1<br />
(for use as livestock feed supplement)<br />
Filtrate<br />
Liquefacti<strong>on</strong><br />
(∝-amylase additi<strong>on</strong>)<br />
Saccharificati<strong>on</strong><br />
(glucoamylase additi<strong>on</strong>)<br />
Fine Filtrati<strong>on</strong><br />
(Buchner Funnel + Whatman #4 FP)<br />
Filtercake #2<br />
(for use as livestock feed supplement)<br />
Glucose Product Stream<br />
(to fermentati<strong>on</strong> and/or catalytic upgrading)<br />
Figure 1. Starch Extracti<strong>on</strong> Key Processing Steps.<br />
Initial Water Wash: The key initial water wash parameters investigated were time (0.25-24 hrs),<br />
and temperature (25-80°C). During the testing 30 g wet basis (~27 g dry basis) of “soft white<br />
winter all inclusive without screenings” millfeed was added to 150 g dei<strong>on</strong>ized water for the<br />
specified water wash temperature and time. The subsequent course filtrati<strong>on</strong>, liquefacti<strong>on</strong>,<br />
saccharificati<strong>on</strong>, and fine filtrati<strong>on</strong> steps were then carried out (see Figure 1). The final filtrate<br />
was then analyzed for glucose c<strong>on</strong>centrati<strong>on</strong>. In additi<strong>on</strong>, the filtercakes from the course and<br />
fine filtrati<strong>on</strong> were dried to determine the solids c<strong>on</strong>centrati<strong>on</strong>. During this testing, the<br />
liquefacti<strong>on</strong> and saccharificati<strong>on</strong> parameters were held c<strong>on</strong>stant.<br />
The primary purpose of the initial water wash is to enhance the separati<strong>on</strong> of the starchc<strong>on</strong>taining<br />
solids away from the rest of the material. This starch-c<strong>on</strong>taining material is typically<br />
smaller than the other “branny” material and is very rich in starch, but also c<strong>on</strong>tains some<br />
protein. The water wash acts to liberate the starch-c<strong>on</strong>taining material by breaking weak<br />
hydrogen b<strong>on</strong>ds that hold some of the starch-c<strong>on</strong>taining material to the other solids. Thus, a
fairly good measure of the effectiveness of the initial water wash is the amount of starchc<strong>on</strong>taining<br />
material recovered after the water wash/course filtrati<strong>on</strong> step. Another good measure<br />
is the total glucose yield (assuming all steps downstream of the water wash and course filtrati<strong>on</strong><br />
steps are c<strong>on</strong>ducted at the same c<strong>on</strong>diti<strong>on</strong>s).<br />
It was observed that operati<strong>on</strong> at solids (millfeed) loadings greater than approximately 15% was<br />
difficult. For example, at a 25% solids loading, there was very little free water available, which<br />
caused problems with mixing and filtering the slurry soluti<strong>on</strong> during the course filtrati<strong>on</strong> step.<br />
Liquefacti<strong>on</strong>: The key liquefacti<strong>on</strong> parameters investigated were time (1-4 hrs), temperature<br />
(65-85°C), and enzyme type and c<strong>on</strong>centrati<strong>on</strong> (0 to 0.05 wt%, dry millfeed basis). Two different<br />
α-amylase enzymes were evaluated; a low-temperature and a high-temperature versi<strong>on</strong>. No pH<br />
adjustment was made to the feed soluti<strong>on</strong> to liquefacti<strong>on</strong>; the pH was approximately 7 in all<br />
cases.<br />
During the testing 30 g wet basis (~27 g dry basis) of “soft white winter all inclusive without<br />
screenings” millfeed was added to 150 g dei<strong>on</strong>ized water for the specified water wash<br />
temperature and time. The subsequent course filtrati<strong>on</strong>, liquefacti<strong>on</strong>, saccharificati<strong>on</strong>, and fine<br />
filtrati<strong>on</strong> steps were then carried out (see Figure 1). The final filtrate was then analyzed for<br />
glucose c<strong>on</strong>centrati<strong>on</strong>. In additi<strong>on</strong>, the filtercakes from the course and fine filtrati<strong>on</strong> were dried<br />
to determine the solids c<strong>on</strong>centrati<strong>on</strong>. During this testing, the water wash and saccharificati<strong>on</strong><br />
parameters were held c<strong>on</strong>stant.<br />
The primary purpose of the liquefacti<strong>on</strong> step is to partially hydrolyze the starch, so that it is for<br />
the most part solubilized. This allows the glucoamylase, used in the saccharificati<strong>on</strong> step<br />
downstream, to more efficiently c<strong>on</strong>vert the starch to glucose.<br />
From our test results we c<strong>on</strong>cluded that c<strong>on</strong>ducting the liquefacti<strong>on</strong> step, using the high<br />
temperature ∝-amylase results in both the highest glucose c<strong>on</strong>versi<strong>on</strong> and recovery in the<br />
product stream (i.e., efficient dewatering in the fine filtrati<strong>on</strong> step).<br />
Saccharificati<strong>on</strong>: The key saccharificati<strong>on</strong> parameters investigated were time (1-4 hrs),<br />
temperature (55-65°C), and enzyme c<strong>on</strong>centrati<strong>on</strong> (0.04 to 0.22 wt%, dry millfeed basis). The<br />
feed soluti<strong>on</strong> to saccharificati<strong>on</strong> was pH adjusted to approximately 5, using a buffer soluti<strong>on</strong>.<br />
The primary purpose of the saccharificati<strong>on</strong> step is to complete the hydrolysis of starch to<br />
glucose.<br />
During the testing 30 g wet basis (~27 g dry basis) of “soft white winter all inclusive without<br />
screenings” millfeed was added to 150 g dei<strong>on</strong>ized water for the specified water wash<br />
temperature and time. The subsequent course filtrati<strong>on</strong>, liquefacti<strong>on</strong>, saccharificati<strong>on</strong>, and fine<br />
filtrati<strong>on</strong> steps were then carried out (see Figure 1). The final filtrate was then analyzed for<br />
glucose c<strong>on</strong>centrati<strong>on</strong>. In additi<strong>on</strong>, the filtercakes from the course and fine filtrati<strong>on</strong> were dried<br />
to determine the solids c<strong>on</strong>centrati<strong>on</strong>. During this testing, the water wash and liquefacti<strong>on</strong><br />
parameters were held c<strong>on</strong>stant
Baseline Process Definiti<strong>on</strong>: The baseline millfeed starch extracti<strong>on</strong> process, shown in Figure 2,<br />
was developed using the bench-scale and feed analyses results discussed above. The millfeed to<br />
the starch extracti<strong>on</strong> process is assumed to be “soft white winter without screenings”.<br />
Water: 554-g (100 wt%)<br />
Filtrate (to liquefacti<strong>on</strong><br />
Ash: 1.8-g (0.5 wt%)<br />
Protein: 6.4-g (1.6 wt%)<br />
Fat: 0.3-g (0.1 wt%)<br />
Lignin+Fiber: 3.7-g (0.9wt%)<br />
Starch: 20.4-g (5.2 wt%)<br />
Water: 363.7-g (91.7wt%)<br />
Total: 396.3-g<br />
Initial Water<br />
Wash<br />
Course<br />
Filtrati<strong>on</strong><br />
Liquefacti<strong>on</strong><br />
Saccharificati<br />
<strong>on</strong><br />
Soft White Winter w/out Screenings<br />
Ash:<br />
5.6-g (5.6 wt%)<br />
Protein: 18.7-g (18.7 wt%)<br />
Fat:<br />
3.1-g (3.1 wt%)<br />
Lignin+Fiber: 41.5-g (41.5 wt%)<br />
Starch: 31.1-g (31.1 wt%)<br />
Total: 100-g<br />
Filtercake #1 (for use as livestock feed) supplement)<br />
Ash:<br />
3.8-g (1.5 wt%)<br />
Protein: 12.3-g (4.8 wt%)<br />
Fat:<br />
2.8-g (1.1 wt%)<br />
Lignin+Fiber: 37.8-g (14.6 wt%)<br />
Starch: 10.7-g (4.2 wt%)<br />
Water: 190.3-g (73.8 wt%)<br />
Total: 257.7-g<br />
Fine<br />
Filtrati<strong>on</strong><br />
Glucose Product Stream Filtercake #2 (for use as feed) supplement)<br />
(to fermentati<strong>on</strong> and/or catalytic upgrading) Ash:<br />
0.1-g (0.4 wt%)<br />
Ash:<br />
1.7-g (0.5 wt%) Protein: 4.4-g (17.5 wt%)<br />
Protein: 2.0-g (0.5 wt%) Fat:<br />
0.3-g (1.2 wt%)<br />
Fat:<br />
0.0-g (0.0 wt%) Lignin+Fiber: 3.7-g (14.7 wt%)<br />
Lignin+Fiber: 0.0-g (0.0 wt%) Starch: 0.1-g (0.4 wt%)<br />
Starch: 1.9-g (0.5 wt%) Glucose: 0.9-g (3.6 wt%)<br />
Glucose: 19.6-g (5.3 wt%) Water: 15.6-g (62.2 wt%)<br />
Water: 346.0-g (93.2 wt%)<br />
Total: 25.1-g<br />
Total: 371.2-g<br />
Figure 2. Baseline Process<br />
Approximately 33% of the original millfeed is recovered in the filtrate following the water wash<br />
and course filtrati<strong>on</strong> steps. In additi<strong>on</strong>, approximately 66% of the original starch is recovered for<br />
further processing. The remaining 34% leaves with filtercake #1, and is primarily associated<br />
with the water in the filtercake. Recovery of this starch is key to improving the baseline process.<br />
The majority of the lignin + fiber, fat, and most of the protein exit the process in filtercake #1.<br />
The protein c<strong>on</strong>tent of filtercake #1 is approximately 18% (dry solids basis), which is<br />
comparable to the initial millfeed protein c<strong>on</strong>tent. Thus, <str<strong>on</strong>g>based</str<strong>on</strong>g> <strong>on</strong> protein c<strong>on</strong>tent, filtercake #1<br />
should be comparable to the original millfeed for use as a livestock feed supplement.
The glucose product stream following the liquefacti<strong>on</strong>, saccharificati<strong>on</strong>, and fine filtrati<strong>on</strong> steps<br />
c<strong>on</strong>tains approximately 5.3 wt% glucose (total stream basis). Increasing the c<strong>on</strong>centrati<strong>on</strong> of<br />
glucose in this stream is another process improvement that is being developed.<br />
Approximately 90% of the starch entering the liquefacti<strong>on</strong> process is c<strong>on</strong>verted to glucose, and<br />
c<strong>on</strong>versi<strong>on</strong>s of greater than 95% were achieved during some of the testing. In additi<strong>on</strong>, greater<br />
than 95% of the glucose produced is recovered in the product stream, (primarily due to the<br />
excellent dewatering of filtercake #2). The baseline process shows that approximately 19.6% of<br />
the original dry millfeed is recovered as glucose. The test data also suggests that the higher<br />
starch c<strong>on</strong>tent analysis (see Table 1) of the original “soft white winter without screenings”<br />
millfeed is the more accurate value.<br />
Filtercake #2 has a protein c<strong>on</strong>tent of approximately 46% (dry solids basis). Therefore, <str<strong>on</strong>g>based</str<strong>on</strong>g> <strong>on</strong><br />
protein c<strong>on</strong>tent this material should be superior to either the original millfeed or filtercake #1 as a<br />
livestock feed supplement. This is a relatively small stream however (i.e., 67% of the original<br />
millfeed stream, dry solids basis).<br />
Millfeed Effects: All of the initial process optimizati<strong>on</strong> testing discussed above was c<strong>on</strong>ducted<br />
using ““soft white winter all inclusive without screenings” millfeed. Testing was also<br />
c<strong>on</strong>ducted, using other millfeed varieties and fracti<strong>on</strong>s. The millfeed varieties included soft red<br />
winter, soft white winter, hard red winter, hard amber durum, and hard red spring. The soft red<br />
winter <strong>wheat</strong> included five fracti<strong>on</strong>s: “midds, bran and screenings”, “midds and bran”, “red dog”<br />
(similar to midds), “bran”, and “screenings”. The other millfeed variety fracti<strong>on</strong>s included “all<br />
inclusive”, “all inclusive without screenings”, "shorts," (similar to midds) and "bran". In<br />
additi<strong>on</strong>, a combined screenings sample was evaluated.<br />
The results are given in Table 2. The starch c<strong>on</strong>tent of the millfeed is given in Table 2 (also see<br />
Table 1), al<strong>on</strong>g with the total glucose yield <strong>on</strong> a dry millfeed basis. The total glucose yield is the<br />
glucose in the product filtrate and wet filtercake streams from the fine filtrati<strong>on</strong> step (see Figure<br />
2).<br />
The results indicate that there is not a dramatic difference in processing different millfeed<br />
varieties, given that the fracti<strong>on</strong>s are the same (e.g., comparis<strong>on</strong> of soft white winter bran and<br />
hard amber durum bran). When processing any of the “all inclusive” fracti<strong>on</strong>s of the millfeed<br />
varieties evaluated, via the baseline starch recovery process (see Figure 1), between 14% to 20%<br />
of the millfeed was recovered as glucose (i.e., glucose in the fine filtrati<strong>on</strong> filtrate and filtercake<br />
streams).<br />
A more significant difference is observed when comparing the fracti<strong>on</strong>s within a certain variety<br />
of <strong>wheat</strong>. For example, from a filtering viewpoint, the bran and shorts are very different from<br />
<strong>on</strong>e another. The glucose yields appear to be slightly different for these as well, with the glucose<br />
yield from bran being significantly lower than that of shorts in most cases. This difference may<br />
in part be due to the differences in filtering the two millfeed fracti<strong>on</strong>s. Two somewhat<br />
inc<strong>on</strong>sistent results were obtained for “hard red spring, all inclusive without screenings” and<br />
“hard red winter shorts”.
Table 2. Wheat Millfeed Effects <strong>on</strong> Glucose Recovery.<br />
Millfeed Type<br />
Starch<br />
(wt%, Dry Millfeed Basis) (a)<br />
Soft Red Winter<br />
Midds, Bran & Screenings 33.5, 34.6 19.5<br />
Midds & Bran 29.8, 31.1 18.4<br />
Red Dog 34.6, 46.4 7.4<br />
Bran 22.4, 25.6 13.3<br />
Screenings NA 7.0<br />
Soft White Winter<br />
All Inclusive 31.7, 38.9 17.8<br />
All Inclusive without Screenings 22.0, 31.3 19.6<br />
Shorts 30.5, 39.8 20.7<br />
Bran 18.8, 28.9 11.2<br />
Hard Red Winter<br />
All Inclusive 31.3, 35.3 15.3<br />
All Inclusive without Screenings 16.1, 27.3 14.4<br />
Shorts 25.6, 32.7 10.8<br />
Bran 11.8, 18.4 6.2<br />
Hard Amber Durum<br />
All Inclusive 37.0, 38.5 14.2<br />
All Inclusive without Screenings 31.3, 38.4 18.0<br />
Shorts 43.7, 48.4 27.5<br />
Bran 18.0, 25.8 9.3<br />
Hard Red Spring<br />
All Inclusive 30.4, 34.0 13.7<br />
All Inclusive without Screenings 23.0, 20.8 7.9<br />
Shorts 35.6, 43.5 18.6<br />
Bran 13.7, 15.7 4.3<br />
Combined Screenings<br />
53.7, 53.1 16.3<br />
Total Glucose Yield<br />
(wt%, Dry Millfeed Basis)<br />
Pilot-scale Testing: A pilot-scale test was c<strong>on</strong>ducted primarily to produce sufficient amounts of<br />
solid fiber material from the course and fine filtrati<strong>on</strong> steps to supply for analyses and animal<br />
feed studies. Sec<strong>on</strong>dary purposes for c<strong>on</strong>ducting the test were to compare glucose yields with<br />
the small-scale testing results, to evaluate some of the processing steps (i.e., pumping, mixing<br />
and filtrati<strong>on</strong>) at a larger scale, and to provide material for downstream catalytic processing.<br />
An existing system at PNNL (after slight modificati<strong>on</strong>s were made) was used to c<strong>on</strong>duct the<br />
pilot-scale testing. The system is shown in Figure 3. It c<strong>on</strong>tains two 200-gall<strong>on</strong> tanks with<br />
impellors, and an inline heater/circulati<strong>on</strong> system for each tank. The system has the capability of<br />
processing material at temperatures up to approximately 90°C. The system also has a small acid<br />
feed tank. Temperature and pH c<strong>on</strong>trols exist in the system.
Figure 3. Pilot-scale Starch Recovery System.<br />
At the beginning of the test, 113 gall<strong>on</strong>s (~940 lbs) of tap water was fed to <strong>on</strong>e of the 200-gall<strong>on</strong><br />
tanks and heated. After reaching temperature, 131 lbs of a 50/50 (wt/wt, dry weight basis) blend<br />
of hard red winter without screenings + soft white winter without screenings millfeed was<br />
gradually added through a port-hole in the top of the tank. The slurry was held at temperature<br />
for the water wash step in the agitated tank. The soluti<strong>on</strong> was then course filtered by first<br />
passing it across a pilot-scale screen, and then further dewatered using 400 and 600 micr<strong>on</strong> filter<br />
bags. A porti<strong>on</strong> of the course filtercake was then rinsed with tap water and again filtered using<br />
400 and 600 micr<strong>on</strong> filter bags, and then dried at 70°C for 44 hrs. This dried filtercake was then<br />
sent for analyses and animal feed testing.<br />
The filtrate (c<strong>on</strong>taining starch) from the course filtrati<strong>on</strong> step was returned to the processing<br />
tank, heated, and α-amylase was added to liquefy the starch.<br />
The soluti<strong>on</strong> was then cooled, the soluti<strong>on</strong> pH adjusted by adding sulfuric acid, and<br />
glucoamylase added to c<strong>on</strong>vert the liquefied starch to glucose. A porti<strong>on</strong> of the soluti<strong>on</strong> was<br />
then fine filtered by using 25 micr<strong>on</strong> filter bags. This fine filtercake was then rinsed with tap<br />
water and again filtered using 25 micr<strong>on</strong> filter bags, and then dried at 70°C (atmospheric<br />
pressure) for 34 hrs. This dried filtercake was then sent for analyses and animal feed testing.<br />
The material balance around the entire pilot-scale test was >99% (not including the filtercake<br />
rinsing steps). The material balance around the course filtercake rinse step was 97.5% and<br />
around the fine filtercake rinse step was 98.1%.
Operati<strong>on</strong>ally, filtrati<strong>on</strong> was the most difficult to implement during the pilot-scale testing. The<br />
course filtrati<strong>on</strong> progressed fairly well, with the excepti<strong>on</strong> that more of the large mesh size<br />
fibrous material was passed through in the feed to liquefacti<strong>on</strong> than was desired. This can be<br />
corrected by using smaller screen/mesh sizes. The fine filtrati<strong>on</strong> step was very difficult to<br />
implement. It was extremely difficult to dewater the fine filtercake during the pilot-scale testing.<br />
Glucose c<strong>on</strong>centrati<strong>on</strong>s and yields are given in Table 3. For comparis<strong>on</strong>, glucose c<strong>on</strong>centrati<strong>on</strong>s<br />
and yields are also given for small-scale testing using the 50/50 blend of hard red winter without<br />
screenings + soft white without screenings. Same solids loading and similar processing<br />
c<strong>on</strong>diti<strong>on</strong>s were used for both tests. The <strong>on</strong>ly difference between the small-scale testing and the<br />
pilot-scale testing in this case is that the soft white winter without screenings and hard red winter<br />
without screenings were obtained from different mill runs (i.e., the two materials used for the<br />
pilot-scale testing was received as a separate aliquot at a later time).<br />
Table 3. Glucose C<strong>on</strong>centrati<strong>on</strong> and Yield.<br />
Small-scale Testing Pilot-scale Testing<br />
Glucose C<strong>on</strong>centrati<strong>on</strong> (a) 3.5% 3.4%<br />
Glucose Yield (b) 18.7% 20.3%<br />
(a): Glucose c<strong>on</strong>centrati<strong>on</strong> in stream from saccharificati<strong>on</strong> after filtrati<strong>on</strong> through a 0.45 micr<strong>on</strong> filter.<br />
(b): Glucose yield is <strong>on</strong> a dry millfeed basis, and are also <str<strong>on</strong>g>based</str<strong>on</strong>g> <strong>on</strong> the soluti<strong>on</strong> exiting saccharificati<strong>on</strong> (i.e., does not include<br />
glucose c<strong>on</strong>tained in the wet course filtercake, but does include glucose in the wet fine filtercake<br />
The values given in Table 3 were obtained by taking a small sample of the soluti<strong>on</strong> after<br />
saccharificati<strong>on</strong>, filtering it through a 0.45 micr<strong>on</strong> filter and then analyzing the soluti<strong>on</strong> for<br />
glucose. This was then combined with material balance informati<strong>on</strong> to obtain the glucose yields<br />
that are reported. The glucose yields are <strong>on</strong> a dry millfeed basis, and are also <str<strong>on</strong>g>based</str<strong>on</strong>g> <strong>on</strong> the<br />
soluti<strong>on</strong> exiting saccharificati<strong>on</strong> (i.e., does not include glucose c<strong>on</strong>tained in the wet course<br />
filtercake, but does include glucose in the wet fine filtercake). As can be seen, the small-scale<br />
and pilot-scale testing results are in agreement with <strong>on</strong>e another.<br />
Incorporati<strong>on</strong> of the glucose estimated to be lost in the water associated with the wet course<br />
filtercake during the pilot-scale tests gives a total glucose yield of approximately 29.9 wt% (dry<br />
millfeed basis). This is the maximum glucose yield expected (i.e., using process improvements<br />
such as thorough rinsing/recovery of rinsate, and/or countercurrent washing).<br />
By-Product Stream Evaluati<strong>on</strong>: The recovered fine filtercake solids and course filtercake solids<br />
were analyzed and used in animal feed testing. The analytical results are shown in Table 4 al<strong>on</strong>g<br />
with reported values for other typical feedstock supplements (<strong>wheat</strong> midds, corn gluten feed,<br />
corn, and soybean meal) for comparis<strong>on</strong>.<br />
The analytical results indicate that the course filtercake c<strong>on</strong>tained approximately 2.4 wt%<br />
residual starch, and the fine filtercake material c<strong>on</strong>tained approximately 3 wt% residual starch.<br />
The protein analyses show that the fine filtercake material had a protein c<strong>on</strong>tent of 33.9% (dry<br />
solids basis) and the course filtercake material had a protein c<strong>on</strong>tent of approximately 17.1%<br />
(dry solids basis). The protein c<strong>on</strong>tent of the fine filtercake material is significantly lower than
that achieved in some of the small scale testing (i.e., 50% protein and higher have been attained).<br />
This is likely due to less than ideal course filtrati<strong>on</strong> during the pilot-scale test. It is anticipated<br />
that more of the large mesh size fibrous material (i.e., low protein c<strong>on</strong>tent) passed through the<br />
course filtrati<strong>on</strong> than is desired.<br />
Soybean<br />
Table 4. Chemical Compositi<strong>on</strong>s of Coarse and Fine Filtercake By-products in Comparis<strong>on</strong> to<br />
Other Feed for Ruminant Animals.<br />
Coarse Fine<br />
Corn<br />
Filtercake Filtercake Byproduct<br />
Wheat gluten<br />
Nutrients<br />
By-product<br />
Midds (a) feed (a) Corn (a) meal (a)<br />
Dry Matter (DM), % 90.60 94.50 89.30 90.00 90.00 90.00<br />
Crude Protein (CP), %DM 17.10 33.90 17.20 23.80 9.80 51.80<br />
Available CP, %DM 15.90 32.50 --- --- --- ---<br />
Unavailable CP, %DM 1.20 1.50 --- --- --- ---<br />
Adjusted CP, %DM 17.10 33.50 --- --- --- ---<br />
Soluble CP, %CP 22.00 9.70 40.00 49.00 11.00 20.00<br />
Acid Detergent Fiber (ADF),<br />
%DM<br />
22.00 18.90 11.70 12.70 3.30 7.00<br />
Neutral Detergent Fiber<br />
(NDF), %DM<br />
75.30 53.90 35.90 36.20 10.80 10.30<br />
Fat, %DM 4.00 8.50 4.70 3.91 4.06 1.67<br />
Ash, %DM 4.34 1.58 5.00 6.90 1.46 6.9<br />
Total Digestible Nutrients<br />
(TDN), % DM<br />
60.00 79.00 69.00 83.00 85.00 87.00<br />
NE L , Mcal/kg (b) 1.39 1.89 1.57 1.91 1.96 2.01<br />
NE m , Mcal/kg (b) 1.19 1.91 1.60 2.03 2.10 2.16<br />
NE g , Mcal/kg (b) 0.62 1.28 1.00 1.37 1.43 1.48<br />
N<strong>on</strong>-structural Carbohydrate<br />
(NSC), %DM<br />
0.60 3.60 33.50 28.30 73.88 29.30<br />
Starch, %DM 2.40 3.00 --- --- --- ---<br />
Ca, %DM 0.22 0.06 .17 0.07 0.03 0.46<br />
P, %DM 1.12 0.38 1.01 0.95 0.32 0.73<br />
Mg, %DM 0.61 0.08 0.40 0.40 0.12 0.32<br />
K, %DM 0.36 0.19 1.81 1.40 0.44 2.42<br />
Na, %DM 0.00 0.01 0.02 0.26 0.01 0.07<br />
S, %DM 0.13 0.29 0.19 0.47 0.11 0.46<br />
Fe, ppm 156.00 215 170 226 55 277<br />
Zn, ppm 107.00 40 102 73 24 67<br />
Cu, ppm 16.00 6 13 7 3 19<br />
Mn, ppm 194.00 23 124 22 55 48<br />
Mo, ppm 0.00 2 2 2 1 7<br />
(a): Book values from Beef NRC (1996), Dairy NRC (1987) and DHI Lab.<br />
(b): NE L = net energy for lactati<strong>on</strong>; NE m = net energy for maintenance; NE g = net energy for growth.
The feed analyses and feed testing results indicate the following:<br />
• In ruminant diets: coarse byproduct (course filtercake) is estimated to be 65-96% of<br />
<strong>wheat</strong> midds value; fine byproduct (fine filtercake) to be 46-61% of soybean meal<br />
value.<br />
• In poultry diets: fine byproduct (fine filtercake) is valued to be 167-204% of <strong>wheat</strong><br />
midds. In swine diets: fine byproduct (fine filtercake) is estimated to be 171-232% of<br />
<strong>wheat</strong> midds value.<br />
Fermentati<strong>on</strong> Processing to Value-Added Products<br />
The hydrolysate of <strong>wheat</strong> <strong>milling</strong> byproduct was used as the primary carb<strong>on</strong> source for the lactic<br />
acid fermentati<strong>on</strong> process <str<strong>on</strong>g>development</str<strong>on</strong>g>. Batch cultures of lactic acid fermentati<strong>on</strong> were primarily<br />
c<strong>on</strong>ducted to assess the feasibility of the fermentati<strong>on</strong> process <str<strong>on</strong>g>development</str<strong>on</strong>g>.<br />
Summary of Fermentati<strong>on</strong> Results: Three lactic acid producing strains, Lactobacillus rhamnosus<br />
(ATCC 10863), Lactobacillus delbrueckii subsp.lactis (ATCC 12315), and Lactobacillus<br />
rhamnosus (ATCC 11443) were tested for their performance of lactic acid producti<strong>on</strong>. All<br />
strains showed favorable lactic acid producti<strong>on</strong> rates at the temperature of 43°C while there was<br />
some lactic acid fermentati<strong>on</strong> inhibiti<strong>on</strong> at 45°C for strain L.lactis. At 43°C, most of the tests<br />
showed complete c<strong>on</strong>versi<strong>on</strong> of the glucose in the <strong>wheat</strong> millfeed hydrolysate into lactic acid. In<br />
general, a higher glucose c<strong>on</strong>centrati<strong>on</strong> in the <strong>wheat</strong> byproduct hydrolysate required a l<strong>on</strong>ger<br />
fermentati<strong>on</strong> time. In all the tested strains, L rhamnosus (ATCC 11443) had the best<br />
fermentati<strong>on</strong> performance under the testing c<strong>on</strong>diti<strong>on</strong>s in terms of shorter fermentati<strong>on</strong> time and<br />
higher sugar tolerance. In the nutrient additi<strong>on</strong> tests, results showed that the pure hydrolysate of<br />
<strong>wheat</strong> millfeed could entirely support the lactic acid fermentati<strong>on</strong> process without lowering the<br />
c<strong>on</strong>versi<strong>on</strong> yield (The theoretical yield is 100% by weight). Based <strong>on</strong> the mineral analysis,<br />
manganese was the <strong>on</strong>ly critical element lacking in the hydrolysate medium. The fermentati<strong>on</strong><br />
batch culture without an additi<strong>on</strong> of manganese could result in lower lactic acid yield than the<br />
<strong>on</strong>e with the additi<strong>on</strong> of manganese. C<strong>on</strong>centrated seed inoculati<strong>on</strong> could speed up lactic acid<br />
fermentati<strong>on</strong> and reduce lag time. Most encouraging of all, under the testing c<strong>on</strong>diti<strong>on</strong>, the<br />
hydrolysate medium with a minimal manganese additi<strong>on</strong> had better performance than the culture<br />
medium c<strong>on</strong>taining reagent grade glucose and other nutrients such as yeast extract and pept<strong>on</strong>e.<br />
The superior performance of the hydrolysate medium is probably due to the presence of various<br />
amino acid and other nutrients in the <strong>wheat</strong> millfeed hydrolysate. Experimental results also<br />
indicated that a semi-batch or even a c<strong>on</strong>tinuous culturing mode could provide higher<br />
fermentati<strong>on</strong> performance than the batch culture due to the eliminati<strong>on</strong> of a culture lag phase and<br />
the maintenance of top fermentati<strong>on</strong> activities. There were <strong>on</strong>ly low levels of fermentati<strong>on</strong><br />
byproducts, acetate and ethanol present in the culture broth. Crude <strong>wheat</strong> millfeed hydrolysate,<br />
pre-sterilized in the hydrolysate process step, could be directly used in the fermentati<strong>on</strong> process,<br />
which could potentially lower the producti<strong>on</strong> cost.<br />
Lactic Acid Fermentati<strong>on</strong> Without the Additi<strong>on</strong> of Growth Nutrients and Mineral Salts: The<br />
supplement of additi<strong>on</strong>al nutrients such as yeast extract and pept<strong>on</strong>e and mineral salts is critical<br />
to both lactic acid producti<strong>on</strong> and its associated cost. The major objectives of this test were to
determine whether pure <strong>wheat</strong> byproduct hydrolysate could directly support lactic acid<br />
fermentati<strong>on</strong> without the additi<strong>on</strong> of yeast extract, pept<strong>on</strong>e, and mineral salts. The eliminati<strong>on</strong> of<br />
nutrient additi<strong>on</strong> to the fermentati<strong>on</strong> medium can significantly reduce the cost of lactic acid<br />
producti<strong>on</strong>. Most of the minerals were available for lactic acid fermentati<strong>on</strong> except manganese.<br />
Four different batches of <strong>wheat</strong> byproduct hydrolysate were used in the fermentati<strong>on</strong> test; the<br />
glucose c<strong>on</strong>centrati<strong>on</strong> in the feedstock ranged from 36 to 126 g/L prior to sterilizati<strong>on</strong> and<br />
inoculati<strong>on</strong>. The bacterial strain ATCC 11443 was used for all the fermentati<strong>on</strong> tests. Results<br />
show that pure <strong>wheat</strong> byproduct hydrolysate can support the entire lactic acid fermentati<strong>on</strong><br />
process, and the overall yield of glucose to lactate varied from 97 to 104% (± 3.0 – 7.5%)<br />
depending <strong>on</strong> the batch cultures. The slightly higher c<strong>on</strong>versi<strong>on</strong> yield was due to the utilizati<strong>on</strong><br />
of other sugars such as fructose present in the hydrolysate. The highest lactate c<strong>on</strong>centrati<strong>on</strong><br />
reached 69.7 ± 2.4 g/L with an overall c<strong>on</strong>versi<strong>on</strong> yield of 102.3 ± 3.0%. In general, it took<br />
about 34 to 40 hours to complete the entire fermentati<strong>on</strong> process when the glucose c<strong>on</strong>centrati<strong>on</strong><br />
in the hydrolysate ranged from 34 to 80 g/L. In the case that the culture had a glucose<br />
c<strong>on</strong>centrati<strong>on</strong> of 98 g/L, the fermentati<strong>on</strong> process lasted about 64 hours. However, the glucose in<br />
the tested cultures was all c<strong>on</strong>verted to lactic acid at levels ranging from 97-104 %.<br />
To compare the productivity, Table 5 and Figure 4 summarize the batch fermentati<strong>on</strong> results<br />
am<strong>on</strong>g the c<strong>on</strong>diti<strong>on</strong>s with and without the additi<strong>on</strong> of yeast extract, pept<strong>on</strong>e, and mineral salts.<br />
The results had suggested that there were no effects of yeast extract and pept<strong>on</strong>e <strong>on</strong> the lactic<br />
acid productivity, but the mineral salt additi<strong>on</strong> might affect the productivity. The productivity<br />
plots in Figure 4 show that the most active productivity occurred during a 20 to 40-hour period<br />
for the cultures with initial glucose c<strong>on</strong>centrati<strong>on</strong>s less than 80 g/L, indicating that the culturing<br />
age also affected the productivity. Based <strong>on</strong> the analysis of the c<strong>on</strong>centrati<strong>on</strong>s of metals in the<br />
regular hydrolysate feed as shown in Table 6 there is apparently a lack of Mn and an insufficient<br />
amount of Fe in the pure hydrolysate as compared to the supplemented level of these minerals in<br />
the culture medium. In additi<strong>on</strong>, there were threefold differences of the c<strong>on</strong>centrati<strong>on</strong>s of K and<br />
P between the pure hydrolysate and the modified medium. In the next secti<strong>on</strong>, the fermentati<strong>on</strong><br />
tests were c<strong>on</strong>ducted to determine the effects of these metal c<strong>on</strong>centrati<strong>on</strong>s.<br />
Table 5. Lactate productivity comparis<strong>on</strong> of batch cultures with and without additi<strong>on</strong>s of yeast<br />
extract, pept<strong>on</strong>e, and mineral salts.<br />
Hydrolysate Batch No.<br />
Initial Glucose<br />
C<strong>on</strong>centrati<strong>on</strong><br />
(g/L)<br />
Yeast Extract<br />
and Pept<strong>on</strong>e<br />
Additi<strong>on</strong><br />
Additi<strong>on</strong> of<br />
Mineral<br />
Salts<br />
Lactic Acid<br />
Productivity*<br />
(g/L/hr)<br />
WHC (c<strong>on</strong>centrated) 70.2 Yes Yes 3.15<br />
WHC (c<strong>on</strong>centrated) 72.4 No Yes 3.13<br />
WH (regular) 34.0 No No 0.91<br />
WHC1 (c<strong>on</strong>centrated) 68.1 No No 1.58<br />
WHC2 (c<strong>on</strong>centrated) 80.1 No No 1.42<br />
WHC3 (c<strong>on</strong>centrated) 97.6 No No 1.52<br />
*Productivity was calculated when over 90% of the glucose was c<strong>on</strong>sumed in the culture.
Table 6. Mineral i<strong>on</strong> comparis<strong>on</strong> in hydrolysate medium with and without mineral supplement.<br />
Mineral I<strong>on</strong><br />
Hydrolysate Filtrate<br />
(mg/L)<br />
Hydrolysate Filtrate with<br />
Supplemented Mineral<br />
I<strong>on</strong>s (mg/L)<br />
Mg 233 292<br />
Mn NS* 39<br />
Fe 0.9 6.9<br />
K 1,170 3378<br />
P 561 1777<br />
S 406 506<br />
*NS: not significantly detected.<br />
Glucose and Lactate (g/L)<br />
80<br />
70<br />
60<br />
50<br />
40<br />
30<br />
20<br />
10<br />
0<br />
0 10 20 30 40 50 60 70<br />
Culture Time (hours)<br />
Glu: WHC1<br />
Figure 4. Lactic acid fermentati<strong>on</strong> in batch cultures<br />
Each data point represents the data averaged from triplicate cultures,<br />
Error bars stand for standard deviati<strong>on</strong>. Glu: glucose; LA: lactate.<br />
LA: WHC1<br />
Effects of metal i<strong>on</strong> additi<strong>on</strong>s <strong>on</strong> lactic acid fermentati<strong>on</strong>: The hydrolysate medium has less ir<strong>on</strong><br />
and an insufficient amount of manganese, which might have significant effects <strong>on</strong> lactic acid<br />
fermentati<strong>on</strong> and its productivity. The objective of this test was to determine the effects of Mn,<br />
Fe, and Mg levels <strong>on</strong> lactic acid fermentati<strong>on</strong>. In additi<strong>on</strong>, preliminary tests were also c<strong>on</strong>ducted<br />
to study the effects of seed inoculum c<strong>on</strong>centrati<strong>on</strong> <strong>on</strong> lactic acid fermentati<strong>on</strong>.<br />
Table 7 summarizes the normalized overall lactate yield of glucose to lactate under different<br />
metal i<strong>on</strong> supplemental c<strong>on</strong>diti<strong>on</strong>s. The normalized yields were calculated under the assumpti<strong>on</strong><br />
that the yield in the batch culture supplemented with all mineral i<strong>on</strong>s was 100%. As shown in<br />
Table 7, <strong>on</strong>ly the culture without the additi<strong>on</strong> of Mn had a decrease of 6.8% in the normalized<br />
yield while others maintained the normalized lactate yield at 101.5 – 103.0 % (± 0.1 – 2.7%).<br />
The results imply that Mn is an important factor <strong>on</strong> lactic acid fermentati<strong>on</strong> although the yield
difference is small under the current testing c<strong>on</strong>diti<strong>on</strong>. It should be noticed that the seed<br />
inoculum, which comprises 10% of the fermentati<strong>on</strong> volume, might bring in some levels of Mn,<br />
which needs to be determined.<br />
Table 7. Normalized overall lactate yield from glucose without the additi<strong>on</strong> of certain metal i<strong>on</strong>s<br />
Initial Metal I<strong>on</strong> C<strong>on</strong>centrati<strong>on</strong><br />
in Hydrolysate*<br />
Final Metal I<strong>on</strong> C<strong>on</strong>centrati<strong>on</strong><br />
(in Hydrolysate + Supplemented)<br />
Normalized<br />
Overall<br />
Mn<br />
(mg/L)<br />
Fe<br />
(mg/L)<br />
Mg<br />
(mg/L)<br />
Mn<br />
(mg/L)<br />
Fe<br />
(mg/L)<br />
Mg<br />
(mg/L)<br />
Lactate Yield<br />
(%)<br />
39.0 7.8 525.2 100.0<br />
NS** 1.7 466.0 NS 7.8 525.2 93.2<br />
39.0 1.7 525.2 101.5<br />
39.0 7.8 466 103.0<br />
*The hydrolysate was c<strong>on</strong>centrated by two-fold. Therefore, the initial metal i<strong>on</strong> c<strong>on</strong>centrati<strong>on</strong>s were twice the <strong>on</strong>es before<br />
c<strong>on</strong>centrati<strong>on</strong>.<br />
**NS: not significantly detected.<br />
The preliminary tests were made of seed inoculum c<strong>on</strong>centrati<strong>on</strong> <strong>on</strong> lactic acid fermentati<strong>on</strong>.<br />
After a two-day growth, seed culture was c<strong>on</strong>centrated by two and fourfold through<br />
centrifugati<strong>on</strong>. C<strong>on</strong>sequently, the batch cultures were inoculated with 10% volume of<br />
c<strong>on</strong>centrated seed culture (5 ml seed culture to 50 ml culture medium). Results show that during<br />
the initial 24 hours of fermentati<strong>on</strong>, the batch cultures inoculated with 2x and 4x seed culture had<br />
higher fermentati<strong>on</strong> productivity (2-6 % and 10-14% higher, respectively) than the cultures with<br />
<strong>on</strong>ly 1x seed inoculati<strong>on</strong>. The preliminary results here imply that fed batch culture or even<br />
c<strong>on</strong>tinuous culture could increase productivity since the culture can always be maintained at the<br />
top productive level due to eliminati<strong>on</strong> of the lag phase (for biomass accumulati<strong>on</strong>) in the<br />
fermentati<strong>on</strong> process.<br />
Feedstock Comparis<strong>on</strong> <strong>on</strong> Lactic Acid Fermentati<strong>on</strong>: To compare the lactic acid fermentati<strong>on</strong><br />
performance between reagent grade glucose and <strong>wheat</strong> millfeed hydrolysate, batch fermentati<strong>on</strong><br />
cultures were set up using anhydrous D-(+)-glucose (99+%, ACROS Organics, NJ). The culture<br />
medium c<strong>on</strong>tains 7.2% glucose supplemented with yeast extract 0.5%, pept<strong>on</strong>e 1.0%, and<br />
mineral salts. The comparis<strong>on</strong> results are shown in Figure 5a and 5b for both types of batch<br />
cultures using either reagent glucose or <strong>wheat</strong> millfeed hydrolysate as primary substrate. The<br />
data indicates that the <strong>wheat</strong> millfeed hydrolysate has better performance than the pure glucose<br />
medium supplemented with growth nutrients and minerals. All the hydrolysate cultures<br />
completed lactic acid fermentati<strong>on</strong> within 40 hours when the initial glucose c<strong>on</strong>centrati<strong>on</strong> was<br />
equal or less than 7.2% while the culture with pure glucose took about 63 hours to complete the<br />
entire fermentati<strong>on</strong> process, which had a similar fermentati<strong>on</strong> ending time as the culture with<br />
9.7% glucose in the hydrolysate medium. Therefore, the hydrolysate medium has equal or even<br />
better performance under the current testing c<strong>on</strong>diti<strong>on</strong>s, probably due to a more complete set of<br />
growth nutrients c<strong>on</strong>tained in the <strong>wheat</strong> millfeed hydrolysate than that in the supplemented yeast<br />
extract and pept<strong>on</strong>e.
100.00<br />
a<br />
Glucose C<strong>on</strong>centrati<strong>on</strong> (g/L)<br />
80.00<br />
60.00<br />
40.00<br />
20.00<br />
Glu: glu w/M & YP<br />
Glu: WHC w/M<br />
Glu: WH<br />
Glu: WHC1<br />
Glu: WHC3<br />
0.00<br />
0.00 20.00 40.00 60.00 80.00<br />
Culture Time (hours)<br />
100.00<br />
b<br />
Lactate C<strong>on</strong>centrati<strong>on</strong> (g/L)<br />
80.00<br />
60.00<br />
40.00<br />
20.00<br />
LA: glu w/M & YP<br />
LA: WHC w/M<br />
LA: WH<br />
LA: WHC1<br />
LA: WHC3<br />
0.00<br />
0 20 40 60 80<br />
Culture Time (hours)<br />
Figure 5. Lactic acid fermentati<strong>on</strong> in batch cultures<br />
a: glucose utilizati<strong>on</strong> in batch cultures;<br />
b: lactate producti<strong>on</strong> in batch cultures.<br />
Glu: glucose; LA: lactate; w/M: hydrolysate supplemented with all minerals; w/M & YP: hydrolysate supplemented with<br />
minerals, yeast extract, and pept<strong>on</strong>e.<br />
Catalytic Processing to Value-Added Products<br />
The catalytic process evaluated using <strong>wheat</strong> millfeed-derived glucose soluti<strong>on</strong> was the<br />
hydrogenati<strong>on</strong> of the glucose to sorbitol. The reacti<strong>on</strong> is a straightforward reacti<strong>on</strong> of elemental<br />
hydrogen gas with the carb<strong>on</strong>yl functi<strong>on</strong>al group <strong>on</strong> the glucose to form an alcohol. In the<br />
process, the sugar is c<strong>on</strong>verted to a polyol (C6-hexitol). The reacti<strong>on</strong> occurs with a high
selectivity of 95% or greater to the preferred product. Numerous metal catalysts for the process<br />
have been reported in the literature. The process is commercially important as the sorbitol<br />
product is produced domestically at over 500 milli<strong>on</strong> pounds annually.<br />
These tests were an extensi<strong>on</strong> of much earlier work with reagent grade glucose and corn-derived<br />
dextrose (d-glucose). The tests involved the ruthenium <strong>on</strong> rutile catalyst (U.S. patent<br />
#6,235,797), which was developed in our laboratory and has been used extensively in earlier<br />
tests. The main issue involved in the tests was the effect of the trace c<strong>on</strong>taminants carried over<br />
from the <strong>wheat</strong> and the <strong>wheat</strong> processing. The <strong>wheat</strong> millfeed-derived glucose was tested<br />
directly and also following various cleanup steps. Numerous tests were made to evaluate the<br />
several c<strong>on</strong>taminants identified in the <strong>wheat</strong> millfeed glucose by adding reagent chemical models<br />
to reagent glucose for catalytic testing.<br />
Test Procedure: Glucose hydrogenati<strong>on</strong> to sorbitol was chosen as the catalytic processing test<br />
case for the <strong>wheat</strong>-derived glucose. The reactor was a stirred batch reactor made of 316 stainless<br />
steel. The reactor volume was typically 300 mL with the vessel filled half full of aqueous sugar<br />
soluti<strong>on</strong>. The catalyst was a ruthenium <strong>on</strong> titania (rutile form) extrudate ground to powder (5 g<br />
per 150 g of feed soluti<strong>on</strong>). The processing c<strong>on</strong>diti<strong>on</strong>s were 100°C and 1500 psig with hydrogen<br />
atmosphere. The slurry of feed soluti<strong>on</strong> and catalyst particles were stirred to maximize hydrogen<br />
c<strong>on</strong>tact. The reacti<strong>on</strong> was allowed to proceed for 6 hours, typically, with multiple samples of<br />
product soluti<strong>on</strong> withdrawn throughout the reacti<strong>on</strong> period. The product soluti<strong>on</strong>s were analyzed<br />
by liquid chromatography to determine primarily the glucose and sorbitol c<strong>on</strong>centrati<strong>on</strong>s, but<br />
also to m<strong>on</strong>itor for byproducts. The vented gas product at the end of the test was analyzed by<br />
gas chromatography to look for other byproducts (hydrocarb<strong>on</strong>s or carb<strong>on</strong> oxides).<br />
Baseline Test Results: Initial tests were performed to quantify reacti<strong>on</strong> rate and reproducibility<br />
using reagent glucose (5 wt%) in dei<strong>on</strong>ized water as the feedstock. The process test was<br />
repeated in order to be able to evaluate the reproducibility of the reactor system. The used<br />
catalyst was reused in two subsequent tests in order to be able to evaluate the catalyst lifetime.<br />
The effect of stir rate was also assessed by testing at higher rpm. The glucose soluti<strong>on</strong> was also<br />
tested at two other c<strong>on</strong>centrati<strong>on</strong>s, 2.6% and 7.4%, in order to be able to evaluate the effect of<br />
c<strong>on</strong>centrati<strong>on</strong>. The results of these tests are graphically depicted in Figure 6.<br />
The glucose c<strong>on</strong>versi<strong>on</strong> curves in Figure 6 show a comm<strong>on</strong> trend in all the tests. The tests that<br />
repeat the use of the catalyst (reagent 1A and 1B) show a slight inhibiti<strong>on</strong> in the early porti<strong>on</strong> of<br />
the test that suggests that the catalyst must be reactivated (re-reduced). The test at higher stir rate<br />
shows little improvement. The tests of varying c<strong>on</strong>centrati<strong>on</strong> of glucose (high = 7.4% and low =<br />
2.6%) show a slight trend of increased rate of glucose c<strong>on</strong>versi<strong>on</strong> at lower c<strong>on</strong>centrati<strong>on</strong>, but the<br />
middle c<strong>on</strong>centrati<strong>on</strong> of 5% does not follow the trend. Overall, these results show the range of<br />
variability achieved with this test. In all cases, the glucose c<strong>on</strong>versi<strong>on</strong> has reached 95% within 2<br />
hours at temperature.
100.0<br />
90.0<br />
80.0<br />
percent<br />
70.0<br />
60.0<br />
50.0<br />
40.0<br />
30.0<br />
reagent 1<br />
reagent 1A<br />
reagent 1B<br />
reagent 2<br />
fast stir<br />
low c<strong>on</strong>c.<br />
hi c<strong>on</strong>c.<br />
20.0<br />
10.0<br />
0.0<br />
delay while catalyst is reduced?<br />
0 1 2 3 4 5 6 7<br />
time at temperature, hr<br />
Figure 6. Glucose C<strong>on</strong>versi<strong>on</strong> by Catalytic Hydrogenati<strong>on</strong><br />
Wheat Millfeed-Derived Feedstock Tests: Tests were performed with the <strong>wheat</strong> millfeedderived<br />
glucose soluti<strong>on</strong> to determine its reactivity relative to reagent glucose. Tests were made<br />
with three versi<strong>on</strong>s of the glucose soluti<strong>on</strong>: the hydrolysis filter press product, the hydrolysis<br />
ultrafiltrati<strong>on</strong> (UF) permeate, and the nanofiltrati<strong>on</strong> (NF) c<strong>on</strong>centrate from the UF permeate.<br />
The results of the tests are graphically depicted in Figure 7. In each of these cases, the glucose<br />
was not reacted as readily as the reagent glucose. An overwhelming inhibiti<strong>on</strong> or catalyst<br />
pois<strong>on</strong>ing occurred, apparently due to <strong>on</strong>e or another of the trace comp<strong>on</strong>ents in the <strong>wheat</strong>derived<br />
products. Recovery and reuse of the catalyst with a reagent glucose feedstock showed<br />
that the effect <strong>on</strong> the catalyst was not permanent as a high activity for hydrogenati<strong>on</strong> to sorbitol<br />
was found up<strong>on</strong> reuse.<br />
The <strong>wheat</strong> millfeed hydrolysis products (filter press product, UF permeate, and NF c<strong>on</strong>centrate)<br />
were treated with a carb<strong>on</strong> adsorpti<strong>on</strong> bed to determine what comp<strong>on</strong>ents could be removed by<br />
such a process and what effect <strong>on</strong> the catalyst there might be by such a removal. The carb<strong>on</strong><br />
treatment involved passing the hydrolysate soluti<strong>on</strong> through a column of carb<strong>on</strong> particles. The<br />
passage was by gravity flow downward and required a c<strong>on</strong>tact time of about 2 minutes. The<br />
carb<strong>on</strong> was Norit RO 0.8, ~80 mL, in the first case, and Norit ROX 0.8, ~100 mL, in the sec<strong>on</strong>d<br />
case. They are similar steam-treated carb<strong>on</strong> extrudates with the ROX being acid-washed as well.<br />
The first carb<strong>on</strong> was used to treat the UF permeate. The carb<strong>on</strong> bed was first wet with dei<strong>on</strong>ized<br />
water. The hydrolysate was added as a light yellow, slightly cloudy liquid; it was recovered with
97.0<br />
percent<br />
77.0<br />
57.0<br />
37.0<br />
17.0<br />
glucose reagent 1<br />
glucose reagent 2<br />
UF permeate<br />
UF perm carb treat #1<br />
UF perm carb treat #2<br />
NF c<strong>on</strong>centrate<br />
NF c<strong>on</strong>c carb treat<br />
filter press product<br />
filter press carb treat<br />
-3.0<br />
0 1 2 3 4 5 6 7<br />
time at temperature, hr<br />
Figure 7. Millfeed Glucose C<strong>on</strong>versi<strong>on</strong> by Catalytic Hydrogenati<strong>on</strong><br />
carb<strong>on</strong> powder and required a filtrati<strong>on</strong> (0.45 micr<strong>on</strong> nyl<strong>on</strong> filter) to produce a clear, off-white<br />
liquid. With the sec<strong>on</strong>d carb<strong>on</strong>, the UF permeate was recovered without carb<strong>on</strong> powder<br />
carryover as a slightly cloudy, off-white liquid. The carb<strong>on</strong> bed from the sec<strong>on</strong>d case was<br />
subsequently used to treat both the NF c<strong>on</strong>centrate and the filter press product. The NF<br />
c<strong>on</strong>centrate was dark yellow and cloudy with a bit of light colored precipitate and was<br />
decolorized to a light yellow, slightly cloudy liquid. The filter press product was dark orange,<br />
cloudy with light colored precipitate and was just about the same (as dark colored, slightly less<br />
cloudy) after the carb<strong>on</strong> treatment. The results of the chemical analyses completed before and<br />
after the carb<strong>on</strong> treatments are given in Table 8. These results clearly show that the carb<strong>on</strong> bed<br />
did remove some of the comp<strong>on</strong>ents, most significantly the protein and sulfur. The sulfur effect<br />
was c<strong>on</strong>firmed by the sulfate analyses. The metals were less affected. The phosphorus also<br />
appeared to be little affected <str<strong>on</strong>g>based</str<strong>on</strong>g> <strong>on</strong> both elemental phosphorus and phosphate analyses.<br />
Chloride (and possibly sodium) c<strong>on</strong>tent was increased by the treatment with the carb<strong>on</strong>, most<br />
noticeably in the nanofiltrati<strong>on</strong> c<strong>on</strong>centrate, which was essentially chloride-free following the<br />
membrane filtrati<strong>on</strong>.<br />
These carb<strong>on</strong> treated products were used as feedstock for catalytic testing and compared to the<br />
untreated products and reagent glucose. The results (see Figure 7.) show greatly improved<br />
c<strong>on</strong>versi<strong>on</strong> with the carb<strong>on</strong> treatment of both the UF permeate and NF c<strong>on</strong>centrate, while the<br />
filter press product was still unc<strong>on</strong>vertible. The combinati<strong>on</strong> of ultrafiltrati<strong>on</strong> and carb<strong>on</strong><br />
treatment appears to produce a glucose feedstock nearly equivalent to reagent glucose <str<strong>on</strong>g>based</str<strong>on</strong>g> <strong>on</strong><br />
these short-term batch test results. The nanofiltrati<strong>on</strong> c<strong>on</strong>centrate shows value in increasing the<br />
c<strong>on</strong>centrati<strong>on</strong> of the glucose product stream. However, it is apparent in the more c<strong>on</strong>centrated<br />
product that the residual materials from the ultrafiltrati<strong>on</strong> still inhibit catalyst activity.
Table 8. Analyses of <strong>wheat</strong> millfeed hydrolysates before and after carb<strong>on</strong> treatment<br />
comp<strong>on</strong>ent UF<br />
permeate<br />
UF perm<br />
carb treat<br />
NF<br />
c<strong>on</strong>centrate<br />
NF c<strong>on</strong>c<br />
carb treat<br />
Filter press<br />
product<br />
Filter press<br />
carb treat<br />
protein 0.3 % 0.12 % 0.62 % 0.08 % 0.75 % 0.35 %<br />
nitrate NA 0.6 NA 2.2 NA 1.5<br />
calcium 39 33 165 117 44 36<br />
magnesium 200 210 523 490 233 280<br />
potassium 1050 1500 2370 2600 1170 1600<br />
sodium 18 70 23 43 17 19<br />
chloride 56 200 0 72 56 96<br />
orthophosphate NA 377 NA 991 NA 477<br />
total phosphorus 510 536 1180 1201 561 587<br />
sulfate 1080 164 2940 361 1100 160<br />
total sulfur 305 74 819 117 406 65<br />
C<strong>on</strong>taminant Model Chemical Tests: Based <strong>on</strong> the analyses d<strong>on</strong>e <strong>on</strong> the <strong>wheat</strong> millfeed-derived<br />
products, there were numerous potential problem comp<strong>on</strong>ents. These (shown in Table 8)<br />
included sulfate (potential for metal sulfide formati<strong>on</strong>); calcium, magnesium and phosphate<br />
(potential for catalyst pore plugging by insoluble salt precipitati<strong>on</strong>); sodium or potassium (alkali<br />
attack <strong>on</strong> the catalyst support); organic nitrogen comp<strong>on</strong>ents, such as amino acids (thiol source<br />
for metal sulfide formati<strong>on</strong>), proteins (pore plugging by precipitati<strong>on</strong> of denatured forms) or urea<br />
(metal complex formati<strong>on</strong>); chloride (reacti<strong>on</strong> with the metal); phytic acid or sodium phytate<br />
(decompose and precipitate as phosphate) or maltose and maltodextrins (pore plugging or<br />
catalytic site plugging).<br />
We completed more definitive analyses of the hydrolysate UF permeate for nitrogenous<br />
compounds. Our attempts at protein analysis appeared to show little protein in the hydrolysate<br />
UF permeate (50 ppm by the Bradford dye-binding assay), c<strong>on</strong>trary to the nitrogen analysis<br />
(0.27-0.30% by Kjeldahl nitrogen). The remaining nitrogen is apparently present as individual<br />
amino acids or as very low molecular weight proteins or protein hydrolysis fragments (e.g. urea).<br />
A measurement of the cysteine c<strong>on</strong>tent showed it below the level of detecti<strong>on</strong>.<br />
Tests were completed with chemical models of the various comp<strong>on</strong>ents to attempt to identify the<br />
cause of catalyst inactivity. The results of the tests with these comp<strong>on</strong>ents are summarized in the<br />
Table 9 below. No comp<strong>on</strong>ent has yet been identified as the offending material. The inorganic<br />
comp<strong>on</strong>ents were added as salts to the feedstock soluti<strong>on</strong>. The phytic is a phosphorylated<br />
cyclohexanehexitol, which is found in <strong>wheat</strong>. It had no effect in either the acid or sodium salt<br />
form. Only the cysteine shows a deactivati<strong>on</strong> of the catalyst; however, its deactivati<strong>on</strong> is not<br />
reversible as was found with the <strong>wheat</strong>-derived material. Although cysteine is identified as a<br />
comp<strong>on</strong>ent of <strong>wheat</strong> protein structures, it is not likely that it would be found as the cysteine in<br />
the filtrati<strong>on</strong> products. More likely, it would be present as the bridged disulfide cystine<br />
following the oxidative reacti<strong>on</strong>s in the processing. As cystine, there is no free thiol available to<br />
react with the catalyst metal and therefore, no mechanism for catalyst deactivati<strong>on</strong>.
These tests and the compani<strong>on</strong> chemical analyses suggest that the catalyst activity problem does<br />
not result from any of the inorganic comp<strong>on</strong>ents. The carbohydrate structures also appear to<br />
have little affect <strong>on</strong> activity. The nitrogenous materials are the <strong>on</strong>e comp<strong>on</strong>ent significantly<br />
affected by the carb<strong>on</strong> treatment, which may not be adequately modeled in the tests thus far.<br />
Table 9. Testing results with trace c<strong>on</strong>taminants in glucose<br />
c<strong>on</strong>taminant form amount, ppm amount in hydrolysate UF<br />
permeate<br />
reducti<strong>on</strong> in<br />
c<strong>on</strong>versi<strong>on</strong><br />
Sodium sulfate 1000 18 N<strong>on</strong>e<br />
Calcium hydroxide 100 77 N<strong>on</strong>e<br />
Magnesium hydroxide 400 209 N<strong>on</strong>e<br />
Potassium sulfate 1050 1050 N<strong>on</strong>e<br />
Phosphorus phosphoric acid 950 510 N<strong>on</strong>e<br />
Phosphorus phytic acid 430 510 N<strong>on</strong>e<br />
Phosphorus dodeca-sodium phytate 550 510 N<strong>on</strong>e<br />
Sulfate sodium sulfate 1000 1050 N<strong>on</strong>e<br />
Chloride sodium chloride 49 56 N<strong>on</strong>e<br />
Kjeldahl N urea 470 425 N<strong>on</strong>e<br />
Cysteine l-cysteine 200 200, <str<strong>on</strong>g>based</str<strong>on</strong>g> <strong>on</strong> <strong>wheat</strong> analysis;<br />
n<strong>on</strong>e expected<br />
95-99%<br />
Cysteine dl-cystine 200 200, <str<strong>on</strong>g>based</str<strong>on</strong>g> <strong>on</strong> <strong>wheat</strong> analysis N<strong>on</strong>e<br />
Maltose crystalline 10,000 3000 N<strong>on</strong>e<br />
Maltotriose crystalline 10,000 2000 N<strong>on</strong>e<br />
Glucose oligomer maltodextrin 4-7 10,000 NA N<strong>on</strong>e<br />
Starch oligomer maltodextrin 13-17 10,000 NA N<strong>on</strong>e<br />
Process and Product Assessment from CRADA Partners<br />
Initial ec<strong>on</strong>omic modeling of the starch extracti<strong>on</strong> and glucose recovery process was d<strong>on</strong>e as part<br />
of this project. The model <str<strong>on</strong>g>development</str<strong>on</strong>g> included material and energy balances built into a<br />
virtual process simulator <str<strong>on</strong>g>based</str<strong>on</strong>g> <strong>on</strong> Excel and Visual Basic. Equipment sizing and costing<br />
calculati<strong>on</strong>s were dynamic in nature and adjusted with changes in the mass balance. Capital<br />
investment costs and operating costs were also estimated. Using the model, sensitivity analyses<br />
could be undertaken as well as comparis<strong>on</strong>s with other technology opti<strong>on</strong>s.<br />
The model was used to cost a midwest green field site processing a moderate 227,273 t<strong>on</strong>ne per<br />
year of millfeed. The yield of glucose was 68,182 t<strong>on</strong>ne per year with 149,091 t<strong>on</strong>ne per year of<br />
animal feed and 17,727 t<strong>on</strong>ne per year of high-protein feed supplement. The plant capital cost<br />
estimate is $34 milli<strong>on</strong>. Using a range of values for the byproducts, a range of costs and prices<br />
for the millfeed-derived glucose product were generated. As given in Table 10, these range<br />
around the current costs and prices for corn-derived glucose, which are given at the bottom of the<br />
table for comparis<strong>on</strong>. The corn costs and prices are <str<strong>on</strong>g>based</str<strong>on</strong>g> <strong>on</strong> a much larger (typical) corn wet<br />
mill producing 1,081,818 t<strong>on</strong>ne per year of glucose. Capital costs at the different scales of<br />
operati<strong>on</strong> are the major differentiating factors between the two glucose sources.
Table 10 Millfeed-Derived Glucose Costs and Prices<br />
By-Product Credits Variable Cost Producti<strong>on</strong> Cost Selling Price<br />
Low-end of<br />
estimate<br />
7.5 cents/lb<br />
(16.5 cents/kg)<br />
9.1 cents/lb<br />
(20.0 cents/kg)<br />
12.3 cents/lb<br />
(27.1 cents/kg)<br />
High-end of<br />
estimate<br />
5.8 cents/lb<br />
(12.8 cents/kg)<br />
7.3 cents/lb<br />
(16.1 cents/kg)<br />
10.6 cents/lb<br />
(23.3 cents/kg)<br />
Corn-derived<br />
glucose<br />
6.4 cents/lb<br />
(14.1 cents/kg)<br />
7.0 cents/lb<br />
(15.4 cents/kg)<br />
7.6 cents/lb<br />
(16.7 cents/kg)<br />
Acknowledgement<br />
The results presented here were generated as part of a Cooperative Research and Development<br />
Agreement (CRADA) am<strong>on</strong>g Pacific Northwest Nati<strong>on</strong>al Laboratory 1 , Pendlet<strong>on</strong> Flour Mills<br />
LLC. and The Mennel Milling Company and including subc<strong>on</strong>tractor ProForma Systems, Inc.<br />
1 Pacific Northwest Nati<strong>on</strong>al Laboratory is operated by Battelle for the U.S. Department of Energy under C<strong>on</strong>tract<br />
DE-AC06-76RL0 1830