

The Spectrally Tunable LED light Source â Design ... - PMOD/WRC
The Spectrally Tunable LED light Source â Design ... - PMOD/WRC
The Spectrally Tunable LED light Source â Design ... - PMOD/WRC

You also want an ePaper? Increase the reach of your titles
YUMPU automatically turns print PDFs into web optimized ePapers that Google loves.
<strong>The</strong> <strong>Spectrally</strong> <strong>Tunable</strong> <strong>LED</strong> <strong>light</strong> <strong>Source</strong> – <strong>Design</strong> and Development Issue<br />
I. Fryc 1 , S. W. Brown and Y. Ohno<br />
National Institute of Standards and Technology, Gaithersburg, MD 20899, USA<br />
1 Guest Scientist from the Bialystok University of Technology, Bialystok, Poland<br />
Abstract. A spectrally tunable <strong>light</strong> source using a large<br />
number of <strong>LED</strong>s and an integrating sphere has been<br />
developed at the National Institute of Standards and<br />
Technology (NIST). <strong>The</strong> source is designed to have a<br />
capability of producing any spectral distribution,<br />
mimicking various <strong>light</strong> sources in the visible region by<br />
feedback control of the radiant power emitted by<br />
individual <strong>LED</strong>s. <strong>The</strong> spectral irradiance or radiance of the<br />
source is measured by a standard reference instrument; the<br />
source will be used as a transfer standard for colorimetric,<br />
photometric and radiometric applications. <strong>Source</strong><br />
distributions have been realized for a number of target<br />
distributions.<br />
Introduction<br />
Photometric and colorimetric quantities of a <strong>light</strong><br />
source can be measured with a spectroradiometer<br />
(calculated from its spectral power distribution) or with a<br />
photometer or a colorimeter that have a relative spectral<br />
responsivity approximated to the spectral luminous<br />
efficiency function, V ( λ)<br />
, or the color matching functions<br />
defined by the CIE 1, 2 . <strong>The</strong> spectral correction filter is an<br />
essential component of a photometer or colorimeter.<br />
Tristimulus colorimeters typically use three or four<br />
channels of detectors with filters to mimic the CIE color<br />
matching functions. No photometer or colorimeter exactly<br />
matches their spectral responsivities to V ( λ)<br />
or the color<br />
matching functions. Due to this imperfect matching of the<br />
spectral responsivities, measurement errors are inevitable.<br />
<strong>The</strong>se measurement errors can increase dramatically when<br />
the relative spectral power distribution (SPD) of a test<br />
source is dissimilar from that of the calibration source.<br />
Such spectral mismatch errors will be minimized by<br />
calibrating the photometer or colorimeter with standard<br />
sources having similar spectra as the source to be<br />
measured. Spectroradiometers also have various sources of<br />
error including stray <strong>light</strong>, and these errors can be<br />
minimized by calibrating the instrument with a standard<br />
source having similar spectra as the source being<br />
measured.<br />
A spectrally tunable source, capable of matching the<br />
Spectral Power Distribution (SPD) of a variety of <strong>light</strong><br />
sources, would enable accurate and rapid calibration of<br />
colorimeters or photometers used to measure various types<br />
of sources. Such a spectrally tunable source using multiple<br />
<strong>LED</strong>s has been designed and constructed at the National<br />
Institute of Standards and Technology (NIST). Utilizing<br />
<strong>LED</strong>s with different peak wavelengths and spectral power<br />
distributions, it is possible to make a spectrally tunable<br />
<strong>light</strong> source 3 (STS) capable of providing a high fidelity<br />
spectral match to given "target" SPDs 4 . <strong>The</strong> STS is able to<br />
approximate the distributions of a wide variety of <strong>light</strong><br />
sources, including day<strong>light</strong> illuminants, with high spectral<br />
fidelity. In this paper, we present the construction and<br />
performance of the <strong>LED</strong>-based STS that has been<br />
developed.<br />
1. Construction of the STS<br />
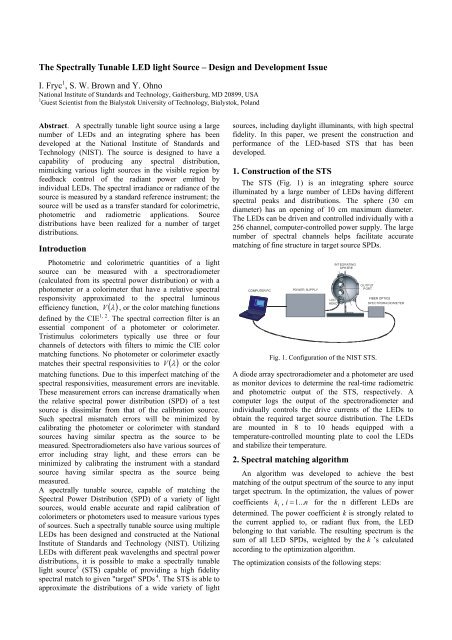
<strong>The</strong> STS (Fig. 1) is an integrating sphere source<br />
illuminated by a large number of <strong>LED</strong>s having different<br />
spectral peaks and distributions. <strong>The</strong> sphere (30 cm<br />
diameter) has an opening of 10 cm maximum diameter.<br />
<strong>The</strong> <strong>LED</strong>s can be driven and controlled individually with a<br />
256 channel, computer-controlled power supply. <strong>The</strong> large<br />
number of spectral channels helps facilitate accurate<br />
matching of fine structure in target source SPDs.<br />
KOMPUTER<br />
COMPUTER<br />
PC<br />
PC<br />
PO WER SUPPLY<br />
<strong>LED</strong><br />
HEAD<br />
INT EGRATING<br />
SPHERE<br />
OUTPUT<br />
PORT<br />
Fig. 1. Configuration of the NIST STS.<br />
FIBER FIBRE OPTICS OPTICS<br />
SPECTRORADIOMETER<br />
A diode array spectroradiometer and a photometer are used<br />
as monitor devices to determine the real-time radiometric<br />
and photometric output of the STS, respectively. A<br />
computer logs the output of the spectroradiometer and<br />
individually controls the drive currents of the <strong>LED</strong>s to<br />
obtain the required target source distribution. <strong>The</strong> <strong>LED</strong>s<br />
are mounted in 8 to 10 heads equipped with a<br />
temperature-controlled mounting plate to cool the <strong>LED</strong>s<br />
and stabilize their temperature.<br />
2. Spectral matching algorithm<br />
An algorithm was developed to achieve the best<br />
matching of the output spectrum of the source to any input<br />
target spectrum. In the optimization, the values of power<br />
coefficients k i , i = 1...<br />
n for the n different <strong>LED</strong>s are<br />
determined. <strong>The</strong> power coefficient k is strongly related to<br />
the current applied to, or radiant flux from, the <strong>LED</strong><br />
belonging to that variable. <strong>The</strong> resulting spectrum is the<br />
sum of all <strong>LED</strong> SPDs, weighted by the k ’s calculated<br />
according to the optimization algorithm.<br />
<strong>The</strong> optimization consists of the following steps:
1) Select the initial values of power coefficients<br />
( 0<br />
k<br />
)<br />
i , i = 1...<br />
n of i-th <strong>LED</strong>; they can be any positive<br />
number.<br />
2) Calculate the j -th value of k i from the (j-1)-th<br />
value, based on the partial derivative with respect to k i<br />
of the square of the difference between the target<br />
spectrum and the STS spectrum built up from the <strong>LED</strong><br />
spectra weighted by the variables k:<br />
( )<br />
( j−1<br />
j<br />
)<br />
k = k − a<br />
i<br />
i<br />
⎛<br />
⎜<br />
⎝<br />
780 n<br />
ki<br />
380 i=<br />
1<br />
∂ ∑ ∑<br />
( j −1) S ( λ) − S ( λ)<br />
<strong>LED</strong><br />
i<br />
( j −1<br />
∂k<br />
)<br />
i<br />
TARGET<br />
where a should be between 0 and 1. To<br />
achieve an optimal calculation time while still<br />
ensuring convergence of the solution, a<br />
parameter was set to 0.001.<br />
3) Continue the iterations until the solution<br />
converges, i.e. when<br />
780 n<br />
i <strong>LED</strong>i<br />
380 i=<br />
1<br />
780 n<br />
= i <strong>LED</strong>i<br />
380 i=<br />
1<br />
( j) ∑∑k<br />
S ( λ) − S ( λ)<br />
TARGET<br />
( j−1) ∑∑k<br />
S ( λ) − S ( λ)<br />
TARGET<br />
<strong>The</strong> equality is obtained from a large number of iterations<br />
where the individual <strong>LED</strong> currents (power coefficients k)<br />
are increased or decreased in small increments. It can be<br />
interpreted that the algorithm stops when the values k i<br />
reach a steady-state solution. <strong>The</strong> individual <strong>LED</strong> currents<br />
are obtained from the optimization. <strong>The</strong> integral-sum of<br />
the differences at each wavelength is an indication of the<br />
quality of the realized spectral match.<br />
3. Realized STS spectral distributions<br />
Figs. 2 to 4 shows examples of the output spectra of the<br />
STS source matched to the given spectra. <strong>The</strong> deviations<br />
from the given spectra are mainly caused by limitations in<br />
the availability of <strong>LED</strong>s with the appropriate peak<br />
wavelengths, their finite spectral widths (SPD curves), as<br />
well as drifts due to temperature dependence, instability,<br />
and aging of the <strong>LED</strong>s. <strong>The</strong> matching will be improved by<br />
changing the selection of <strong>LED</strong>s used. <strong>The</strong> average<br />
luminance of the STS, which depends on the specific<br />
spectral distribution desired, is between several hundred<br />
-2<br />
and one thousand [ cd ⋅ m ]. Further results of<br />
characterizaion of the STS source developed will be<br />
presented in the full paper.<br />
4. Conclusions<br />
A spectrally tunable <strong>LED</strong> source (STS) has been<br />
developed. <strong>The</strong> source can approximate various CIE<br />
illuminants (D65, etc.) as well as common source spectral<br />
distributions for other photometric and colorimetric<br />
applications, and may be useful for visual experiments on<br />
colorimetry as well.<br />
⎞<br />
⎟<br />
⎠<br />
2<br />
,<br />
Relative distribution<br />
1.2<br />
1.0<br />
0.8<br />
0.6<br />
0.4<br />
0.2<br />
0.0<br />
350 450 550 650 750<br />
Wavelength (nm)<br />
Fig. 2. SPD of CIE illuminant D65 (dashed line) and the STS<br />
output measured by spectroradiometer (solid line).<br />
Relative distribution<br />
1.2<br />
1.0<br />
0.8<br />
0.6<br />
0.4<br />
0.2<br />
0.0<br />
350 450 550 650 750<br />
Wavelength (nm)<br />
Fig. 3. SPD of a CRT green (dashed line) and the STS output<br />
measured by spectroradiometer (solid line).<br />
Relative distribution<br />
1.2<br />
1.0<br />
0.8<br />
0.6<br />
0.4<br />
0.2<br />
0.0<br />
350 450 550 650 750<br />
Wavelength (nm)<br />
Fig. 4. SPD of a Cool White FL (dashed line) and the STS output<br />
measured by spectroradiometer (solid line).<br />
References<br />
[1] ISO/CIE 10527-1991, CIE standard colorimetric observers,<br />
1991.<br />
[2] ISO/CIE 10526-1991, CIE standard colorimetric illuminants,<br />
1991.<br />
[3] S. W. Brown, C. Santana, and G. P. Eppeldauer, Development<br />
of a tunable <strong>LED</strong>-based colorimetric source, J. Res. Nat’l. Inst.<br />
Stands. Technol. 107, 363-371, 2002.<br />
[4] I. Fryc, S. W. Brown, G. P. Eppeldauer, Y. Ohno, A spectrally<br />
tunable solid-state source for radiometric, photometric, and<br />
colorimetric applications, Proceedings of SPIE, 5530, 150 –<br />
159, 2004.


