

Here - PMOD/WRC
Here - PMOD/WRC
Here - PMOD/WRC

Create successful ePaper yourself
Turn your PDF publications into a flip-book with our unique Google optimized e-Paper software.
Operational mode uncertainty for broadband erythemal UV radiometers<br />
L.Vuilleumier<br />
MeteoSwiss, Payerne, Switzerland<br />
J. Gröbner<br />
Physikalisch-Meteorologisches Observatorium Davos, World Radiation Centre, Davos Dorf, Switzerland<br />
Abstract. Recommendations for measuring UV erythemal<br />
irradiance with broadband radiometers require the instruments<br />
to be calibrated by comparison to a traceable<br />
absolute spectral irradiance reference, taking into account<br />
the difference between the instrument spectral response and<br />
the theoretical CIE erythemal response [e.g., WMO, 1996].<br />
Three instruments were calibrated according to these recommendations<br />
by two different centers and were subsequently<br />
measuring side by side in operational mode during<br />
a test period. The reproducibility of observations made<br />
according to the recommendations could then be checked,<br />
and was found to be compatible with the usually quoted<br />
uncertainty of 5-10%.<br />
Introduction<br />
In the framework of the Swiss Atmospheric Radiation<br />
Monitoring program (CHARM) of MeteoSwiss, UV erythemally-weighted<br />
broadband irradiance is measured using<br />
SolarLight 501A UV broadband radiometers (biometers).<br />
Three instruments (SL1903, SL1904 and SL1905) were<br />
chosen to be used as reference at MeteoSwiss based on the<br />
availability of past characterizations and stability. One instrument<br />
(SL1903) was sent for characterization to the<br />
European Reference Centre for Ultraviolet Radiation<br />
measurements (ECUV) from the Joint Research Centre at<br />
Ispra, Italy, while the two others were sent to the U.S. Central<br />
UV Calibration Facility (CUCF) at Boulder, U.S.A.<br />
After characterization at the calibration centers, the three<br />
biometers were installed in parallel at the Payerne site for<br />
measurement of global UV radiation between 31 August<br />
and 5 October 2004. The signals were sampled constantly<br />
at a 1 Hz frequency with 1-min averages recorded.<br />
Results from the comparisons between the three biometers<br />
for 14 clear-sky days are reported here. The uncertainty<br />
of well characterized biometers is estimated to be on<br />
the order of 5-10% [Lantz et al, 1999]. The goal of the<br />
analysis reported here is to verify whether the agreement<br />
between biometers characterized at different centers and<br />
operating in standard network measurements conditions is<br />
compatible with the stated uncertainty<br />
Spectral characterization of the biometers<br />
The three biometers were initially characterized by the<br />
manufacturer prior to 1997 and underwent a second characterization<br />
at a Swiss facility (Novartis) between the end<br />
of 1998 and the beginning of 1999. They were characterized<br />
a third time before their calibration at CUCF or ECUV<br />
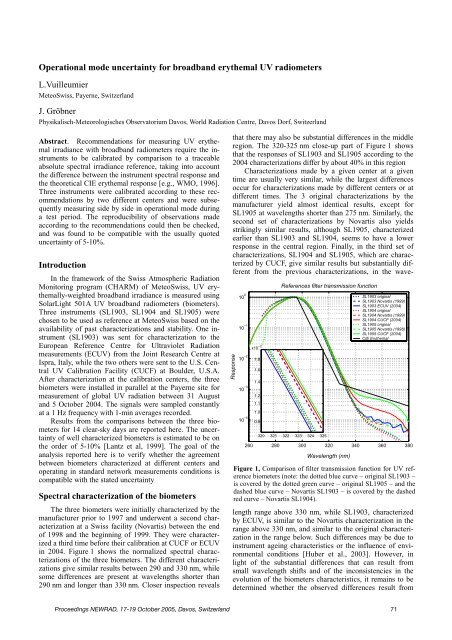
in 2004. Figure 1 shows the normalized spectral characterizations<br />
of the three biometers. The different characterizations<br />
give similar results between 290 and 330 nm, while<br />
some differences are present at wavelengths shorter than<br />
290 nm and longer than 330 nm. Closer inspection reveals<br />
Response<br />
References filter transmission function<br />
SL1903 original<br />
SL1903 Novartis (1999)<br />
SL1903 ECUV (2004)<br />
SL1904 original<br />
SL1904 Novartis (1999)<br />
SL1904 CUCF (2004)<br />
SL1905 original<br />
SL1905 Novartis (1998)<br />
SL1905 CUCF (2004)<br />
CIE Erythemal<br />
10 −1<br />
x10 −2<br />
10 −2 1.8<br />
1.6<br />
1.4<br />
10 −3<br />
1.2<br />
1.1<br />
1.0<br />
10 −4<br />
0.9<br />
320 321 322 323 324 325<br />
260 280 300 320 340 360 380<br />
10 0 Wavelength (nm)<br />
Figure 1, Comparison of filter transmission function for UV reference<br />
biometers (note: the dotted blue curve – original SL1903 –<br />
is covered by the dotted green curve – original SL1905 – and the<br />
dashed blue curve – Novartis SL1903 – is covered by the dashed<br />
red curve – Novartis SL1904).<br />
that there may also be substantial differences in the middle<br />
region. The 320-325 nm close-up part of Figure 1 shows<br />
that the responses of SL1903 and SL1905 according to the<br />
2004 characterizations differ by about 40% in this region<br />
Characterizations made by a given center at a given<br />
time are usually very similar, while the largest differences<br />
occur for characterizations made by different centers or at<br />
different times. The 3 original characterizations by the<br />
manufacturer yield almost identical results, except for<br />
SL1905 at wavelengths shorter than 275 nm. Similarly, the<br />
second set of characterizations by Novartis also yields<br />
strikingly similar results, although SL1905, characterized<br />
earlier than SL1903 and SL1904, seems to have a lower<br />
response in the central region. Finally, in the third set of<br />
characterizations, SL1904 and SL1905, which are characterized<br />
by CUCF, give similar results but substantially different<br />
from the previous characterizations, in the wavelength<br />
range above 330 nm, while SL1903, characterized<br />
by ECUV, is similar to the Novartis characterization in the<br />
range above 330 nm, and similar to the original characterization<br />
in the range below. Such differences may be due to<br />
instrument ageing characteristics or the influence of environmental<br />
conditions [Huber et al., 2003]. However, in<br />
light of the substantial differences that can result from<br />
small wavelength shifts and of the inconsistencies in the<br />
evolution of the biometers characteristics, it remains to be<br />
determined whether the observed differences result from<br />
Proceedings NEWRAD, 17-19 October 2005, Davos, Switzerland 71


