Tree age estimates in Fagus sylvatica and Quercus robur: testing ...
Tree age estimates in Fagus sylvatica and Quercus robur: testing ...
Tree age estimates in Fagus sylvatica and Quercus robur: testing ...

Create successful ePaper yourself
Turn your PDF publications into a flip-book with our unique Google optimized e-Paper software.
Plant Ecology 167: 193–212, 2003.<br />
© 2003 Kluwer Academic Publishers. Pr<strong>in</strong>ted <strong>in</strong> the Netherl<strong>and</strong>s.<br />
193<br />
<strong>Tree</strong> <strong>age</strong> <strong>estimates</strong> <strong>in</strong> <strong>Fagus</strong> <strong>sylvatica</strong> <strong>and</strong> <strong>Quercus</strong> <strong>robur</strong>: test<strong>in</strong>g previous<br />
<strong>and</strong> improved methods<br />
Vicente Rozas<br />
Departamento de Biología de Organismos y Sistemas, Universidad de Oviedo, Catedrático Rodrigo Uría,<br />
E-33071 Oviedo, Spa<strong>in</strong> (e-mail: vrozas@sci.cpd.uniovi.es; phone: +34 985 10 48 27; fax: +34 985 10 48 65)<br />
Received 9 February 2001; accepted <strong>in</strong> revised form 29 November 2001<br />
Key words: Cross-dat<strong>in</strong>g, Dendroecology, Increment cores, Population dynamics, Radial-growth geometry, <strong>Tree</strong><br />
r<strong>in</strong>gs<br />
Abstract<br />
The accuracy of direct (based on <strong>in</strong>crement cores) <strong>and</strong> <strong>in</strong>direct (based on <strong>age</strong>-size relationships) methods of tree<br />
<strong>age</strong> estimation <strong>in</strong> <strong>Fagus</strong> <strong>sylvatica</strong> <strong>and</strong> <strong>Quercus</strong> <strong>robur</strong> was tested. This was done through <strong>in</strong>crement cores <strong>and</strong><br />
stem discs taken <strong>in</strong> an old-growth forest of Northern Spa<strong>in</strong>. It was found that cross-dat<strong>in</strong>g was more precise than<br />
r<strong>in</strong>g count<strong>in</strong>g by up to 7 years per tree. Furthermore, cross-dat<strong>in</strong>g permitted the estimation of the <strong>age</strong> of trees<br />
with float<strong>in</strong>g r<strong>in</strong>g-width series, which were 7% of cored F. <strong>sylvatica</strong> <strong>and</strong> 40% of Q. <strong>robur</strong> ones. In partial cores<br />
with the arcs of the <strong>in</strong>ner r<strong>in</strong>gs, the length of the miss<strong>in</strong>g radius was estimated with both a geometric method,<br />
based on the curvature of the arcs, <strong>and</strong> a new graphical method, based on the convergence of xylem rays at the<br />
pith. The graphical method was more accurate when the radial growth was eccentric, as happens <strong>in</strong> Q. <strong>robur</strong>,<br />
while both methods showed a similar accuracy for F. <strong>sylvatica</strong>, whose growth is relatively concentric. Empirical<br />
models of <strong>in</strong>itial radial growth (IRG), built to estimate the number of miss<strong>in</strong>g r<strong>in</strong>gs, reduced the errors associated<br />
with other methods that assume constant growth rates. Age <strong>estimates</strong> obta<strong>in</strong>ed from the graphical method comb<strong>in</strong>ed<br />
with the IRG models were with<strong>in</strong> 4% of the actual <strong>age</strong>. This comb<strong>in</strong>ation ensured <strong>age</strong> <strong>estimates</strong> with a<br />
mean accuracy of 8 years for 98% of the F. <strong>sylvatica</strong> trees, <strong>and</strong> 4 years for 89% of the Q. <strong>robur</strong>. In partial cores<br />
without the arcs of the <strong>in</strong>ner r<strong>in</strong>gs, the length of the miss<strong>in</strong>g radius was estimated as the distance to the geometric<br />
centre of the tree. In that case, <strong>age</strong> <strong>estimates</strong> obta<strong>in</strong>ed by extrapolat<strong>in</strong>g the mean growth rate of the 20 <strong>in</strong>nermost<br />
r<strong>in</strong>gs <strong>in</strong> the cores were from 10 to 20% of actual <strong>age</strong>, which co<strong>in</strong>cided with results obta<strong>in</strong>ed <strong>in</strong> other tree<br />
species with this method. F<strong>in</strong>ally, the <strong>age</strong>-diameter equations of the different cohorts produced better <strong>age</strong> <strong>estimates</strong><br />
(from 8 to 14% of actual <strong>age</strong>) than equations of the population as a whole (from 20 to 40% of actual <strong>age</strong>).<br />
These results proved that the errors derived from doubtful assumptions, such as concentric radial growth, constant<br />
growth <strong>and</strong> recruitment rates, or the absence of anomalous r<strong>in</strong>gs, could be reduced by apply<strong>in</strong>g more realistic<br />
methods of tree <strong>age</strong> estimation.<br />
Introduction<br />
Accurate <strong>age</strong> estimation is a key methodological restriction<br />
<strong>in</strong> plant population dynamics research. It is<br />
possible to determ<strong>in</strong>e <strong>age</strong> by us<strong>in</strong>g annual r<strong>in</strong>gs <strong>in</strong> the<br />
perennial parts of many herbaceous dicotyledonous<br />
plants, such as <strong>in</strong> the secondary root xylem (Dietz <strong>and</strong><br />
Ullmann 1997). But <strong>in</strong> the majority of herbaceous<br />
perennials, <strong>in</strong>stead of estimat<strong>in</strong>g <strong>age</strong>, it is necessary<br />
to classify the <strong>in</strong>dividuals <strong>in</strong> several “life states” with<br />
different functional <strong>and</strong> reproductive characteristics<br />
(Harper 1977). In woody species with annual growth<br />
r<strong>in</strong>gs, <strong>age</strong> <strong>estimates</strong> can be achieved on the basis of<br />
the exact correspondence between each r<strong>in</strong>g <strong>and</strong> the<br />
calendar year <strong>in</strong> which it was formed (Stokes <strong>and</strong><br />
Smiley 1968). Annual radial growth occurs <strong>in</strong> almost<br />
all tree species grow<strong>in</strong>g <strong>in</strong> temperate latitudes of both<br />
hemispheres (Fritts 1976). Furthermore, seasonal radial<br />
growth occurrence <strong>and</strong> annual r<strong>in</strong>g development
194<br />
have been confirmed <strong>in</strong> some tropical tree species<br />
(Worbes 1999).<br />
The removal of basal stem discs or wedges is the<br />
only sampl<strong>in</strong>g technique that provides a complete radial<br />
growth series of all the studied <strong>in</strong>dividuals<br />
(Ågren <strong>and</strong> Zackrisson 1990; Lusk <strong>and</strong> Ogden 1992;<br />
Szeicz <strong>and</strong> MacDonald 1995). But obta<strong>in</strong><strong>in</strong>g, manipulat<strong>in</strong>g,<br />
<strong>and</strong> surfac<strong>in</strong>g stem discs is expensive <strong>and</strong><br />
very time consum<strong>in</strong>g. Disc removal is also a destructive<br />
technique, therefore it is impossible <strong>in</strong> many<br />
cases such as for protected tree species, <strong>in</strong> parks <strong>and</strong><br />
natural reserves, or <strong>in</strong> long-term research plots used<br />
for repeated diachronic censuses. The more rapid,<br />
economic, <strong>and</strong> respectful-to-the-environment sampl<strong>in</strong>g<br />
technique is the extraction of <strong>in</strong>crement cores.<br />
<strong>Tree</strong> <strong>age</strong> estimation based on <strong>in</strong>crement cores presents<br />
three major limitations which make it difficult<br />
to obta<strong>in</strong> the true <strong>age</strong> of an <strong>in</strong>dividual (Norton et al.<br />
1987; Duncan 1989; Norton <strong>and</strong> Ogden 1990; Veblen<br />
1992): (1) <strong>in</strong> some radial growth series it is possible<br />
to discover anomalous r<strong>in</strong>gs (double or absent) which<br />
cannot be identified from a s<strong>in</strong>gle core, (2) <strong>in</strong> a partial<br />
core, which does not <strong>in</strong>clude the pith, there is an<br />
unknown number of missed r<strong>in</strong>gs, <strong>and</strong> (3) <strong>in</strong> <strong>in</strong>crement<br />
cores taken above the level at which the tree was<br />
germ<strong>in</strong>ated, there is a loss of r<strong>in</strong>gs due to sampl<strong>in</strong>g<br />
height. In this paper issues relat<strong>in</strong>g to the first <strong>and</strong><br />
second of these restrictions are studied. In relation to<br />
the third restriction, several methods of correction for<br />
sampl<strong>in</strong>g height have been described <strong>and</strong> tested by<br />
(Wong <strong>and</strong> Lertzman 2001).<br />
When tree <strong>age</strong> estimation is achieved by r<strong>in</strong>g<br />
counts, the probable occurrence of anomalies <strong>in</strong> radial<br />
growth can distort the f<strong>in</strong>al estimate. Locally<br />
miss<strong>in</strong>g r<strong>in</strong>gs <strong>and</strong> false r<strong>in</strong>gs can be dist<strong>in</strong>guished <strong>in</strong><br />
stem discs by their discont<strong>in</strong>uity (Johnson <strong>and</strong> Fryer<br />
1989; Lusk <strong>and</strong> Ogden 1992). But on a s<strong>in</strong>gle <strong>in</strong>crement<br />
core these are not identifiable. The errors <strong>in</strong> <strong>age</strong><br />
<strong>estimates</strong> due to growth anomalies can be m<strong>in</strong>imized<br />
by tak<strong>in</strong>g the cores along the longest bole radius<br />
(Duncan 1989), or by perpendicular extraction of<br />
more than one core per tree (Mikan et al. 1994). However,<br />
with the st<strong>and</strong>ard cross-dat<strong>in</strong>g techniques<br />
(Stokes <strong>and</strong> Smiley 1968; Holmes 1983) the false or<br />
miss<strong>in</strong>g r<strong>in</strong>gs can be identified to give a correct estimation<br />
of the total number of r<strong>in</strong>gs on the cores<br />
(Frelich <strong>and</strong> Graumlich 1994; Szeicz <strong>and</strong> MacDonald<br />
1995; Kelly <strong>and</strong> Larson 1997).<br />
The most frequent causes of miss<strong>in</strong>g piths are the<br />
<strong>in</strong>correct alignment of the borer, a too short length of<br />
borer relative to bole radius, <strong>and</strong> rottenness of the tree<br />
centre. The <strong>in</strong>accuracy related to the uncerta<strong>in</strong> position<br />
of the chronological centre can be reduced by<br />
apply<strong>in</strong>g geometric or graphical methods to estimate<br />
its position (Duncan 1989; Baker 1992; Villalba <strong>and</strong><br />
Veblen 1997), or by assum<strong>in</strong>g that the pith co<strong>in</strong>cides<br />
with the geometric centre of tree bole (Norton et al.<br />
1987). In partial cores, <strong>in</strong> addition to the distance to<br />
the pith it is also necessary to estimate the number of<br />
r<strong>in</strong>gs <strong>in</strong> the miss<strong>in</strong>g core segment. To estimate the<br />
number of miss<strong>in</strong>g r<strong>in</strong>gs several methods have been<br />
applied: <strong>age</strong>-diameter regression curves (Lorimer<br />
1980), cumulative curves of radial growth (Villalba<br />
<strong>and</strong> Veblen 1997), <strong>and</strong> the extrapolation of the mean<br />
growth rate from either the central r<strong>in</strong>gs of neighbor<strong>in</strong>g<br />
trees (Nakashizuka <strong>and</strong> Numata 1982) or the <strong>in</strong>nermost<br />
r<strong>in</strong>gs <strong>in</strong> the core (Norton et al. 1987; Duncan<br />
1989; Frelich <strong>and</strong> Graumlich 1994).<br />
When a tree cannot be cored, or the obta<strong>in</strong>ed cores<br />
are unusable, then <strong>age</strong> <strong>estimates</strong> must be achieved<br />
through <strong>in</strong>direct methods, such as the regression of<br />
<strong>age</strong> upon stem diameter. The <strong>age</strong>-diameter relationship<br />
should be obta<strong>in</strong>ed from a large sample of trees,<br />
with the complete range of size classes be<strong>in</strong>g uniformly<br />
represented (Veblen 1992). However, <strong>in</strong> a<br />
given forest st<strong>and</strong> <strong>in</strong>dividuals with quite different<br />
growth rates often coexist (Stewart 1986), so that a<br />
great variation <strong>in</strong> the <strong>age</strong> of trees belong<strong>in</strong>g to the<br />
same size class is usual (Norton <strong>and</strong> Ogden 1990;<br />
Lusk <strong>and</strong> Smith 1998). Also, all the <strong>age</strong> <strong>estimates</strong>, as<br />
well as diameter measurements, are subject to error.<br />
Thus, each po<strong>in</strong>t <strong>in</strong> the <strong>age</strong>-diameter scatter diagrams<br />
is surrounded by an area of uncerta<strong>in</strong>ty which prevents<br />
the calculation of faithful predictive models of<br />
<strong>age</strong> from diameter (Ogden 1985).<br />
The purpose of this study is to underst<strong>and</strong> the errors<br />
associated with different methods of tree <strong>age</strong> estimation<br />
which can be applied <strong>in</strong> <strong>Fagus</strong> <strong>sylvatica</strong> <strong>and</strong><br />
<strong>Quercus</strong> <strong>robur</strong>. Different methods usually adopted <strong>in</strong><br />
the bibliography, as well as other orig<strong>in</strong>al procedures<br />
that are proposed <strong>in</strong> this work for the first time, were<br />
evaluated on stem discs of known <strong>age</strong>. The anomalous<br />
r<strong>in</strong>gs <strong>in</strong>cluded <strong>in</strong> the samples were identified by<br />
both visual <strong>and</strong> quantitative cross-dat<strong>in</strong>g aga<strong>in</strong>st a<br />
master chronology. Problems relat<strong>in</strong>g to the estimation<br />
of the length of miss<strong>in</strong>g radius <strong>and</strong> the number<br />
of miss<strong>in</strong>g r<strong>in</strong>gs <strong>in</strong> partial cores were studied. To estimate<br />
the position of the chronological centre, a<br />
graphical method based on ray’s convergence at the<br />
pith was developed. From a sample of cores that <strong>in</strong>cluded<br />
the pith, a model of <strong>in</strong>itial radial growth for<br />
each studied tree species was built to estimate the
195<br />
number of missed r<strong>in</strong>gs. Indirect methods of <strong>age</strong> estimation<br />
from diameter were also tested. From the results<br />
obta<strong>in</strong>ed, the quicker, more objective, <strong>and</strong> more<br />
accurate methods to estimate <strong>age</strong> <strong>in</strong> natural populations<br />
of F. <strong>sylvatica</strong> <strong>and</strong> Q. <strong>robur</strong>, are emphasized.<br />
Materials <strong>and</strong> methods<br />
Study area<br />
The materials employed <strong>in</strong> this work were taken <strong>in</strong><br />
the Caviedes forest, an old-growth 110 ha forest located<br />
<strong>in</strong> the coastal lowl<strong>and</strong>s of west Cantabria,<br />
Northern Spa<strong>in</strong> (43°20 N, 04°18 W). It belongs to<br />
the Oyambre Natural Park, <strong>and</strong> is to be found 6 km<br />
south of the coast, <strong>and</strong> 8 km north of the Escudo de<br />
Cabuérniga Range. The soils are deep s<strong>and</strong>y brown<br />
earths, with parent material of s<strong>and</strong>stone <strong>and</strong> clay<br />
formed <strong>in</strong> the lower Cretacean. The Caviedes forest<br />
is located on a north-east oriented slope <strong>in</strong>cl<strong>in</strong>ed 25°<br />
at maximum. The elevation of the site ranges from 40<br />
to 240 m above sea level. The dom<strong>in</strong>ant species are<br />
<strong>Fagus</strong> <strong>sylvatica</strong> <strong>and</strong> <strong>Quercus</strong> <strong>robur</strong>, both reach<strong>in</strong>g a<br />
maximum estimated <strong>age</strong> of over 300 years <strong>and</strong> up to<br />
30 m <strong>in</strong> height. The undergrowth is ma<strong>in</strong>ly composed<br />
of Ilex aquifolium. Other relevant woody species are<br />
Salix atroc<strong>in</strong>erea, Pyrus cordata, Frangula alnus,<br />
Corylus avellana, Alnus glut<strong>in</strong>osa, Crataegus monogyna<br />
<strong>and</strong> Malus sylvestris. Botanical nomenclature follows<br />
Tut<strong>in</strong> et al. (1964-68).<br />
Sampl<strong>in</strong>g, tree-r<strong>in</strong>g measurement <strong>and</strong> cross-dat<strong>in</strong>g<br />
Increment cores were taken from all the live F. <strong>sylvatica</strong><br />
<strong>and</strong> Q. <strong>robur</strong> trees with a stem diameter at<br />
breast height (dbh) greater than 5 cm, that were <strong>in</strong>cluded<br />
<strong>in</strong> a 1.35 ha forest st<strong>and</strong>. The number of F.<br />
<strong>sylvatica</strong> <strong>and</strong> Q. <strong>robur</strong> <strong>in</strong>dividuals cored was 469 <strong>and</strong><br />
121, respectively. Cores were taken with <strong>in</strong>crement<br />
borers at 20 cm above ground <strong>in</strong> the trees with dbh <<br />
30 cm, <strong>and</strong> 100 cm above ground when dbh 30<br />
cm. S<strong>in</strong>ce the forest st<strong>and</strong> is relatively level (measured<br />
slopes ranged from 3.6 to 20.7°), the direction<br />
of the maximum slope was not considered <strong>in</strong> decid<strong>in</strong>g<br />
<strong>in</strong> which direction the trees should be cored.<br />
Where possible, trees were cored along the longest<br />
radius to m<strong>in</strong>imize errors due to miss<strong>in</strong>g r<strong>in</strong>gs (Duncan<br />
1989). Repetitive cor<strong>in</strong>g was carried out to facilitate<br />
the <strong>in</strong>terception of the pith, <strong>and</strong> to avoid faults or<br />
rottenness. Usually one core per tree was taken, but<br />
up to four cores were taken <strong>in</strong> a few trees to obta<strong>in</strong> at<br />
least one appropriate core for <strong>age</strong> estimation. When<br />
more than one core was extracted from a tree, the<br />
successive cores were taken parallel <strong>and</strong> closer to the<br />
pith than the earliest, <strong>in</strong> the direction suggested by ray<br />
angles.<br />
Cores were air dried, mounted <strong>and</strong> s<strong>and</strong>ed follow<strong>in</strong>g<br />
st<strong>and</strong>ard procedures (Stokes <strong>and</strong> Smiley 1968).<br />
R<strong>in</strong>g-width series from all cores were measured to the<br />
nearest 0.01 mm under a stereomicroscope with a<br />
Velmex <strong>in</strong>cremental measur<strong>in</strong>g device l<strong>in</strong>ked to a<br />
computer. To get the same number of r<strong>in</strong>gs which<br />
would have been obta<strong>in</strong>ed with ord<strong>in</strong>ary r<strong>in</strong>g count<strong>in</strong>g<br />
on the samples, neither wood coloration nor previous<br />
cross-dat<strong>in</strong>g were carried out. The program CO-<br />
FECHA (Holmes 1983) was utilized to identify<br />
miss<strong>in</strong>g, partial or false r<strong>in</strong>gs. COFECHA accomplishes<br />
the cross-dat<strong>in</strong>g by calculat<strong>in</strong>g the better correlation<br />
coefficients for different lags between dist<strong>in</strong>ct<br />
segments of each <strong>in</strong>dividual r<strong>in</strong>g-width series <strong>and</strong> a<br />
dat<strong>in</strong>g master series. The dat<strong>in</strong>g master series was<br />
calculated from those r<strong>in</strong>g-width series that showed<br />
neither miss<strong>in</strong>g r<strong>in</strong>gs nor abrupt changes <strong>in</strong> growth<br />
patterns, unequivocally correctly synchronized, <strong>and</strong><br />
highly <strong>in</strong>ter-correlated. To identify each anomalous<br />
r<strong>in</strong>g, the computationally generated dat<strong>in</strong>gs were<br />
checked by visual comparisons of each radial growth<br />
series aga<strong>in</strong>st the master dat<strong>in</strong>g chronology.<br />
In the Caviedes forest 14 stem discs of F. <strong>sylvatica</strong><br />
were also taken, whose diameters ranged between 24<br />
<strong>and</strong> 60 cm, <strong>and</strong> 18 discs of Q. <strong>robur</strong> with diameters<br />
between 23 <strong>and</strong> 77 cm. The discs were cut with a<br />
cha<strong>in</strong>-saw between 20 <strong>and</strong> 100 cm above ground level<br />
from stumps <strong>and</strong> w<strong>in</strong>d-thrown trees. The trees from<br />
which discs were taken showed similar characteristics<br />
(crown-shape, trunk aspect, vigor, disease or <strong>in</strong>jury<br />
signals <strong>and</strong> growth patterns) than the previously cored<br />
trees. Thus, these discs were considered a r<strong>and</strong>om<br />
sample illustrative of radial growth of both tree species<br />
<strong>in</strong> this locality. Discs were smoothed with a<br />
power plane <strong>and</strong> then s<strong>and</strong>ed until the growth r<strong>in</strong>gs<br />
were clearly visible. One or two radial l<strong>in</strong>es per disc<br />
were drawn from the pith to the disc boundary until<br />
20 l<strong>in</strong>es for each tree species were achieved. If two<br />
l<strong>in</strong>es were drawn on a disc, these were distant enough<br />
to form an angle 120°. R<strong>in</strong>g-width series along the<br />
radial l<strong>in</strong>es were measured to the nearest 0.01 mm<br />
<strong>and</strong> cross-dat<strong>in</strong>g aga<strong>in</strong>st the master chronologies was<br />
accomplished with both the program COFECHA <strong>and</strong><br />
visual check<strong>in</strong>g.
196<br />
Methods for estimat<strong>in</strong>g pith location<br />
If a partial core passed close to the pith, so that the<br />
arcs of the <strong>in</strong>ner r<strong>in</strong>gs are visible, it is possible to estimate<br />
the position of the chronological centre of the<br />
tree (Norton et al. 1987; Duncan 1989). The geometric<br />
method developed by Duncan (1989) has been<br />
used to locate the pith from the curvature of the <strong>in</strong>nermost<br />
r<strong>in</strong>gs <strong>in</strong> different studies of tree population<br />
dynamics (Duncan 1993; Kelly <strong>and</strong> Larson 1997;<br />
Lusk <strong>and</strong> Smith 1998; Donnegan <strong>and</strong> Rebertus 1999).<br />
This method assumes concentric growth, so that the<br />
r<strong>in</strong>g boundaries can be considered arcs of circumferences<br />
centered <strong>in</strong> the pith. Therefore, a valid estimation<br />
of the length of miss<strong>in</strong>g radius is (modified from<br />
Duncan (1989)):<br />
d L2 4h 2<br />
8h<br />
(1)<br />
where d is the estimated distance from the largest entirely<br />
visible arc <strong>in</strong> the core to the pith, <strong>and</strong> h <strong>and</strong> L<br />
are respectively the height <strong>and</strong> the length of these arc<br />
(Figure 1a).<br />
Recently a new graphical method has been developed<br />
to estimate the position of the chronological<br />
centre of trees (Villalba <strong>and</strong> Veblen 1997). In this<br />
method the limits of the <strong>in</strong>ner r<strong>in</strong>gs of different cores<br />
taken from the same tree are identified <strong>and</strong> connected<br />
with curved l<strong>in</strong>es. The length of miss<strong>in</strong>g radius is then<br />
estimated as the radius of the <strong>in</strong>nermost circle, or as<br />
one half of the aver<strong>age</strong> of the shortest <strong>and</strong> longest diameters<br />
of the <strong>in</strong>nermost ellipse. However, this<br />
method is very time consum<strong>in</strong>g (at least the <strong>in</strong>nermost<br />
30 tree-r<strong>in</strong>g boundaries per sample should be carefully<br />
sketched), <strong>and</strong> it displays important sources of<br />
bias (the cores must be arranged exactly <strong>in</strong> the same<br />
relative position as <strong>in</strong> the tree, <strong>and</strong> trac<strong>in</strong>g the curvature<br />
of r<strong>in</strong>gs may vary from one person to another).<br />
For these reasons, this graphical method has been discarded<br />
for estimat<strong>in</strong>g the length of the miss<strong>in</strong>g radius<br />
<strong>in</strong> F. <strong>sylvatica</strong> <strong>and</strong> Q. <strong>robur</strong>.<br />
In this paper a new graphical method based on the<br />
anatomical evidence of the convergence of xylem<br />
rays at the pith is proposed. This method is especially<br />
adequate for <strong>Quercus</strong> spp. <strong>and</strong> <strong>Fagus</strong> spp., as their<br />
wood presents wide clearly-visible rays. In this<br />
method, the largest arc entirely visible on a core, <strong>and</strong><br />
two sufficiently distant rays are sketched under magnification<br />
on a transparent tape placed onto the core<br />
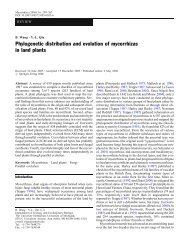
Figure 1. (a) Core simulation on a stem disc show<strong>in</strong>g the pith (P),<br />
<strong>and</strong> the largest visible arc <strong>in</strong> the core (modified from Duncan<br />
(1989)). Arc height (h) <strong>and</strong> length (L), their true distance from the<br />
pith (d), their longest (M) <strong>and</strong> shortest (m) distances to the pith,<br />
<strong>and</strong> the width of the 5 adjacent r<strong>in</strong>gs to arc (rw5), are also showed.<br />
(b) Transverse section of a core show<strong>in</strong>g the rays <strong>and</strong> r<strong>in</strong>g arcs. A<br />
transparent tape is also given with the sketches of two rays <strong>and</strong> the<br />
largest visible arc, show<strong>in</strong>g the ray extensions, the angle formed<br />
by them (), <strong>and</strong> the estimated length of miss<strong>in</strong>g radius (d) accord<strong>in</strong>g<br />
to the graphical method.<br />
(Figure 1b). The tape is then removed from the sample<br />
<strong>and</strong> fixed onto a sheet of paper <strong>and</strong> the ray<br />
sketches are extended <strong>in</strong> a straight l<strong>in</strong>e. The distance<br />
from the pith to the arc is then estimated as the distance<br />
between the po<strong>in</strong>t at which the ray extensions<br />
converge <strong>and</strong> the arc itself (d <strong>in</strong> Figure 1b).<br />
The errors associated with both the geometric <strong>and</strong><br />
graphical methods were obta<strong>in</strong>ed by core simulation<br />
on the disc surface. From each radial l<strong>in</strong>e previously<br />
drawn on the discs, five new parallel l<strong>in</strong>es were drawn<br />
at 10, 20, 30, 40 <strong>and</strong> 50 mm from the pith. A second<br />
l<strong>in</strong>e parallel to the first was drawn at a further 5 mm<br />
from the pith, resembl<strong>in</strong>g the surface of partial cores
197<br />
show<strong>in</strong>g the arcs of the <strong>in</strong>ner r<strong>in</strong>gs. Therefore, for<br />
each tree species a total of 100 core simulations was<br />
accomplished (20 radial l<strong>in</strong>es, 5 core simulations per<br />
l<strong>in</strong>e). The largest visible arc was identified on each<br />
core simulation, <strong>and</strong> its length (L), height (h) <strong>and</strong> true<br />
distance from the pith (d) were measured with a digital<br />
caliper to the nearest 0.1 mm (Figure 1a). The<br />
length of miss<strong>in</strong>g radius was estimated with both the<br />
geometric method from L <strong>and</strong> h, <strong>and</strong> the graphical<br />
method from the rays <strong>and</strong> arc sketches.<br />
The non-concentric growth close to the pith has<br />
been proposed as a ma<strong>in</strong> source of error <strong>in</strong> the estimation<br />
of the length of miss<strong>in</strong>g radii (Duncan 1989).<br />
To verify this hypothesis, an <strong>in</strong>dex of growth eccentricity<br />
(E) was def<strong>in</strong>ed as:<br />
E 1 m M . 100 (2)<br />
where m <strong>and</strong> M are respectively the shortest <strong>and</strong> longest<br />
distances between the arc <strong>and</strong> the pith along the<br />
disc circumference (Figure 1a). The <strong>in</strong>dex E ranges<br />
between 0 if the growth is ideally concentric (m = M),<br />
<strong>and</strong> 100 if the growth is quite eccentric (m = 0). To<br />
study the local geometry of radial growth <strong>in</strong> both tree<br />
species, a curvature <strong>in</strong>dex (C) was def<strong>in</strong>ed as:<br />
C 2h . 100 (3)<br />
L<br />
where h <strong>and</strong> L are as <strong>in</strong> the equation 1. This <strong>in</strong>dex<br />
reaches the value 0 for a straight l<strong>in</strong>e (h = 0), <strong>and</strong> 100<br />
for a semi-circumference (2h = L). The eccentricity is<br />
a measure of radial growth geometry along the whole<br />
tree perimeter, while r<strong>in</strong>g curvature is a local measure<br />
of growth geometry <strong>in</strong> the portion of the perimeter<br />
from which the core was taken. In addition the angle<br />
formed by the two rays, used to estimate the length<br />
of the miss<strong>in</strong>g radius, was measured ( <strong>in</strong> Figure 1b).<br />
The cores that show neither the pith nor the arcs<br />
of the <strong>in</strong>ner r<strong>in</strong>gs, but <strong>in</strong>clude a sufficient percent<strong>age</strong><br />
of the bole geometric radius, can be used to estimate<br />
tree <strong>age</strong>. This type of partial core was encountered<br />
due to decay of bole centre, or because of us<strong>in</strong>g too<br />
short a borer <strong>in</strong> comparison with the radius of the<br />
trunk. The procedure used to estimate the position of<br />
the pith <strong>in</strong> this case is based on the assumption that<br />
radial growth is concentric, i.e. that the tree’s chronological<br />
centre co<strong>in</strong>cide with its geometric centre<br />
(Norton et al. 1987). Therefore, the length of the<br />
miss<strong>in</strong>g radius was estimated as the difference between<br />
the geometric radius <strong>and</strong> the total core length.<br />
The length of radial l<strong>in</strong>es drawn on the discs corresponds<br />
to the chronological radius. Thus, the deviations<br />
result<strong>in</strong>g from assum<strong>in</strong>g concentric growth were<br />
calculated as the differences between the chronological<br />
radius m<strong>in</strong>us the geometric radius of the disc (half<br />
of its diameter, exclud<strong>in</strong>g the bark).<br />
Methods for estimat<strong>in</strong>g the number of r<strong>in</strong>gs miss<strong>in</strong>g<br />
from the pith<br />
Three methods were tested to estimate the number of<br />
miss<strong>in</strong>g r<strong>in</strong>gs on partial cores with the arcs of the <strong>in</strong>ner<br />
r<strong>in</strong>gs. The first method assumes that radial growth<br />
rate is constant through time for a given tree, <strong>and</strong> it<br />
has been widely used for <strong>age</strong> estimation <strong>in</strong> many tree<br />
species (Norton et al. 1987; Duncan 1989; Stephenson<br />
<strong>and</strong> Demetry 1995). In this method (RGR5) the<br />
number of miss<strong>in</strong>g r<strong>in</strong>gs was estimated by divid<strong>in</strong>g<br />
the length of the miss<strong>in</strong>g radius by the mean growth<br />
rate of the 5 r<strong>in</strong>gs adjacent to the largest visible arc<br />
on the core (calculated from rw5 <strong>in</strong> Figure 1a).<br />
The second method (BAI5) assumes a constant<br />
basal area <strong>in</strong>crement through time with<strong>in</strong> a tree<br />
(Stephenson <strong>and</strong> Demetry 1995). The number of absent<br />
r<strong>in</strong>gs was then estimated by divid<strong>in</strong>g the basal<br />
area correspond<strong>in</strong>g to the length of miss<strong>in</strong>g radius by<br />
the mean basal area <strong>in</strong>crement, calculated from the 5<br />
r<strong>in</strong>gs adjacent to the largest visible arc on the core<br />
(rw5 <strong>in</strong> Figure 1a).<br />
A third new method is proposed <strong>in</strong> this paper. It<br />
does not assume constant growth rates with<strong>in</strong> a tree,<br />
but is based on the pr<strong>in</strong>ciple that the rates of <strong>in</strong>itial<br />
radial growth should exhibit a common pattern of<br />
variation with<strong>in</strong> a tree population. In this method an<br />
empirical model of <strong>in</strong>itial radial growth (IRG) was<br />
applied, from which the number of miss<strong>in</strong>g r<strong>in</strong>gs was<br />
estimated as a function of both the distance from the<br />
pith, <strong>and</strong> the mean radial growth rate of the 5 r<strong>in</strong>gs<br />
adjacent to the largest arc visible on the core. To obta<strong>in</strong><br />
the IRG equations, 55 <strong>and</strong> 40 r<strong>in</strong>g-width series<br />
of F. <strong>sylvatica</strong> <strong>and</strong> Q. <strong>robur</strong>, respectively, were used.<br />
The r<strong>in</strong>g widths were measured on samples show<strong>in</strong>g<br />
the pith, which were taken from trees less than 90<br />
years old.<br />
It was assumed that these r<strong>in</strong>g-width series exemplified<br />
the growth patterns of both tree species under<br />
the complete range of environmental conditions <strong>in</strong> the<br />
forest. For each measured r<strong>in</strong>g the number of r<strong>in</strong>gs to<br />
the pith, the distance from the pith, <strong>and</strong> the mean
198<br />
growth rate of the 5 outer adjacent r<strong>in</strong>gs were calculated.<br />
1000 r<strong>in</strong>gs per species, located at up to 80 mm<br />
from the pith, were r<strong>and</strong>omly selected. From those<br />
r<strong>in</strong>gs the correspond<strong>in</strong>g IRG models were calibrated<br />
by least-squares multiple regression. The number of<br />
r<strong>in</strong>gs to the pith was considered as the dependent variable,<br />
while the distance from the pith <strong>and</strong> the mean<br />
growth rate were the <strong>in</strong>dependent variables.<br />
For each core simulation on the discs the number<br />
of miss<strong>in</strong>g r<strong>in</strong>gs was estimated with the three above<br />
described methods (RGR5, BAI5, <strong>and</strong> IRG model).<br />
The true distance from the pith, as well as <strong>estimates</strong><br />
of the length of the miss<strong>in</strong>g radius obta<strong>in</strong>ed with the<br />
geometric <strong>and</strong> graphical methods, were used. Therefore,<br />
for each core simulation, <strong>estimates</strong> of the number<br />
of miss<strong>in</strong>g r<strong>in</strong>gs were obta<strong>in</strong>ed with all the possible<br />
comb<strong>in</strong>ations of methods appropriate for partial<br />
cores that show the arcs of the <strong>in</strong>ner r<strong>in</strong>gs.<br />
To estimate the number of miss<strong>in</strong>g r<strong>in</strong>gs on partial<br />
cores that did not show the arcs of the <strong>in</strong>ner r<strong>in</strong>gs,<br />
methods based on the extrapolation of mean radial<br />
growth rates (RGR) <strong>and</strong> mean basal area <strong>in</strong>crements<br />
(BAI) were tested. Tak<strong>in</strong>g the 20 <strong>and</strong> 50 <strong>in</strong>nermost<br />
r<strong>in</strong>gs <strong>in</strong> a core to calculate the mean growth rate to<br />
be extrapolated, is the most frequent criterion (Norton<br />
et al. 1987; Duncan 1989; Lusk <strong>and</strong> Smith 1998).<br />
However, the mean growth rate has also been calculated<br />
from the 5 or even 3 <strong>in</strong>nermost r<strong>in</strong>gs (Frelich<br />
<strong>and</strong> Graumlich 1994; Donnegan <strong>and</strong> Rebertus 1999).<br />
In this work the 5, 20 <strong>and</strong> 50 <strong>in</strong>nermost r<strong>in</strong>gs visible<br />
on the cores were used to calculate the mean radial<br />
growth rate (RGR5, RGR20 <strong>and</strong> RGR50) <strong>and</strong> the<br />
mean basal area <strong>in</strong>crement (BAI5, BAI20 <strong>and</strong> BAI50)<br />
to be extrapolated.<br />
Among the r<strong>in</strong>g width series measured along the<br />
radial l<strong>in</strong>es drawn on the discs, 1000 r<strong>in</strong>gs located up<br />
to 200 mm from the pith were selected at r<strong>and</strong>om for<br />
each tree species. Each selected r<strong>in</strong>g was considered<br />
as the <strong>in</strong>nermost r<strong>in</strong>g of a partial core simulation. For<br />
each core simulation the true number of miss<strong>in</strong>g r<strong>in</strong>gs<br />
was calculated, <strong>and</strong> the length of miss<strong>in</strong>g radius was<br />
estimated as the difference between the geometric radius<br />
<strong>and</strong> the length of the core simulation. The number<br />
of miss<strong>in</strong>g r<strong>in</strong>gs was estimated with the methods<br />
RGR5, RGR20, RGR50, BAI5, BAI20 <strong>and</strong> BAI50, by<br />
us<strong>in</strong>g the length of miss<strong>in</strong>g radius previously estimated.<br />
If the estimated length was a negative number,<br />
then the considered number of miss<strong>in</strong>g r<strong>in</strong>gs was<br />
equal to 0 (i.e., the total number of r<strong>in</strong>gs on the core<br />
was the only possible estimation of tree <strong>age</strong>, because<br />
the length of the core was greater than the geometric<br />
radius due to eccentric growth).<br />
Indirect methods for estimat<strong>in</strong>g tree <strong>age</strong><br />
In the present work, <strong>in</strong>direct methods of tree <strong>age</strong> estimation<br />
based on least-squares regressions of <strong>age</strong> on<br />
bole diameter were tested. To calculate the <strong>age</strong>-diameter<br />
equations for both tree species, only complete<br />
cores were selected, i.e. those which <strong>in</strong>dicated the<br />
true <strong>age</strong> of the tree at sampl<strong>in</strong>g height. An <strong>in</strong>sufficient<br />
number of cores show<strong>in</strong>g the pith was obta<strong>in</strong>ed for<br />
Q. <strong>robur</strong>. However the discs of this species were also<br />
used, as well as partial cores which showed the arcs<br />
of the <strong>in</strong>ner r<strong>in</strong>gs, whose <strong>age</strong> was estimated by comb<strong>in</strong><strong>in</strong>g<br />
the graphical method <strong>and</strong> the IRG model.<br />
Sampled trees of both species could be grouped <strong>in</strong><br />
two cohorts accord<strong>in</strong>g to their <strong>age</strong> (cohort 1: 25–86<br />
years for F. <strong>sylvatica</strong>, 20–62 years for Q. <strong>robur</strong>; cohort<br />
2: 175–266 years for F. <strong>sylvatica</strong>, 125–236 years<br />
for Q. <strong>robur</strong>). Thus, <strong>in</strong> addition to the <strong>age</strong>-diameter<br />
regression for the population as a whole, the regression<br />
equations for each cohort were also separately<br />
calculated. The <strong>age</strong>-diameter regression models, for<br />
populations considered as a whole, were taken as<br />
l<strong>in</strong>es that passed through the orig<strong>in</strong>, because when a<br />
tree is 0 years old their diameter must be 0 cm<br />
(Stephenson <strong>and</strong> Demetry 1995). By contrast, l<strong>in</strong>ear<br />
regression models that <strong>in</strong>cluded a constant were applied<br />
for the separate cohorts, as it is usual (Lorimer<br />
1980; Stewart <strong>and</strong> Rose 1990; Brodie et al. 1995;<br />
Taylor et al. 1996; Lusk <strong>and</strong> Smith 1998).<br />
Errors <strong>in</strong> tree <strong>age</strong> estimation were calculated for<br />
each regression model by tak<strong>in</strong>g out trees at r<strong>and</strong>om<br />
with replacement, from the available samples. Five<br />
trees were r<strong>and</strong>omly selected from each cohort, <strong>and</strong><br />
the <strong>age</strong>-diameter regressions were calculated from the<br />
rema<strong>in</strong><strong>in</strong>g trees. Regression equations were obta<strong>in</strong>ed<br />
for the overall populations as well as for each cohort<br />
separately. The <strong>age</strong>s of the 10 trees selected were estimated<br />
from their diameter with the regression equations,<br />
<strong>and</strong> the deviation of each estimate from their<br />
true <strong>age</strong> was calculated. This procedure was repeated<br />
20 times, so that for each tree species deviations of<br />
100 <strong>estimates</strong> were obta<strong>in</strong>ed consider<strong>in</strong>g the populations<br />
as a whole, <strong>and</strong> 100 by tak<strong>in</strong>g each cohort separately.
Table 1. Pearson’s correlation coefficients between different variables measured on F. <strong>sylvatica</strong> <strong>and</strong> Q. <strong>robur</strong> stem discs, <strong>and</strong> the absolute<br />
errors <strong>in</strong> estimat<strong>in</strong>g the length of miss<strong>in</strong>g radius with the geometric (AE-Geom) <strong>and</strong> graphical (AE-Graph) methods. n = 100 <strong>in</strong> all tests.<br />
Species Variable E C AE-Geom AE-Graph<br />
F. <strong>sylvatica</strong> d 0.14 −0.81 *** −0.72 *** 0.45 *** 0.62 ***<br />
E −0.07 0.05 0.18 0.25 *<br />
C 0.80 *** −0.35 *** −0.47 ***<br />
−0.37 *** −0.31 ***<br />
Q. <strong>robur</strong> d 0.02 −0.51 *** −0.67 *** 0.58 *** 0.65 ***<br />
E 0.35 *** 0.27 ** 0.33 *** 0.30 **<br />
C 0.64 *** −0.02 −0.04<br />
−0.26 ** −0.21 *<br />
Variables: distance from the pith (d), eccentricity <strong>in</strong>dex (E), curvature <strong>in</strong>dex (C), <strong>and</strong> the angle formed by two rays ().<br />
*<br />
p < 0.05;<br />
**<br />
p < 0.01;<br />
***<br />
p < 0.001.<br />
199<br />
Results<br />
Computation of total number of r<strong>in</strong>gs <strong>in</strong> the cores<br />
On the cores taken from the trees older than 150<br />
years, 17110 growth r<strong>in</strong>gs of F. <strong>sylvatica</strong> were dated,<br />
among which 15 were miss<strong>in</strong>g r<strong>in</strong>gs <strong>and</strong> 195 micror<strong>in</strong>gs.<br />
Of the 6396 dated r<strong>in</strong>gs of Q. <strong>robur</strong>, only 1<br />
miss<strong>in</strong>g r<strong>in</strong>g <strong>and</strong> 12 micro-r<strong>in</strong>gs were identified. In<br />
contrast to the miss<strong>in</strong>g r<strong>in</strong>gs, the micro-r<strong>in</strong>gs showed<br />
some positive anatomical evidence when the cores<br />
were newly exam<strong>in</strong>ed after quantitative cross-dat<strong>in</strong>g.<br />
But like the miss<strong>in</strong>g r<strong>in</strong>gs, micro-r<strong>in</strong>gs were not identifiable<br />
at a glance, but only by cross-dat<strong>in</strong>g. Thus,<br />
both miss<strong>in</strong>g r<strong>in</strong>gs <strong>and</strong> micro-r<strong>in</strong>gs were considered<br />
absent r<strong>in</strong>gs unidentifiable by means of r<strong>in</strong>g count<strong>in</strong>g<br />
alone. Furthermore, <strong>in</strong> outer segments of several<br />
cores, tree-r<strong>in</strong>g boundaries could not be identified due<br />
to faults <strong>and</strong> periods of severe growth suppression.<br />
This occurred <strong>in</strong> 6 cores among 88 of F. <strong>sylvatica</strong>, <strong>and</strong><br />
<strong>in</strong> 16 among 39 of Q. <strong>robur</strong>, from which float<strong>in</strong>g<br />
r<strong>in</strong>g-width series were obta<strong>in</strong>ed.<br />
The r<strong>in</strong>g-width series measured on cores taken<br />
from trees younger than 90 years, were also crossdated<br />
quantitatively as well as visually. Cross-dat<strong>in</strong>g<br />
was accomplished for 381 young F. <strong>sylvatica</strong> trees<br />
<strong>and</strong> 82 Q. <strong>robur</strong>. Because of a too short r<strong>in</strong>g-width<br />
series <strong>and</strong>/or deficient correspondence with the master<br />
chronology, 25% of the F. <strong>sylvatica</strong> series <strong>and</strong><br />
13% of Q. <strong>robur</strong> showed poor cross-dat<strong>in</strong>g. For these<br />
samples, r<strong>in</strong>g count<strong>in</strong>g was the only feasible approach<br />
<strong>in</strong> estimat<strong>in</strong>g the number of r<strong>in</strong>gs on the cores. By<br />
contrast, <strong>in</strong> the rema<strong>in</strong><strong>in</strong>g radial growth series it was<br />
possible to verify if the true <strong>age</strong> of the cores was correctly<br />
determ<strong>in</strong>ed by r<strong>in</strong>g count<strong>in</strong>g. The amount of<br />
young trees that showed proper dat<strong>in</strong>g of their r<strong>in</strong>gwidth<br />
series (i.e., those <strong>in</strong> which r<strong>in</strong>g counts provided<br />
the true number of r<strong>in</strong>gs conta<strong>in</strong>ed <strong>in</strong> the sample) was<br />
similar <strong>in</strong> both tree species: 19% for F. <strong>sylvatica</strong> <strong>and</strong><br />
22% for Q. <strong>robur</strong>. In 35% of the cores of F. <strong>sylvatica</strong><br />
r<strong>in</strong>g count<strong>in</strong>g underestimated the true <strong>age</strong> while <strong>in</strong><br />
21% overestimated it. However, under<strong>estimates</strong> were<br />
obta<strong>in</strong>ed <strong>in</strong> 63% of the cores of Q. <strong>robur</strong>, <strong>and</strong> only <strong>in</strong><br />
2% of these the number of r<strong>in</strong>gs was overestimated.<br />
Radial growth geometry<br />
To ascerta<strong>in</strong> feasible differences <strong>in</strong> the radial growth<br />
geometry of F. <strong>sylvatica</strong> <strong>and</strong> Q. <strong>robur</strong>, correlations<br />
between the different variables measured on the central<br />
portion of the discs were computed. In both tree<br />
species, growth eccentricity (E) did not revealed a<br />
significant correlation with the distance from the pith<br />
(d) (Table 1). This result <strong>in</strong>dicated that dur<strong>in</strong>g the <strong>in</strong>itial<br />
period of life, the eccentricity of radial growth<br />
was <strong>in</strong>dependent of the distance from the pith. However,<br />
both the curvature of the r<strong>in</strong>g boundaries (C)<br />
<strong>and</strong> the angle of rays (), showed a highly significant<br />
negative correlation with d. Furthermore, C <strong>and</strong> <br />
were highly significantly correlated <strong>in</strong> a direct way<br />
(Table 1). These are logical consequences of radial<br />
growth progression <strong>in</strong> successively superimposed<br />
r<strong>in</strong>gs, <strong>and</strong> of the approximately radial arrangement of<br />
rays.<br />
In F. <strong>sylvatica</strong> discs, C <strong>and</strong> were <strong>in</strong>dependent of<br />
E, while <strong>in</strong> Q. <strong>robur</strong> both C <strong>and</strong> showed a significant<br />
direct relationship with E (Table 1). Multiple regression<br />
analyses were accomplished tak<strong>in</strong>g d <strong>and</strong> E
200<br />
Table 2. Absolute <strong>and</strong> percent<strong>age</strong> errors <strong>in</strong> estimat<strong>in</strong>g the length of miss<strong>in</strong>g radius. Mean errors (SE) are given for the geometric <strong>and</strong> graphical<br />
methods, <strong>and</strong> by consider<strong>in</strong>g the chronological center of the tree as the bole geometric center.<br />
Species <strong>and</strong> method n Absolute error (mm) Percent<strong>age</strong> error (%) U O 2 s.l.<br />
<strong>Fagus</strong> <strong>sylvatica</strong><br />
Geometric method 100 8.8 (0.9) 24.7 (1.9) 80 20<br />
***<br />
Graphical method 100 6.7 (0.6) 18.1 (1.3) 72 27<br />
***<br />
Geometric center 20 20.3 (4.5) 8.9 (1.7) 14 6 ns<br />
<strong>Quercus</strong> <strong>robur</strong><br />
Geometric method 100 12.1 (1.1) 33.8 (2.5) 77 23<br />
***<br />
Graphical method 100 8.3 (0.8) 21.7 (1.6) 65 34<br />
**<br />
Geometric center 20 66.9 (13.3) 21.3 (3.5) 14 6 ns<br />
n: number of simulations.<br />
U <strong>and</strong> O: number of under- <strong>and</strong> over<strong>estimates</strong>, respectively.<br />
2 s.l.: significance level for the hypothesis of a similar number of under- <strong>and</strong> over<strong>estimates</strong>, accord<strong>in</strong>g to a Chi-square test.<br />
ns: non significant,<br />
*<br />
p < 0.05,<br />
**<br />
p < 0.01,<br />
***<br />
p < 0.001.<br />
as <strong>in</strong>dependent variables, <strong>and</strong> either C or as dependent<br />
variables. In F. <strong>sylvatica</strong>, C was only related to<br />
d (r 2 = 0.658, p < 0.001), while was significantly<br />
related to both d <strong>and</strong> E (r 2 = 0.542, p < 0.001). But<br />
while d expla<strong>in</strong>ed 51.9% of angle variation, E expla<strong>in</strong>ed<br />
only 2.3% of that variation. In Q. <strong>robur</strong>, C as<br />
well as were significantly related to both d <strong>and</strong> E<br />
(r 2 = 0.394 for C, r 2 = 0.533 for , p < 0.001 <strong>in</strong> both<br />
tests). d expla<strong>in</strong>ed the greater proportion of the variation<br />
of dependent variables <strong>in</strong> Q. <strong>robur</strong> (26.6% of<br />
C, 44.9% of ), <strong>and</strong> E expla<strong>in</strong>ed an appreciable proportion<br />
of that variation (12.8% of C, 8.4% of ).<br />
These results <strong>in</strong>dicated differences <strong>in</strong> radial growth<br />
eccentricity between both species. The eccentricity<br />
measured on F. <strong>sylvatica</strong> discs varied between 4.6 <strong>and</strong><br />
54.5, while for Q. <strong>robur</strong> this <strong>in</strong>dex reached values<br />
from 15.2 to 88.1. Mean radial growth eccentricity <strong>in</strong><br />
Q. <strong>robur</strong> discs was significantly greater than <strong>in</strong> F. <strong>sylvatica</strong><br />
(25.9 ± 14.2 for F. <strong>sylvatica</strong>, 46.8 ± 18.2 for<br />
Q. <strong>robur</strong>, U 14,18 = 45.0, p = 0.002, Mann-Whitney<br />
test). Thus, r<strong>in</strong>g curvature <strong>and</strong> the angle of xylem rays<br />
<strong>in</strong> F. <strong>sylvatica</strong> were ma<strong>in</strong>ly related to the distance<br />
from the pith because growth eccentricity is comparatively<br />
not very important <strong>in</strong> this species. However,<br />
r<strong>in</strong>g curvature <strong>and</strong> the angle of rays <strong>in</strong> Q. <strong>robur</strong> discs<br />
were a consequence of both the distance from the pith<br />
<strong>and</strong> the pronounced eccentricity <strong>in</strong> radial growth.<br />
Estimat<strong>in</strong>g the length of miss<strong>in</strong>g radius<br />
In partial core simulations show<strong>in</strong>g the arcs of the <strong>in</strong>ner<br />
r<strong>in</strong>gs, the mean errors obta<strong>in</strong>ed with the geometric<br />
method were greater than with the graphical<br />
method for both tree species (Table 2). The mean errors<br />
obta<strong>in</strong>ed <strong>in</strong> the geometric <strong>and</strong> graphical methods<br />
did not differed significantly for F. <strong>sylvatica</strong> (paired t<br />
= 1.55, df = 98, p = 0.125, for both absolute <strong>and</strong> percent<strong>age</strong><br />
errors). However, <strong>estimates</strong> of the length of<br />
miss<strong>in</strong>g radius <strong>in</strong> Q. <strong>robur</strong> obta<strong>in</strong>ed through the<br />
graphical method provided a significantly smaller error<br />
than those based on the geometric method (paired<br />
t = 3.55, df = 98, p < 0.001, for both absolute <strong>and</strong><br />
percent<strong>age</strong> errors). With both methods <strong>and</strong> for both<br />
tree species, the true length of miss<strong>in</strong>g radius was<br />
significantly underestimated (Table 2).<br />
The absolute errors obta<strong>in</strong>ed <strong>in</strong> estimat<strong>in</strong>g the<br />
length of miss<strong>in</strong>g radius <strong>in</strong> F. <strong>sylvatica</strong> were significantly<br />
<strong>and</strong> positively correlated with d, <strong>and</strong> <strong>in</strong>dependent<br />
from (or weakly correlated to) E, while show<strong>in</strong>g<br />
a highly significant negative relationship with both C<br />
<strong>and</strong> (Table 1). Multiple regression analyses performed<br />
tak<strong>in</strong>g d <strong>and</strong> E as <strong>in</strong>dependent variables,<br />
showed that absolute error obta<strong>in</strong>ed with the geometric<br />
method <strong>in</strong> F. <strong>sylvatica</strong> was only related to d (r 2 =<br />
0.199, p < 0.001). For <strong>estimates</strong> achieved with the<br />
graphical method, the absolute error was significantly<br />
related to both d <strong>and</strong> E (r 2 = 0.414, p < 0.001). However,<br />
this error was ma<strong>in</strong>ly due to the distance to the
201<br />
pith (38.6%), while growth eccentricity expla<strong>in</strong>ed a<br />
m<strong>in</strong>or percent<strong>age</strong> of error (2.8%).<br />
The absolute errors obta<strong>in</strong>ed <strong>in</strong> estimat<strong>in</strong>g the<br />
length of miss<strong>in</strong>g radius <strong>in</strong> Q. <strong>robur</strong> showed a significantly<br />
positive correlation with both d <strong>and</strong> E, <strong>and</strong><br />
a negative one with , while be<strong>in</strong>g <strong>in</strong>dependent of C<br />
(Table 1). Accord<strong>in</strong>g to multiple regression analyses,<br />
both d <strong>and</strong> E expla<strong>in</strong>ed an appreciable proportion of<br />
the error <strong>in</strong> estimat<strong>in</strong>g miss<strong>in</strong>g core length <strong>in</strong> Q. <strong>robur</strong><br />
(r 2 = 0.439 for geometric method, r 2 = 0.509 for<br />
graphical method, p < 0.001 <strong>in</strong> both tests). 34% of<br />
the absolute error obta<strong>in</strong>ed <strong>in</strong> the geometric method<br />
was related to d, <strong>and</strong> 9.9% to E. Us<strong>in</strong>g the graphical<br />
method, 42.6% of the absolute error was related to d,<br />
<strong>and</strong> 8.3% was due to E.<br />
In partial cores without the arcs of <strong>in</strong>ner r<strong>in</strong>gs,<br />
mean errors obta<strong>in</strong>ed when the length of miss<strong>in</strong>g radius<br />
was estimated <strong>in</strong> F. <strong>sylvatica</strong>, were considerably<br />
smaller than for Q. <strong>robur</strong> (Table 2). S<strong>in</strong>ce the radial<br />
growth of Q. <strong>robur</strong> <strong>in</strong> the Caviedes forest is more eccentric<br />
than that of F. <strong>sylvatica</strong>, it should be expected<br />
that errors <strong>in</strong> the estimation of miss<strong>in</strong>g radial length,<br />
under the assumption of concentric growth, will be<br />
greater for Q. <strong>robur</strong>. Under- or over<strong>estimates</strong> occurred<br />
when the radius <strong>in</strong> the region of bole perimeter<br />
<strong>in</strong> which the core was simulated, was smaller or<br />
greater, respectively, than the geometric radius. The<br />
peripheral po<strong>in</strong>ts from which the cores were simulated<br />
were chosen at r<strong>and</strong>om. Thus, a non significantly<br />
different number of under- or over<strong>estimates</strong><br />
was obta<strong>in</strong>ed (Table 2).<br />
The <strong>in</strong>itial radial growth models<br />
The best least-squares equations obta<strong>in</strong>ed to estimate<br />
the number of miss<strong>in</strong>g r<strong>in</strong>gs (NMR) were a l<strong>in</strong>ear<br />
function of the mean growth rate of 5 r<strong>in</strong>gs (MGR5),<br />
<strong>and</strong> a cubic polynomial function of the length of miss<strong>in</strong>g<br />
radius (d) (NMR = 3.41 − 3.15 MGR5 + 2.07 d −<br />
0.037 d 2 + 0.0002 d 3 , r 2 = 0.883 for F. <strong>sylvatica</strong>;<br />
NMR = 3.37 − 2.26 MGR5 + 1.22 d − 0.022 d 2 +<br />
0.0001 d 3 , r 2 = 0.830 for Q. <strong>robur</strong>; n = 1000 <strong>and</strong> p <<br />
0.001 for both species; all terms significant at 0.001<br />
level).<br />
When the polynomial degree for d was enhanced,<br />
or when another model was considered for the relationship<br />
with MGR5 (power, exponential or quadratic),<br />
the proportion of expla<strong>in</strong>ed <strong>age</strong> <strong>in</strong>creased less<br />
than 0.5%. Also, d expla<strong>in</strong>ed the largest proportion of<br />
NMR variation (85% for F. <strong>sylvatica</strong> <strong>and</strong> 77% for Q.<br />
<strong>robur</strong>), while MGR5 expla<strong>in</strong>ed the poor amount of<br />
their variation (3% <strong>and</strong> 6% for F. <strong>sylvatica</strong> <strong>and</strong> Q.<br />
<strong>robur</strong>, respectively). However, this model provided<br />
more accurate <strong>estimates</strong> of NMR than if only d was<br />
used. This was particularly true for the shortest <strong>and</strong><br />
longest distances to the pith, where the respective<br />
trend to over- <strong>and</strong> underestimate the number of miss<strong>in</strong>g<br />
r<strong>in</strong>gs was considerably corrected. Hence, this was<br />
considered the more appropriate model.<br />
The equations were calibrated from growth rate<br />
values that ranged from 0.17 to 7.12 mm/r<strong>in</strong>g for F.<br />
<strong>sylvatica</strong>, <strong>and</strong> from 0.25 to 7.97 mm/r<strong>in</strong>g for Q.<br />
<strong>robur</strong>. The distances to the pith from which the equations<br />
were derived ranged from 0.38 to 79.83 mm for<br />
F. <strong>sylvatica</strong>, <strong>and</strong> from 0.55 to 79.58 mm for Q. <strong>robur</strong>.<br />
Both <strong>in</strong>dependent variables were more or less uniformly<br />
distributed throughout their range of variation,<br />
<strong>and</strong> they were not highly correlated (r 2 = 0.282 for F.<br />
<strong>sylvatica</strong>, r 2 = 0.049 for Q. <strong>robur</strong>).<br />
The Figure 2 represents the <strong>in</strong>itial radial growth<br />
(IRG) models to estimate the number of miss<strong>in</strong>g r<strong>in</strong>gs<br />
from both radial growth rate <strong>and</strong> the length of miss<strong>in</strong>g<br />
radius. The pr<strong>in</strong>cipal difference between both empirical<br />
equations is that, for the same growth rates <strong>and</strong><br />
distances to the pith, the estimated number of miss<strong>in</strong>g<br />
r<strong>in</strong>gs is greater for F. <strong>sylvatica</strong> than for Q. <strong>robur</strong>.<br />
This is because the mean width of <strong>in</strong>nermost F. <strong>sylvatica</strong><br />
r<strong>in</strong>gs is significantly smaller than that of Q.<br />
<strong>robur</strong> (1.75 ± 1.15 mm for Q. <strong>robur</strong>, <strong>and</strong> 1.32 ± 1.02<br />
mm for F. <strong>sylvatica</strong>, unpaired t = 8.94, df = 1998, p <<br />
0.001).<br />
Age <strong>estimates</strong> based on cores with the arcs of <strong>in</strong>ner<br />
r<strong>in</strong>gs<br />
Mean errors obta<strong>in</strong>ed when the number of miss<strong>in</strong>g<br />
r<strong>in</strong>gs was estimated with the IRG models, were<br />
clearly less than those us<strong>in</strong>g the methods RGR5 <strong>and</strong><br />
BAI5 (Table 3). This happened for both species of<br />
trees, as well as through us<strong>in</strong>g the true distance from<br />
the pith <strong>and</strong> the <strong>estimates</strong> of the length of miss<strong>in</strong>g radius<br />
obta<strong>in</strong>ed with both the geometric <strong>and</strong> graphical<br />
methods. Mean absolute <strong>and</strong> percent<strong>age</strong> errors obta<strong>in</strong>ed<br />
<strong>in</strong> F. <strong>sylvatica</strong> with the IRG model did not significantly<br />
differed when the true distance from the<br />
pith, or the length of miss<strong>in</strong>g radius estimated with<br />
the geometric or graphical methods, were used<br />
(paired t ranged from 0.73 to 1.83, p ranged from<br />
0.070 to 0.466, with df = 99 <strong>in</strong> all tests).<br />
If the number of miss<strong>in</strong>g r<strong>in</strong>gs <strong>in</strong> Q. <strong>robur</strong> was estimated<br />
with the IRG model, mean errors obta<strong>in</strong>ed did<br />
not significantly differed when the true distance from
202<br />
Figure 2. Initial radial growth models for estimat<strong>in</strong>g the number of miss<strong>in</strong>g r<strong>in</strong>gs <strong>in</strong> F. <strong>sylvatica</strong> (a) <strong>and</strong> Q. <strong>robur</strong> (b), as a l<strong>in</strong>ear function of<br />
the mean growth rate of 5 r<strong>in</strong>gs (MGR5), <strong>and</strong> a polynomial function of the length of miss<strong>in</strong>g radius. Grid divisions are at 0.5 mm/r<strong>in</strong>g<br />
<strong>in</strong>tervals for the growth rate, <strong>and</strong> 5 mm for the length of miss<strong>in</strong>g radius. The contour l<strong>in</strong>es represent constant values of the number of miss<strong>in</strong>g<br />
r<strong>in</strong>gs.<br />
Table 3. Absolute <strong>and</strong> percent<strong>age</strong> errors <strong>in</strong> tree <strong>age</strong>s estimated from partial cores with the arcs of the <strong>in</strong>ner r<strong>in</strong>gs. Mean errors (SE) are given<br />
for three different methods of <strong>age</strong> estimation (RGR5, BAI5, <strong>and</strong> IRG model), us<strong>in</strong>g three different lengths of miss<strong>in</strong>g radius (true <strong>and</strong> estimated<br />
with the geometric <strong>and</strong> graphical methods). n = 100 <strong>in</strong> all cases. Abbreviations as <strong>in</strong> Table 2.<br />
<strong>Fagus</strong> <strong>sylvatica</strong><br />
<strong>Quercus</strong> <strong>robur</strong><br />
Length of<br />
miss<strong>in</strong>g<br />
radius<br />
Absolute<br />
error<br />
(years)<br />
Age estimation<br />
method<br />
Percent<strong>age</strong><br />
error<br />
(%)<br />
U O 2 s.l. Absolute<br />
error<br />
(years)<br />
Percent<strong>age</strong><br />
error<br />
(%)<br />
U O 2 s.l.<br />
True RGR5 11.7 (1.0) 40.9 (3.2) 78 22<br />
***<br />
5.7 (0.4) 33.6 (1.9) 86 14<br />
***<br />
BAI5 18.8 (1.1) 65.9 (1.8) 96 4<br />
***<br />
11.9 (0.5) 69.2 (1.5) 100 0<br />
***<br />
IRG 8.8 (0.6) 39.7 (3.3) 33 67<br />
***<br />
3.8 (0.3) 22.5 (1.5) 43 57 ns<br />
Geometric RGR5 13.3 (1.1) 45.3 (2.4) 84 16<br />
***<br />
8.9 (0.6) 50.0 (2.0) 95 5<br />
***<br />
BAI5 20.3 (1.2) 71.0 (1.8) 98 2<br />
***<br />
14.1 (0.7) 79.6 (1.3) 100 0<br />
***<br />
IRG 8.8 (1.1) 33.4 (2.9) 35 65<br />
**<br />
5.2 (0.5) 25.8 (1.8) 72 28<br />
***<br />
Graphical RGR5 12.7 (1.1) 43.1 (2.5) 80 20<br />
***<br />
7.5 (0.6) 42.0 (1.9) 90 10<br />
***<br />
BAI5 19.8 (1.2) 68.7 (1.9) 98 2<br />
***<br />
13.2 (0.6) 74.4 (1.4) 100 0<br />
***<br />
IRG 8.2 (0.7) 35.4 (3.0) 37 63<br />
**<br />
4.3 (0.5) 21.9 (1.6) 44 56 ns<br />
the pith, or the length of miss<strong>in</strong>g radius obta<strong>in</strong>ed with<br />
the graphical method, were used (paired t = 1.64, p =<br />
0.104 for absolute error; paired t = 0.31, p = 0.755<br />
for percent<strong>age</strong> error; df = 99 <strong>in</strong> both tests). However,<br />
mean errors obta<strong>in</strong>ed with the IRG model <strong>in</strong> this species<br />
were significantly greater when the length of<br />
miss<strong>in</strong>g radius was estimated with the geometric<br />
method than with the graphical method (paired t =<br />
3.23, p = 0.002 for absolute error; paired t = 2.19, p<br />
= 0.031 for percent<strong>age</strong> error; df = 99 <strong>in</strong> both tests).<br />
Therefore, the graphical method of extension of the<br />
rays comb<strong>in</strong>ed with the IRG model provided the most<br />
efficient <strong>estimates</strong> of the number of miss<strong>in</strong>g r<strong>in</strong>gs on<br />
partial cores of Q. <strong>robur</strong>.<br />
To underestimate the radial growth rate or basal<br />
area <strong>in</strong>crement always implied an overestimation of<br />
the number of miss<strong>in</strong>g r<strong>in</strong>gs, <strong>and</strong> vice versa. Both radial<br />
growth rate <strong>and</strong> basal area <strong>in</strong>crements <strong>in</strong> the<br />
miss<strong>in</strong>g core segment were overestimated from the<br />
core simulations. Therefore, the RGR5 <strong>and</strong> BAI5<br />
methods significantly underestimated the true number<br />
of miss<strong>in</strong>g r<strong>in</strong>gs <strong>in</strong> both species (Table 3). The bias<br />
toward underestimat<strong>in</strong>g the number of miss<strong>in</strong>g r<strong>in</strong>gs<br />
was greater <strong>in</strong> Q. <strong>robur</strong>, because this species showed<br />
more cases <strong>in</strong> which the growth rate of miss<strong>in</strong>g segments<br />
was overestimated, <strong>and</strong> also <strong>in</strong> 100% of the<br />
cases the mean basal area <strong>in</strong>crement was overestimated.
203<br />
Table 4. Absolute <strong>and</strong> percent<strong>age</strong> errors <strong>in</strong> tree <strong>age</strong>s estimated from partial cores without the arcs of the <strong>in</strong>ner r<strong>in</strong>gs. Mean errors (SE) are<br />
given for six different methods of <strong>age</strong> estimation, by consider<strong>in</strong>g the chronological center of the tree as the bole geometric center. n = 1000<br />
<strong>in</strong> all cases. Abbreviations as <strong>in</strong> Table 2, except for PU <strong>and</strong> PO: percent<strong>age</strong> of under- <strong>and</strong> over<strong>estimates</strong>, respectively.<br />
<strong>Fagus</strong> <strong>sylvatica</strong><br />
<strong>Quercus</strong> <strong>robur</strong><br />
Age estimation<br />
method<br />
Absolute<br />
error<br />
(years)<br />
Percent<strong>age</strong><br />
error (%)<br />
PU PO 2 s.l. Absolute<br />
error<br />
(years)<br />
Percent<strong>age</strong><br />
error (%)<br />
PU PO 2 s.l.<br />
RGR5 39.2 (1.1) 48.2 (1.1) 58 42 ns 29.2 (0.7) 58.8 (2.2) 61 39<br />
*<br />
RGR20 38.0 (1.1) 45.4 (0.9) 55 45 ns 27.0 (0.6) 54.4 (1.7) 57 43 ns<br />
RGR50 43.6 (1.2) 50.8 (1.1) 57 43 ns 28.1 (0.7) 56.1 (1.5) 54 46 ns<br />
BAI5 42.3 (0.9) 53.7 (0.8) 92 8<br />
***<br />
36.2 (0.7) 61.6 (1.0) 91 9<br />
***<br />
BAI20 45.1 (1.0) 57.9 (0.8) 96 4<br />
***<br />
38.3 (0.7) 64.7 (0.8) 95 5<br />
***<br />
BAI50 49.1 (1.1) 62.5 (0.9) 96 4<br />
***<br />
39.9 (0.7) 67.1 (0.8) 97 3<br />
***<br />
However, the IRG model significantly overestimated<br />
the number of miss<strong>in</strong>g r<strong>in</strong>gs on partial core<br />
simulations of F. <strong>sylvatica</strong> (Table 3). The IRG model<br />
significantly underestimated the number of miss<strong>in</strong>g<br />
r<strong>in</strong>gs on partial cores of Q. <strong>robur</strong> only when the<br />
length of miss<strong>in</strong>g radius was estimated with the geometric<br />
method. When the true distance from the pith,<br />
or the <strong>estimates</strong> obta<strong>in</strong>ed with the graphical method,<br />
were used, the IRG model yielded <strong>estimates</strong> centered<br />
around the true number of miss<strong>in</strong>g r<strong>in</strong>gs (Table 3).<br />
Age <strong>estimates</strong> based on cores without the arcs of<br />
<strong>in</strong>ner r<strong>in</strong>gs<br />
The RGR20 method provided superior <strong>estimates</strong> of<br />
the number of miss<strong>in</strong>g r<strong>in</strong>gs <strong>in</strong> both tree species (Table<br />
4). Mean absolute error of <strong>age</strong> <strong>estimates</strong> obta<strong>in</strong>ed<br />
with the RGR20 method <strong>in</strong> F. <strong>sylvatica</strong> was significantly<br />
lower than with RGR50 (paired t = 6.10, df =<br />
999, p < 0.001), but it did not differ from the error<br />
obta<strong>in</strong>ed with RGR5 (paired t = 1.21, df = 999, p =<br />
0.225). But mean percent<strong>age</strong> error of F. <strong>sylvatica</strong> <strong>age</strong><br />
<strong>estimates</strong>, achieved with RGR20, was significantly<br />
lower than with both the rema<strong>in</strong><strong>in</strong>g methods of radial<br />
growth rate extrapolation (paired t = 2.71, p = 0.007<br />
with RGR5; paired t = 5.97, p < 0.001 with RGR50;<br />
df = 999 <strong>in</strong> both tests). On the other h<strong>and</strong>, mean absolute<br />
<strong>and</strong> percent<strong>age</strong> errors <strong>in</strong> Q. <strong>robur</strong> <strong>age</strong> <strong>estimates</strong>,<br />
obta<strong>in</strong>ed with the RGR20 method, were significantly<br />
lower than with the rema<strong>in</strong><strong>in</strong>g RGR methods<br />
(paired t ranged from 2.18 to 4.70, p ranged from<br />
0.029 to be
204<br />
Figure 3. Representative r<strong>in</strong>g-width series measured on Q. <strong>robur</strong> discs (a, c, e), with their respective deviations of <strong>age</strong> <strong>estimates</strong> for distances<br />
up to 150 mm from the pith (b, d, f). <strong>Tree</strong> <strong>age</strong> <strong>estimates</strong> were obta<strong>in</strong>ed by extrapolat<strong>in</strong>g the mean growth rate (RGR) <strong>and</strong> basal area<br />
<strong>in</strong>crement (BAI) from the 5, 20 <strong>and</strong> 50 <strong>in</strong>nermost r<strong>in</strong>gs.<br />
Age <strong>estimates</strong> from bole diameter<br />
The regression equations obta<strong>in</strong>ed for <strong>age</strong>-diameter<br />
relationships <strong>in</strong> F. <strong>sylvatica</strong> <strong>and</strong> Q. <strong>robur</strong>, are shown<br />
<strong>in</strong> the Figure 4. The equations obta<strong>in</strong>ed for the populations<br />
considered as a whole were highly significant,<br />
with r 2 values greater than 0.87. The equations for the<br />
different cohorts were also significant, but r 2 values<br />
were considerably smaller (Table 5). The proportion<br />
of <strong>age</strong>-variance related to diameter was very similar<br />
for both cohorts of F. <strong>sylvatica</strong> (26–27%). By contrast,<br />
58% of <strong>age</strong> variance was related to bole diameter<br />
<strong>in</strong> the cohort 1 of Q. <strong>robur</strong>, while <strong>in</strong> the cohort 2<br />
<strong>age</strong> <strong>and</strong> diameter shared over 19% of variance (Table<br />
5).<br />
Age <strong>estimates</strong> obta<strong>in</strong>ed with cohort models were<br />
considerably more accurate <strong>and</strong> less biased than <strong>estimates</strong><br />
obta<strong>in</strong>ed with the overall models (Table 6). Accord<strong>in</strong>g<br />
to the mean absolute errors obta<strong>in</strong>ed <strong>and</strong> the<br />
<strong>age</strong> ranges of the different cohorts, the percent<strong>age</strong> errors<br />
for F. <strong>sylvatica</strong> were from 6.9 to 24% of actual<br />
<strong>age</strong> (13.4% <strong>in</strong> aver<strong>age</strong>) <strong>in</strong> young trees, <strong>and</strong> from 6 to<br />
9.1% (7.7% <strong>in</strong> aver<strong>age</strong>) <strong>in</strong> mature ones. Accord<strong>in</strong>gly,<br />
percent<strong>age</strong> errors <strong>in</strong> Q. <strong>robur</strong> were from 8 to 25% of<br />
actual <strong>age</strong> (14.2% <strong>in</strong> aver<strong>age</strong>) <strong>in</strong> young trees, <strong>and</strong><br />
from 11.4 to 21.6% of actual <strong>age</strong> (14% <strong>in</strong> aver<strong>age</strong>) <strong>in</strong><br />
mature <strong>in</strong>dividuals.<br />
This implied a reduction <strong>in</strong> the absolute error that<br />
ranged between 10 <strong>and</strong> 28 years, <strong>and</strong> between 6 <strong>and</strong><br />
26% <strong>in</strong> the percent<strong>age</strong> error, when the cohort models<br />
were used <strong>in</strong>stead of the overall model. Furthermore,
205<br />
Table 5. Regression equations for estimat<strong>in</strong>g tree <strong>age</strong> (y, years) from stem diameter (x, cm) for the populations considered as a whole (overall),<br />
<strong>and</strong> for each cohort separately. n: number of trees <strong>in</strong> each equation.<br />
Species Group n Equation r 2 p<br />
<strong>Fagus</strong> <strong>sylvatica</strong> Overall 209 y = 4.143 x 0.876
206<br />
Discussion<br />
Cross-dat<strong>in</strong>g vs. r<strong>in</strong>g count<strong>in</strong>g<br />
In mature trees, errors associated with r<strong>in</strong>g count<strong>in</strong>g<br />
were reduced only slightly by cross-dat<strong>in</strong>g, which<br />
permitted the identification of 1.2% of F. <strong>sylvatica</strong><br />
r<strong>in</strong>gs, <strong>and</strong> 0.2% of the r<strong>in</strong>gs of Q. <strong>robur</strong>. But the<br />
pr<strong>in</strong>cipal benefit of cross-dat<strong>in</strong>g is that it made possible<br />
to date correctly all the float<strong>in</strong>g growth series,<br />
i.e. to estimate the <strong>age</strong> of the mature trees whose<br />
cores showed anomalies <strong>in</strong> outer segments. This happened<br />
<strong>in</strong> 6.8% of F. <strong>sylvatica</strong> trees, <strong>in</strong> which the 6 to<br />
117 outermost r<strong>in</strong>gs were unidentifiable, <strong>and</strong> <strong>in</strong> 41%<br />
of all the mature Q. <strong>robur</strong>, with 7 to 151 undef<strong>in</strong>ed<br />
f<strong>in</strong>al r<strong>in</strong>gs. These trees would otherwise have been<br />
discarded for <strong>age</strong> estimation based on <strong>in</strong>crement<br />
cores.<br />
The results obta<strong>in</strong>ed when cross-dat<strong>in</strong>g techniques<br />
were applied to cores taken from young trees can be<br />
expla<strong>in</strong>ed by consider<strong>in</strong>g the porosity pattern <strong>in</strong> the<br />
wood of both species. The wood of Q. <strong>robur</strong> is r<strong>in</strong>gporous<br />
(Schwe<strong>in</strong>gruber 1990) so that r<strong>in</strong>g limits are<br />
clearly dist<strong>in</strong>guishable, even <strong>in</strong> the colorless sapwood<br />
of the young trees, because of the alignment of large<br />
vessels <strong>in</strong> the earlywood. Therefore it is extremely<br />
rare <strong>in</strong> this species to overestimate the number of<br />
r<strong>in</strong>gs by r<strong>in</strong>g count<strong>in</strong>g: only <strong>in</strong> 2% of the cores a<br />
s<strong>in</strong>gle r<strong>in</strong>g more than the true number was recorded.<br />
By contrast, between 1 <strong>and</strong> 5 extra r<strong>in</strong>gs per core<br />
were obta<strong>in</strong>ed by r<strong>in</strong>g counts <strong>in</strong> 21% of the samples<br />
of F. <strong>sylvatica</strong>. This is a diffuse-porous to semi-r<strong>in</strong>gporous<br />
tree (Schwe<strong>in</strong>gruber 1990), <strong>and</strong> <strong>in</strong> young trees<br />
of this species the wood is very pale <strong>and</strong> it does not<br />
show contrast<strong>in</strong>g coloration between early- <strong>and</strong> latewood.<br />
Thus, variations <strong>in</strong> the density, diameter <strong>and</strong><br />
distribution of vessels can br<strong>in</strong>g about the consideration<br />
of a s<strong>in</strong>gle r<strong>in</strong>g as two. The tendency of r<strong>in</strong>g<br />
count<strong>in</strong>g to exaggerate <strong>age</strong> <strong>in</strong> young F. <strong>sylvatica</strong> trees<br />
can be reduced with a quite f<strong>in</strong>e polish <strong>and</strong> by us<strong>in</strong>g<br />
a colorant such as phlorogluc<strong>in</strong>ol, <strong>in</strong> order to more<br />
easily identify adjacent r<strong>in</strong>gs.<br />
In young trees of both species the occurrence of<br />
absent r<strong>in</strong>gs is frequent. Absent r<strong>in</strong>gs were more frequent<br />
<strong>in</strong> any given F. <strong>sylvatica</strong> tree (from 1 to 7 r<strong>in</strong>gs<br />
per sample) than <strong>in</strong> a Q. <strong>robur</strong> (1 or 2 r<strong>in</strong>gs per sample<br />
only). But the proportion of trees with absent<br />
r<strong>in</strong>gs was greater <strong>in</strong> Q. <strong>robur</strong> than <strong>in</strong> F. <strong>sylvatica</strong><br />
(63% aga<strong>in</strong>st 35%). Many of the absent r<strong>in</strong>gs identified<br />
<strong>in</strong> young F. <strong>sylvatica</strong> were consecutive, belong<strong>in</strong>g<br />
to three periods of growth suppression: 1928–<br />
1933, 1937–1943, <strong>and</strong> 1983–1997. In the Caviedes<br />
forest, closed-canopy phases have been identified<br />
around the years 1929 <strong>and</strong> 1938, <strong>and</strong> an <strong>in</strong>crease <strong>in</strong><br />
canopy density, due to overstory accession of new<br />
young trees, has been also recognized <strong>in</strong> 1978–1996<br />
(Rozas 2001).<br />
Radial growth of both tree species showed a positive<br />
response to precipitation <strong>in</strong> July (Rozas 2001).<br />
The years with deficient July ra<strong>in</strong> <strong>in</strong> the study area<br />
were 1928, 1935, 1943, 1968–1969, 1975 <strong>and</strong> 1986.<br />
Among these the 1928, 1943 <strong>and</strong> 1986 years co<strong>in</strong>cided<br />
with absent r<strong>in</strong>gs <strong>in</strong> young F. <strong>sylvatica</strong> trees.<br />
So, absent r<strong>in</strong>gs <strong>in</strong> this species probably derived from<br />
an <strong>in</strong>tense overshadow <strong>in</strong> closed-canopy periods <strong>and</strong>,<br />
to a lesser extent, from summer drought occurrence.<br />
But the identified absent r<strong>in</strong>gs <strong>in</strong> young Q. <strong>robur</strong> trees<br />
were not comparatively more abundant <strong>in</strong> any one<br />
year or period. Thus, underestimat<strong>in</strong>g the true number<br />
of Q. <strong>robur</strong> r<strong>in</strong>gs seems to be a consequence of<br />
r<strong>in</strong>g wedg<strong>in</strong>g alone, which might be related to the<br />
pronounced pith eccentricity.<br />
Improvements <strong>and</strong> applicability of graphical method<br />
In both tree species, <strong>and</strong> us<strong>in</strong>g both the geometric <strong>and</strong><br />
graphical methods, the accuracy <strong>in</strong> estimat<strong>in</strong>g the<br />
length of miss<strong>in</strong>g radius became smaller as the distance<br />
from the pith <strong>in</strong>creased. It has been previously<br />
stated that the majority of error <strong>in</strong> the estimation of<br />
the length of miss<strong>in</strong>g radius is due to non-concentric<br />
growth close to the pith (Duncan 1989). But this is<br />
not an appropriate conclusion of this work, because<br />
most error (20–43%) was related to the distance from<br />
the pith, while growth eccentricity expla<strong>in</strong>ed only a<br />
m<strong>in</strong>or fraction of error (0–10%). Thus, the tak<strong>in</strong>g of<br />
cores pass<strong>in</strong>g as close as possible to the pith is clearly<br />
advisable to m<strong>in</strong>imize errors <strong>in</strong> estimat<strong>in</strong>g pith position.<br />
Differences <strong>in</strong> accuracy between the geometric <strong>and</strong><br />
graphical methods were evidenced by the contrast<strong>in</strong>g<br />
radial growth geometry of both tree species. The radial<br />
growth of F. <strong>sylvatica</strong> is moderately eccentric,<br />
therefore the appearance of growth r<strong>in</strong>gs <strong>and</strong> rays<br />
roughly represents circumferences centered on the<br />
pith with their correspond<strong>in</strong>g radii. By contrast, radial<br />
growth of Q. <strong>robur</strong> is not quite concentric, which<br />
violates the requisites of geometric method. S<strong>in</strong>ce<br />
r<strong>in</strong>g boundaries of Q. <strong>robur</strong> cannot be considered as<br />
arcs of circumferences centered <strong>in</strong> the pith, the errors<br />
obta<strong>in</strong>ed from r<strong>in</strong>g arcs are significantly greater than<br />
the errors obta<strong>in</strong>ed from rays. Thus, the graphical
207<br />
method is more reliable than the geometric, provid<strong>in</strong>g<br />
better <strong>estimates</strong> of the length of miss<strong>in</strong>g radius<br />
when the eccentricity <strong>in</strong> radial growth is pronounced.<br />
Radial growth eccentricity is frequently a consequence<br />
of tree tilt<strong>in</strong>g, which may be due to strong<br />
w<strong>in</strong>ds, debris flow, snow avalanches, or soil creep <strong>in</strong><br />
slopes (Kaennel <strong>and</strong> Schwe<strong>in</strong>gruber 1995). In the<br />
Caviedes forest, growth eccentricity cannot be attributed<br />
to these reasons. The sampled trees were not<br />
subjected to flood disturbances, <strong>and</strong> were not located<br />
on pronounced mounta<strong>in</strong> slopes, susceptible to avalanches<br />
or mass movements of the soil. Although<br />
some stems showed a gentle angle, this was a consequence<br />
of lateral expansion of the tree to avoid the<br />
crowns of large, dom<strong>in</strong>ant neighbors. Thus, the more<br />
conv<strong>in</strong>c<strong>in</strong>g explanation for the pronounced eccentricity<br />
<strong>in</strong> Q. <strong>robur</strong> discs is that it is characteristic of this<br />
species, <strong>and</strong> happens even if environmental conditions<br />
are not favorable for eccentric growth occurrence.<br />
The new proposed graphical method for pith location<br />
can be widely applied <strong>in</strong> many tree species, us<strong>in</strong>g<br />
an adequate magnification to better identify <strong>and</strong><br />
sketch xylem rays. European woody species may be<br />
classified <strong>in</strong>to four categories on the basis of raywidths<br />
(Wheeler et al. 1989; Schwe<strong>in</strong>gruber 1990).<br />
Rays exclusively uniseriate occur <strong>in</strong> gymnosperms, as<br />
well as <strong>in</strong> Alnus spp., Corylus spp., Castanea sativa,<br />
Aesculus hippocastanum, <strong>and</strong> Salicaceae. Rays 1- to<br />
3-seriate are evident <strong>in</strong> some Acer species (e.g. A.<br />
campestre, A. opalus, A. tataricum), Betula spp.,<br />
Carp<strong>in</strong>us spp., Caprifoliaceae, Arbutus spp., Juglans<br />
regia, Lauraceae, Myrica faya, Oleaceae, Rhamnaceae,<br />
Rosaceae Maloideae, <strong>and</strong> Tilia spp. Rays 4- to<br />
10-seriate happen <strong>in</strong> Acer platanoides, A. pseudoplatanus,<br />
Ilex spp., Ostrya carp<strong>in</strong>ifolia, Erica arborea,<br />
Legum<strong>in</strong>osae, Platanus spp., Prunus spp., <strong>and</strong> Ulmaceae.<br />
F<strong>in</strong>ally, <strong>Fagus</strong> spp., <strong>Quercus</strong> spp., <strong>and</strong> Tamarix<br />
spp. show rays >10-seriate.<br />
In the first <strong>and</strong> second ray-width categories, moderate<br />
magnifications (up to 40×) are required to confidently<br />
sketch rays with the help of a stereomicroscope.<br />
In many species of the third category <strong>and</strong> <strong>in</strong><br />
all species of the fourth category, rays can be macroscopically<br />
observed on <strong>in</strong>crement cores, but a low<br />
magnification (up to 20×) is necessary to confidently<br />
draw rays <strong>and</strong> r<strong>in</strong>g-arcs. When cores are exam<strong>in</strong>ed<br />
under moderate magnifications, <strong>in</strong>stead of trac<strong>in</strong>g the<br />
complete rays, it is advisable to put a mark on the<br />
transparent tape at two separated po<strong>in</strong>ts on each ray.<br />
This procedure avoids probable <strong>in</strong>accuracies due to<br />
difficulties <strong>in</strong> h<strong>and</strong>l<strong>in</strong>g a pen magnified more than 20<br />
times its actual size.<br />
Other anatomical features that occur <strong>in</strong> a few taxonomic<br />
groups can facilitate the application of the<br />
graphical method. In many conifers such as Cedrus<br />
spp, Larix decidua, Picea spp. <strong>and</strong> P<strong>in</strong>us spp., broad<br />
rays with radial res<strong>in</strong> canals are frequent, so that these<br />
can be readily observed under low magnification <strong>and</strong><br />
used for pith location. Moreover, aggregate rays occur<br />
<strong>in</strong> many species of Betulaceae (Alnus spp. except<br />
A. viridis, Betula humilis) <strong>and</strong> Corylaceae (Carp<strong>in</strong>us<br />
spp., Corylus spp.). Aggregate rays are composed of<br />
a number of <strong>in</strong>dividual rays separated by axial elements,<br />
but so closely associated with one another that<br />
they appear macroscopically as a s<strong>in</strong>gle large ray<br />
(Wheeler et al. 1989). However, aggregate rays may<br />
be relatively <strong>in</strong>frequent, so they could be easily overlooked<br />
or absent <strong>in</strong> the <strong>in</strong>nermost segment of a core.<br />
Therefore, aggregate rays should be used only <strong>in</strong><br />
those samples show<strong>in</strong>g them <strong>in</strong> an adequate position<br />
to estimate pith location.<br />
Improvements of IRG models for <strong>age</strong> estimation<br />
The smallest mean absolute error <strong>in</strong> estimat<strong>in</strong>g the<br />
number of miss<strong>in</strong>g r<strong>in</strong>gs for both tree species was<br />
obta<strong>in</strong>ed by comb<strong>in</strong><strong>in</strong>g the graphical method with the<br />
IRG model. The aver<strong>age</strong> of these errors was 8 years<br />
for F. <strong>sylvatica</strong> <strong>and</strong> 4 years for Q. <strong>robur</strong>, which corresponded<br />
to the respective deviations of ±35% <strong>and</strong><br />
±22% from the true number of miss<strong>in</strong>g r<strong>in</strong>gs. The<br />
sampled discs of F. <strong>sylvatica</strong> ranged from 184 to 250<br />
years <strong>in</strong> <strong>age</strong>, hence this comb<strong>in</strong>ation of methods displayed<br />
mean deviations between ±3.3% <strong>and</strong> ±4.4% of<br />
total <strong>age</strong> for mature trees of this species. The discs of<br />
Q. <strong>robur</strong> were from 125 to 239 years old, thus errors<br />
<strong>in</strong> total <strong>age</strong> estimation varied from ±1.8% to ±3.4%.<br />
These ranges of error are smaller than mean errors<br />
previously assessed for different methods <strong>and</strong> tree<br />
species, which are ±10% (Norton et al. 1987) <strong>and</strong><br />
±5% (Duncan 1989) of actual <strong>age</strong>.<br />
The calculated errors were valid for most of the<br />
cored trees <strong>in</strong> the Caviedes forest. In F. <strong>sylvatica</strong>,<br />
43.6% of cores showed the pith <strong>and</strong> 55% showed the<br />
arcs of the <strong>in</strong>ner r<strong>in</strong>gs. In Q. <strong>robur</strong>, 26.4% of cores<br />
<strong>in</strong>cluded the pith <strong>and</strong> 62.8% showed the arcs of the<br />
<strong>in</strong>ner r<strong>in</strong>gs. The rema<strong>in</strong><strong>in</strong>g <strong>in</strong>dividuals provided partial<br />
cores without <strong>in</strong>ner r<strong>in</strong>g arcs, or cores unusable<br />
for <strong>age</strong> estimation. The calculated errors are valid for<br />
partial cores with lengths of miss<strong>in</strong>g radii up to 55<br />
mm, <strong>and</strong> only one F. <strong>sylvatica</strong> <strong>and</strong> two Q. <strong>robur</strong> cores
208<br />
were outside this distance. Thus, the tests achieved<br />
accounted for error <strong>in</strong> <strong>age</strong> <strong>estimates</strong> <strong>in</strong> 54.8% of F.<br />
<strong>sylvatica</strong> trees <strong>and</strong> <strong>in</strong> 61.3% of Q. <strong>robur</strong> ones.<br />
The largest mean error for F. <strong>sylvatica</strong> might be<br />
due to the different <strong>in</strong>itial growth rates of the samples<br />
used for model calibration <strong>and</strong> the ones used for its<br />
validation (1.85 ± 1.09 mm for calibration, 1.21<br />
(±0.90 mm for validation, unpaired t = 17.02, df =<br />
3050, p < 0.001). The errors obta<strong>in</strong>ed for F. <strong>sylvatica</strong><br />
would be valid only for <strong>estimates</strong> achieved on cores<br />
taken from trees more than 180 years old. Probably<br />
the <strong>age</strong>s estimated <strong>in</strong> <strong>in</strong>dividuals with a similar <strong>age</strong><br />
to trees used for model calibration (i.e.
209<br />
greater for trees established earlier, smaller for later<br />
established ones. As has been previously stated,<br />
widely different cohorts <strong>in</strong> a population of trees, each<br />
with their own <strong>age</strong>-diameter relationships, can artificially<br />
<strong>in</strong>flate the global correlation between <strong>age</strong> <strong>and</strong><br />
diameter (Stewart 1986). Thus, the most statistically<br />
significant equation is not necessarily the most accurate<br />
predictive model with which to estimate tree <strong>age</strong><br />
from diameter. Accord<strong>in</strong>g to the results obta<strong>in</strong>ed, errors<br />
<strong>in</strong> estimat<strong>in</strong>g <strong>age</strong> from diameter <strong>in</strong> F. <strong>sylvatica</strong><br />
<strong>and</strong> Q. <strong>robur</strong> were notably <strong>in</strong>ferior when cohort equations<br />
were used, even if equations of the complete<br />
population showed the highest <strong>and</strong> more significant<br />
r 2 values.<br />
A common practice <strong>in</strong> forest dynamics research is<br />
to <strong>age</strong> a sub-sample of trees, to calculate their <strong>age</strong>diameter<br />
relationship, <strong>and</strong> to estimate the <strong>age</strong> of the<br />
rema<strong>in</strong><strong>in</strong>g trees from their diameters with the calculated<br />
equation (Veblen 1992). But doubts about the<br />
precision of <strong>age</strong> <strong>estimates</strong>, based of the <strong>age</strong>-diameter<br />
equations, have been reasonably stated (Harper 1977;<br />
Norton <strong>and</strong> Ogden 1990). Accord<strong>in</strong>g to the results<br />
obta<strong>in</strong>ed <strong>in</strong> this work, the <strong>age</strong>s of a stratified subsample<br />
of trees can be confidently estimated from<br />
cores show<strong>in</strong>g the pith, <strong>and</strong> show<strong>in</strong>g the arcs of the<br />
<strong>in</strong>ner r<strong>in</strong>gs. Then, the different cohorts may be identified,<br />
so that cohort equations can be derived <strong>and</strong><br />
used to estimate <strong>age</strong>.<br />
The equations correspond<strong>in</strong>g to cohort 1 provided<br />
<strong>age</strong> <strong>estimates</strong> with a similar accuracy to those obta<strong>in</strong>ed<br />
by us<strong>in</strong>g IRG models (5–6 years vs. 4–8 years<br />
<strong>in</strong> absolute errors, respectively), <strong>and</strong> clearly improved<br />
the <strong>estimates</strong> obta<strong>in</strong>ed with RGR <strong>and</strong> BAI methods.<br />
Moreover, the range of percent<strong>age</strong> error obta<strong>in</strong>ed with<br />
the equation of cohort 2 is equal to the obta<strong>in</strong>ed with<br />
the RGR20 method <strong>in</strong> Q. <strong>robur</strong> (11–22% of actual<br />
<strong>age</strong>), <strong>and</strong> smaller than that obta<strong>in</strong>ed <strong>in</strong> F. <strong>sylvatica</strong><br />
with the same method (6–9% vs. 15–21% of actual<br />
<strong>age</strong>). As a consequence, cohort equations based on a<br />
stratified sub-sample of trees, may be confidently<br />
used for <strong>age</strong> estimation <strong>in</strong> young trees, <strong>and</strong> may be<br />
also used <strong>in</strong> mature trees <strong>in</strong>stead of RGR methods.<br />
A limitation of the method is that it can be fairly<br />
applied only to trees with stem diameters similar to<br />
the ones used to calibrate the <strong>age</strong>-diameter equations.<br />
Thus, <strong>in</strong>direct methods could be applied <strong>in</strong> this forest<br />
to F. <strong>sylvatica</strong> trees with maximum a diameter of 80<br />
cm, <strong>and</strong> to Q. <strong>robur</strong> trees with diameters up to 100<br />
cm. But hollow F. <strong>sylvatica</strong> trees of more than 100<br />
cm <strong>in</strong> diameter, <strong>and</strong> Q. <strong>robur</strong> trees with diameters<br />
over 150 cm are frequent <strong>in</strong> some forests at Northern<br />
Spa<strong>in</strong>. Accurate <strong>age</strong> estimation <strong>in</strong> these large trees is,<br />
at the moment, clearly tentative <strong>and</strong> unrealistic.<br />
Limitations of tree <strong>age</strong> <strong>estimates</strong><br />
A first limitation regard<strong>in</strong>g any method of total tree<br />
<strong>age</strong> estimation is that the time between germ<strong>in</strong>ation<br />
<strong>and</strong> until the tree reached cor<strong>in</strong>g height is likely to be<br />
unknown (Veblen 1992). In gymnosperms <strong>and</strong> dicotyledonous<br />
plants, the germ<strong>in</strong>ation po<strong>in</strong>t is located at<br />
the root collar, which constitutes the boundary between<br />
the root without pith <strong>and</strong> the stem with pith<br />
(Telewski 1993). To <strong>age</strong> sprouts it is not advisable to<br />
correct for cor<strong>in</strong>g height because of vigorous <strong>in</strong>itial<br />
height growth (Brodie et al. 1995; Tardif <strong>and</strong> Bergeron<br />
1999). But <strong>in</strong> trees of sexual orig<strong>in</strong>, a correction<br />
factor should be applied to supply the loss of growth<br />
r<strong>in</strong>gs.<br />
The correction factor can be calculated from a subsample<br />
of seedl<strong>in</strong>gs or trees, as the mean difference<br />
between the number of r<strong>in</strong>gs at ground level <strong>and</strong> at<br />
cor<strong>in</strong>g height (Henry <strong>and</strong> Swan 1974; Veblen 1989).<br />
Other alternative method can be the us<strong>age</strong> of <strong>age</strong>height<br />
regression equations calibrated from sapl<strong>in</strong>gs<br />
or trees sectioned at regular height <strong>in</strong>tervals (Lusk<br />
<strong>and</strong> Ogden 1992; Szeicz <strong>and</strong> MacDonald 1995). To<br />
test the accuracy of these methods, many sapl<strong>in</strong>gs <strong>and</strong><br />
adult trees must be destructively harvested so as to<br />
identify <strong>and</strong> date the exact germ<strong>in</strong>ation level <strong>in</strong> each<br />
one. Obviously, this is an important limitation for<br />
test<strong>in</strong>g methods of total tree <strong>age</strong> estimation (see Wong<br />
<strong>and</strong> Lertzman (2001) for a new approach to assess the<br />
uncerta<strong>in</strong>ty around dates of tree establishment based<br />
on Monte Carlo simulations).<br />
It must be taken <strong>in</strong>to account that all the methods<br />
described <strong>and</strong> checked <strong>in</strong> this work allow an estimation<br />
of the <strong>age</strong> of a given stem, which may or may<br />
not co<strong>in</strong>cide with <strong>age</strong> of the tree s<strong>in</strong>ce germ<strong>in</strong>ation.<br />
This is because vegetative reproduction by root suckers,<br />
root-collar sprouts, or layer<strong>in</strong>g is common <strong>in</strong><br />
many species of trees (Koop 1987; Ohkubo 1992;<br />
Fernández-Palacios <strong>and</strong> Arévalo 1998). Thus, if the<br />
vegetative orig<strong>in</strong> from an older <strong>in</strong>dividual can be discarded<br />
for a tree, then its <strong>age</strong> s<strong>in</strong>ce germ<strong>in</strong>ation can<br />
be estimated. However, <strong>in</strong> many studies on tree regeneration<br />
<strong>and</strong> forest dynamics, the dat<strong>in</strong>g of both<br />
tree germ<strong>in</strong>ation <strong>and</strong> sprout<strong>in</strong>g is equally useful (Brodie<br />
et al. 1995; Tardif <strong>and</strong> Bergeron 1999).<br />
<strong>Tree</strong> germ<strong>in</strong>ation dat<strong>in</strong>g should take <strong>in</strong>to account<br />
that errors <strong>in</strong> the different methods may be additive<br />
(Duncan 1989; Villalba <strong>and</strong> Veblen 1997). The over-
210<br />
all error could <strong>in</strong>clude the error of r<strong>in</strong>g count<strong>in</strong>g, plus<br />
the error <strong>in</strong> estimat<strong>in</strong>g the number of miss<strong>in</strong>g r<strong>in</strong>gs to<br />
the pith, plus the error <strong>in</strong> estimat<strong>in</strong>g the number of<br />
miss<strong>in</strong>g r<strong>in</strong>gs to the root-shoot boundary. These errors<br />
can be contradictory, cancel<strong>in</strong>g each other out. But if<br />
all the <strong>estimates</strong> are biased to either over- or underestimat<strong>in</strong>g<br />
the number of r<strong>in</strong>gs, then the errors will<br />
be cumulative. Thus, the f<strong>in</strong>al magnitude <strong>and</strong> sign of<br />
error cannot be predicted, even if the mean error <strong>and</strong><br />
the bias of each method used are known (Norton <strong>and</strong><br />
Ogden 1990). A careful sampl<strong>in</strong>g <strong>and</strong> analysis of<br />
these samples, <strong>and</strong> the utilization of more accurate<br />
methods, are the only guarantees of arriv<strong>in</strong>g at reasonable<br />
tree <strong>age</strong> <strong>estimates</strong>.<br />
Conclusions<br />
Accuracy <strong>in</strong> estimat<strong>in</strong>g tree <strong>age</strong> is due to the conjunction<br />
of several factors, such as wood anatomical features<br />
(r<strong>in</strong>g boundary dist<strong>in</strong>ctness, porosity pattern, ray<br />
width), growth geometry, live history traits (sexual or<br />
vegetative orig<strong>in</strong>, growth patterns, shade tolerance),<br />
environmental variability (climatic fluctuations, competition<br />
<strong>in</strong>tensity, disturbances), <strong>and</strong> specific faults <strong>in</strong><br />
the samples (hidden scars, knots, local wood decay,<br />
rotten piths). Sampl<strong>in</strong>g procedures <strong>and</strong> methods of<br />
<strong>age</strong> estimation should consider all these factors as<br />
potential sources of error which can be m<strong>in</strong>imized. As<br />
a general rule, the closer to the pith a core is taken,<br />
the more accurate is <strong>age</strong> estimation based on the core.<br />
But while bisect<strong>in</strong>g the pith, or at least pass<strong>in</strong>g close<br />
to it, is clearly advant<strong>age</strong>ous to improve tree <strong>age</strong> estimation,<br />
this alone does not def<strong>in</strong>itely guarantee unbiased<br />
<strong>estimates</strong>.<br />
The errors obta<strong>in</strong>ed when r<strong>in</strong>g count<strong>in</strong>g only is<br />
used are small <strong>and</strong> acceptable. However, a capital<br />
achievement of cross-dat<strong>in</strong>g is its ability to synchronize<br />
the float<strong>in</strong>g r<strong>in</strong>g width series, which can be relatively<br />
abundant with<strong>in</strong> a set of cores. The graphical<br />
method for pith location (based on rays converg<strong>in</strong>g<br />
on the pith) is more accurate than the geometric<br />
(based on r<strong>in</strong>g curvature) for any degree of radial<br />
growth eccentricity. The graphical method is quite<br />
simple <strong>and</strong> rapid. It can produce several hundred <strong>estimates</strong><br />
<strong>in</strong> a day, <strong>and</strong> it is not <strong>in</strong>fluenced by subjective<br />
aspects that could bias the results.<br />
The bias of <strong>age</strong> <strong>estimates</strong> <strong>in</strong> shade-tolerant species<br />
is greater. This is due to large variations <strong>in</strong> their radial<br />
growth rate <strong>in</strong> comparison to the <strong>in</strong>tolerant species,<br />
which grow <strong>in</strong> a more predictable way. The <strong>in</strong>itial<br />
radial growth model, as applied <strong>in</strong> this study, do<br />
not require constant growth rate over the central segment<br />
of the cores, <strong>and</strong> provide unbiased <strong>age</strong> <strong>estimates</strong>.<br />
The comb<strong>in</strong>ation of the graphical method <strong>and</strong><br />
the <strong>in</strong>itial radial growth model is more accurate than<br />
any other comb<strong>in</strong>ation of methods tested.<br />
Methods of extrapolation of mean basal area <strong>in</strong>crements<br />
can be used with confidence only <strong>in</strong> trees with<br />
a decl<strong>in</strong><strong>in</strong>g radial growth series, such as <strong>in</strong> xeric<br />
woodl<strong>and</strong>s or for open-grown trees, which usually<br />
show a negative exponential growth pattern (Fritts<br />
1976). Age-diameter models for the different cohorts<br />
provide better <strong>age</strong> <strong>estimates</strong> than if overall population<br />
models are used. An unavoidable requirement to apply<br />
<strong>age</strong>-diameter models based on cohorts, is the use<br />
of an extensive number of precise <strong>age</strong> <strong>estimates</strong> from<br />
<strong>in</strong>crement cores, that clearly identify the different cohorts.<br />
If the <strong>age</strong> structure is discont<strong>in</strong>uous, with few<br />
well-differentiated cohorts, then the cohort models<br />
can be confidently used.<br />
Numerous procedures for tree <strong>age</strong> estimation have<br />
been used <strong>in</strong> the literature, but only a few of these<br />
have been reasonably tested. Objectivity used to be<br />
the unique requirement to validate procedures for estimat<strong>in</strong>g<br />
tree <strong>age</strong>s. But accuracy <strong>and</strong> reproducibility<br />
are essential properties of any method used <strong>in</strong> scientific<br />
research. Thus, <strong>in</strong> order to effectively improve<br />
tree <strong>age</strong> <strong>estimates</strong>, it is essential to ignore questionable<br />
assumptions, to avoid subjective procedures, <strong>and</strong><br />
to <strong>in</strong>quire about more accurate techniques.<br />
Acknowledgements<br />
I am very grateful to Carlos LeQuesne for advice on<br />
dendrochronological methodology, Luis Cabo for a<br />
critical review of the manuscript, <strong>and</strong> Kenneth McKenney<br />
for English langu<strong>age</strong> assistance. Three anonymous<br />
referees provided useful comments on an earlier<br />
version of the paper. The Junta Vec<strong>in</strong>al de Caviedes<br />
<strong>and</strong> the Servicio de Montes y Conservación dela<br />
Naturaleza de Cantabria gave the permissions for tak<strong>in</strong>g<br />
cores <strong>and</strong> stem discs <strong>in</strong> the Caviedes forest.<br />
References<br />
Ågren J. <strong>and</strong> Zackrisson O. 1990. Age <strong>and</strong> size structure of P<strong>in</strong>us<br />
sylvestris populations on mires <strong>in</strong> central <strong>and</strong> northern Sweden.<br />
Journal of Ecology 78: 1049–1062.
211<br />
AIWA 1989. IAWA list of microscopic features for hardwood identification.<br />
IAWA Bullet<strong>in</strong> 10: 219–332.<br />
Baker W.L. 1992. Structure, disturbance, <strong>and</strong> change <strong>in</strong> the bristlecone<br />
p<strong>in</strong>e forests of Colorado, USA. Arctic <strong>and</strong> Alp<strong>in</strong>e Research<br />
24: 17–26.<br />
Brodie C., Houle G. <strong>and</strong> Fort<strong>in</strong> M.-J. 1995. Development of a<br />
Populus balsamifera clone <strong>in</strong> subarctic Québec reconstructed<br />
from spatial analyses. Journal of Ecology 83: 309–320.<br />
Dietz H. <strong>and</strong> Ullmann I. 1997. Age determ<strong>in</strong>ation of dicotyledonous<br />
perennials by means of annual r<strong>in</strong>gs: exception or rule?<br />
Annals of Botany 80: 377–379.<br />
Donnegan J.A. <strong>and</strong> Rebertus A.J. 1999. Rates <strong>and</strong> mechanisms of<br />
subalp<strong>in</strong>e forest succession along an environmental gradient.<br />
Ecology 80: 1370–1384.<br />
Duncan R. 1989. An evaluation of errors <strong>in</strong> tree <strong>age</strong> <strong>estimates</strong> based<br />
on <strong>in</strong>crement cores <strong>in</strong> kahikatea (Dacrycarpus dacrydioides).<br />
New Zeal<strong>and</strong> Natural Sciences 16: 31–37.<br />
Duncan R.P. 1993. Flood disturbance <strong>and</strong> the coexistence of species<br />
<strong>in</strong> a lowl<strong>and</strong> podocarp forest, south Westl<strong>and</strong>, New<br />
Zeal<strong>and</strong>. Journal of Ecology 81: 403–416.<br />
Fernández-Palacios J.M. <strong>and</strong> Arévalo J.R. 1998. Regeneration<br />
strategies of tree species <strong>in</strong> the laurel forest of Tenerife (The<br />
Canary Isl<strong>and</strong>s). Plant Ecology 137: 21–29.<br />
Frelich L.E. <strong>and</strong> Graumlich L.J. 1994. Age-class distribution <strong>and</strong><br />
spatial patterns <strong>in</strong> an old-growth hemlock-hardwood forest. Canadian<br />
Journal of Forest Research 24: 1939–1947.<br />
Fritts H.C. 1976. <strong>Tree</strong> R<strong>in</strong>gs <strong>and</strong> Climate. Academic Press, London.<br />
Harper J.L. 1977. Population Biology of Plants. Academic Press,<br />
London.<br />
Henry J.D. <strong>and</strong> Swan J.M.A. 1974. Reconstruct<strong>in</strong>g forest history<br />
from live <strong>and</strong> dead plant material–-An approach to the study of<br />
forest succession <strong>in</strong> southwest New Hampshire. Ecology 55:<br />
772–783.<br />
Holmes R.L. 1983. Computer-assisted quality control <strong>in</strong> tree-r<strong>in</strong>g<br />
dat<strong>in</strong>g <strong>and</strong> measurement. <strong>Tree</strong>-R<strong>in</strong>g Bullet<strong>in</strong> 43: 69–78.<br />
Johnson E.A. <strong>and</strong> Fryer G.I. 1989. Population dynamics <strong>in</strong> lodgepole<br />
p<strong>in</strong>e-Engelmann spruce forests. Ecology 70: 1335–1345.<br />
Kaennel M. <strong>and</strong> Schwe<strong>in</strong>gruber F.H. 1995. Multil<strong>in</strong>gual Glossary<br />
of Dendrochronology. Terms <strong>and</strong> Def<strong>in</strong>itions <strong>in</strong> English, German,<br />
French, Spanish, Italian, Portuguese, <strong>and</strong> Russian. Swiss<br />
Federal Institute for Forest, Snow <strong>and</strong> L<strong>and</strong>scape Research,<br />
Haupt, Stuttgart.<br />
Kelly P.E. <strong>and</strong> Larson D.W. 1997. Dendroecological analysis of the<br />
population dynamics of an old-growth forest on cliff-faces of<br />
the Niagara Escarpment, Canada. Journal of Ecology 85: 467–<br />
478.<br />
Koop H. 1987. Vegetative reproduction of trees <strong>in</strong> some European<br />
natural forests. Vegetatio 72: 103–110.<br />
Lorimer C.G. 1980. Age structure <strong>and</strong> disturbance history of a<br />
southern Appalachian virg<strong>in</strong> forest. Ecology 61: 1169–1184.<br />
Lusk C. <strong>and</strong> Ogden J. 1992. Age structure <strong>and</strong> dynamics of a<br />
podocarp-broadleaf forest <strong>in</strong> Tongariro National Park, New<br />
Zeal<strong>and</strong>. Journal of Ecology 80: 379–393.<br />
Lusk C.H. <strong>and</strong> Smith B. 1998. Life history differences <strong>and</strong> tree<br />
species coexistence <strong>in</strong> an old-growth New Zeal<strong>and</strong> ra<strong>in</strong> forest.<br />
Ecology 79: 795–806.<br />
Mikan C.J., Orwig D.A. <strong>and</strong> Abrams M.D. 1994. Age structure <strong>and</strong><br />
successional dynamics of a presettlement-orig<strong>in</strong> chestnut oak<br />
forest <strong>in</strong> the Pennsylvania Piedmont. Bullet<strong>in</strong> of the Torrey Botanical<br />
Club 121: 13–23.<br />
Nakashizuka T. <strong>and</strong> Numata M. 1982. Regeneration process of climax<br />
beech forests I. Structure of a beech forest with the undergrowth<br />
of Sasa. Japanese Journal of Ecology 32: 57–67.<br />
Norton D.A. <strong>and</strong> Ogden J. 1990. Problems with the use of tree<br />
r<strong>in</strong>gs <strong>in</strong> the study of forest population dynamics. In: Cook E.R.<br />
<strong>and</strong> Kairiukstis L.A. (eds), Methods of Dendrochronology: Applications<br />
<strong>in</strong> the Environmental Science. Kluwer Academic<br />
Publishers, Dordrecht, pp. 284–288.<br />
Norton D.A., Palmer J.G. <strong>and</strong> Ogden J. 1987. Dendroecological<br />
studies <strong>in</strong> New Zeal<strong>and</strong> 1. An evaluation of tree <strong>age</strong> <strong>estimates</strong><br />
based on <strong>in</strong>crement cores. New Zeal<strong>and</strong> Journal of Botany 25:<br />
373–383.<br />
Ogden J. 1985. Past, present <strong>and</strong> future: Studies on the population<br />
dynamics of some long-lived trees. In: White J. (ed.), Studies<br />
on Plant Demography: A Festschrift for John L. Harper. Academic<br />
Press, London, pp. 3–16.<br />
Ohkubo T. 1992. Structure <strong>and</strong> dynamics of Japanese beech (<strong>Fagus</strong><br />
japonica Maxim.) stools <strong>and</strong> sprouts <strong>in</strong> the regeneration of<br />
the natural forests. Vegetatio 101: 65–80.<br />
Rozas V. 2001. Detect<strong>in</strong>g the impact of climate <strong>and</strong> disturbances<br />
on tree-r<strong>in</strong>gs of <strong>Fagus</strong> <strong>sylvatica</strong> L. <strong>and</strong> <strong>Quercus</strong> <strong>robur</strong> L. <strong>in</strong> a<br />
lowl<strong>and</strong> forest <strong>in</strong> Cantabria, Northern Spa<strong>in</strong>. Annals of Forest<br />
Science 58: 237–251.<br />
Schwe<strong>in</strong>gruber F.H. 1990. Anatomy of European Woods. Swiss<br />
Federal Institute for Forest, Snow <strong>and</strong> L<strong>and</strong>scape Research,<br />
Haupt, Stuttgart.<br />
Stephenson P.L. <strong>and</strong> Demetry A. 1995. Estimat<strong>in</strong>g <strong>age</strong>s of giant<br />
sequoias. Canadian Journal of Forest Research 25: 223–233.<br />
Stewart G.H. 1986. Population dynamics of a montane conifer forest,<br />
western Cascade Range, Oregon, USA. Ecology 67: 543–<br />
544.<br />
Stewart G.H. <strong>and</strong> Rose A.B. 1990. The significance of life history<br />
strategies <strong>in</strong> the developmental history of mixed beech (Nothofagus)<br />
forests, New Zeal<strong>and</strong>. Vegetatio 87: 101–114.<br />
Stokes M.A. <strong>and</strong> Smiley T.L. 1968. An Introduction to <strong>Tree</strong>-R<strong>in</strong>g<br />
Dat<strong>in</strong>g. University of Chicago Press, Chicago.<br />
Szeicz J.M. <strong>and</strong> MacDonald G.M. 1995. Recent white spruce dynamics<br />
at the subarctic alp<strong>in</strong>e treel<strong>in</strong>e of north-western Canada.<br />
Journal of Ecology 83: 873–885.<br />
Tardif J. <strong>and</strong> Bergeron Y. 1999. Population dynamics of Frax<strong>in</strong>us<br />
nigra <strong>in</strong> response to flood-level variations, <strong>in</strong> northwestern<br />
Quebec. Ecological Monographs 69: 107–125.<br />
Taylor A.H., Q<strong>in</strong> Zisheng <strong>and</strong> Liu Jie 1996. Structure <strong>and</strong> dynamics<br />
of subalp<strong>in</strong>e forests <strong>in</strong> the Wang Lang Natural Reserve, Sichuan,<br />
Ch<strong>in</strong>a. Vegetatio 124: 25–38.<br />
Telewski F.W. 1993. Determ<strong>in</strong><strong>in</strong>g the germ<strong>in</strong>ation date of woody<br />
plants: A proposed method for locat<strong>in</strong>g the root/shoot <strong>in</strong>terface.<br />
<strong>Tree</strong>-R<strong>in</strong>g Bullet<strong>in</strong> 53: 13–16.<br />
Tut<strong>in</strong> T.G., Heywood V.H., Burges N.A., Moore D.M., Valent<strong>in</strong>e<br />
D.H., Walters S.M. et al. (eds) 1964-68. Flora Europaea. I–II.<br />
Cambridge University Press, London.<br />
Veblen T.T. 1989. Nothofagus regeneration <strong>in</strong> treefall gaps <strong>in</strong> northern<br />
Patagonia. Canadian Journal of Forest Research 19: 365–<br />
371.<br />
Veblen T.T. 1992. Regeneration dynamics. In: Glenn-Lew<strong>in</strong> D.C.,<br />
Peet R.K. <strong>and</strong> Veblen T.T. (eds), Plant Succession: Theory <strong>and</strong><br />
Prediction. Chapman & Hall, London, pp. 152–187.<br />
Villalba R. <strong>and</strong> Veblen T.T. 1997. Improv<strong>in</strong>g <strong>estimates</strong> of total tree<br />
<strong>age</strong>s based on <strong>in</strong>crement core samples. Ecoscience 4: 534–542.
212<br />
Wong C.M. <strong>and</strong> Lertzman K.P. 2001. Errors <strong>in</strong> estimat<strong>in</strong>g tree <strong>age</strong>:<br />
implications for studies of st<strong>and</strong> dynamics. Canadian Journal<br />
of Forest Research 31: 1262–1271.<br />
Worbes M. 1999. Annual growth r<strong>in</strong>gs, ra<strong>in</strong>fall-dependent growth<br />
<strong>and</strong> long-term growth patterns of tropical trees from the Caparo<br />
Forest Reserve <strong>in</strong> Venezuela. Journal of Ecology 87: 391–403.