Appendix P Drainage, Flooding, Stormwater Management Part 5
Appendix P Drainage, Flooding, Stormwater Management Part 5
Appendix P Drainage, Flooding, Stormwater Management Part 5

You also want an ePaper? Increase the reach of your titles
YUMPU automatically turns print PDFs into web optimized ePapers that Google loves.
<strong>Flooding</strong>, <strong>Drainage</strong> and <strong>Stormwater</strong> <strong>Management</strong><br />
Sanctuary Villages<br />
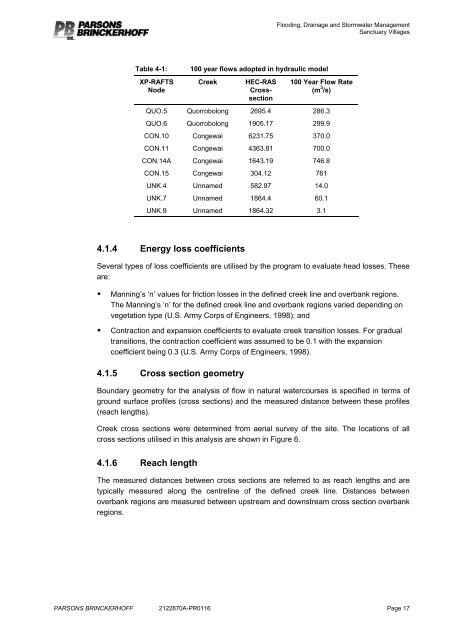
Table 4-1:<br />
XP-RAFTS<br />
Node<br />
100 year flows adopted in hydraulic model<br />
Creek<br />
HEC-RAS<br />
Crosssection<br />
100 Year Flow Rate<br />
(m 3 /s)<br />
QUO.5 Quorrobolong 2695.4 286.3<br />
QUO.6 Quorrobolong 1905.17 299.9<br />
CON.10 Congewai 6231.75 370.0<br />
CON.11 Congewai 4363.81 700.0<br />
CON.14A Congewai 1643.19 746.8<br />
CON.15 Congewai 304.12 761<br />
UNK.4 Unnamed 582.97 14.0<br />
UNK.7 Unnamed 1864.4 60.1<br />
UNK.9 Unnamed 1864.32 3.1<br />
4.1.4 Energy loss coefficients<br />
Several types of loss coefficients are utilised by the program to evaluate head losses. These<br />
are:<br />
<br />
<br />
Manning’s ‘n’ values for friction losses in the defined creek line and overbank regions.<br />
The Manning’s ‘n’ for the defined creek line and overbank regions varied depending on<br />
vegetation type (U.S. Army Corps of Engineers, 1998); and<br />
Contraction and expansion coefficients to evaluate creek transition losses. For gradual<br />
transitions, the contraction coefficient was assumed to be 0.1 with the expansion<br />
coefficient being 0.3 (U.S. Army Corps of Engineers, 1998).<br />
4.1.5 Cross section geometry<br />
Boundary geometry for the analysis of flow in natural watercourses is specified in terms of<br />
ground surface profiles (cross sections) and the measured distance between these profiles<br />
(reach lengths).<br />
Creek cross sections were determined from aerial survey of the site. The locations of all<br />
cross sections utilised in this analysis are shown in Figure 6.<br />
4.1.6 Reach length<br />
The measured distances between cross sections are referred to as reach lengths and are<br />
typically measured along the centreline of the defined creek line. Distances between<br />
overbank regions are measured between upstream and downstream cross section overbank<br />
regions.<br />
PARSONS BRINCKERHOFF 2122870A-PR0116 Page 17