Project Report.pdf - Planet Action
Project Report.pdf - Planet Action
Project Report.pdf - Planet Action

Create successful ePaper yourself
Turn your PDF publications into a flip-book with our unique Google optimized e-Paper software.
Title: Assessment of Eco-environmental Vulnerability in Efon alaye<br />
Eco-environmental risk assessment in Efon alaye.<br />
Country: Nigeria<br />
Summary/ Introduction<br />
This project is on assessing the vulnerability extent of the environment of Efon Alaye (Location<br />
area). The region is described to be surrounded by uphills, with its major settlements on the<br />
valley. People in the region still having their houses built on the hill, likewise some of their<br />
farming activities are done on the slope of the hills. The hills are steep as they slope down the<br />
valley, which eventually makes the inhabitants of this region be at risk to erosion, run-off during<br />
heavy down pour of rain. Integration of remote sensing technology and geographical information<br />
system are veritable tools to map out high risk areas to monitor these eventualities such are<br />
erosion, run-off. Therefore integration of both techniques and performing other spatial analysis,<br />
we will produce the desired result intended, which will help for sustainable land management in<br />
the region.<br />
Overall <strong>Project</strong> Goals<br />
Our specific goal on this project is to produce a risk assessment map, identifying high risk areas<br />
as likewise low risk which will be subdivided into 3 levels:<br />
• High risk area<br />
• Medium risk area<br />
• Low risk area<br />
Our planned calendar was hijacked by several activities, which gradually is been taken care of,<br />
nevertheless we still working with the project calendar. Little adjustments that has been made on<br />
the project calendar which we feel is good for the project to be completed before the initial time<br />
the project calendar specified (November, 2011), but we are working hard to ensure we send in<br />
our final report before May, 2011.<br />
Satellite Image Analysis and Findings<br />
In producing a risk assessment map, various image analyses have to be carried to generate the<br />
necessary indicators. The Indicators that will be generated from the image analysis will try<br />
showing the conditions of the region with respect to vegetation loss, landing use land cover<br />
change, topography/slope. The indicators to be considered are the digital elevation model of the<br />
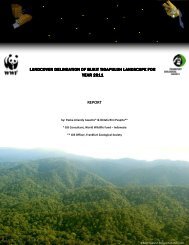
region, Normalized difference vegetation index (NDVI) and slope map. Figure 1, shows the two<br />
period images used for the output analysis presented in Figure 2.<br />
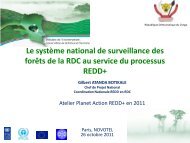
Performing Image difference operation using ENVI EX for both periods 1986 and 2002 satellite<br />
image of landsat using the NDVI as the feature index method, Figure 2, shows areas of<br />
vegetation decrease identified by the spectral red color in the region of study. It explains there is<br />
more vegetation decrease within settlement region circled in yellow. Table 1, list the class names
for the operation and shows the results obtained. Big decrease is about 87% of loss of vegetation<br />
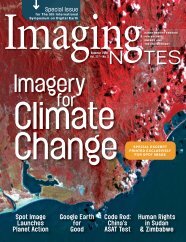
over the region of stud. Figure 3, shows the flow accumulation map and drainage network<br />
overlay on the 3D view of the region of study. The flow accumulation map defines the<br />
hydrological flow of the region of study, spectra color with high values are defined to be flow<br />
outlets, these outlets are areas in the region of study which have been eroded by runoff, soil<br />
erosion. The inhabitants carry most of their farming activities on the steep slope, weakening the<br />
top soil allowing for easy runoff during heavy down pour of rain.<br />
A<br />
B<br />
UpHill<br />
Settlement<br />
Down the<br />
valley<br />
UpHill<br />
Figure1: (a) Region Image in 1986 Landsat, (b) Region Image in 2002 Landsat<br />
A<br />
B
Figure 2: (a) Vegetation decrease, (b). Overlay of vegetation decrease areas over Region<br />
Satellite Image.<br />
A<br />
B<br />
Figure 3: (a) Flow accumulation Map, (b) Drainage network overlay on 3D view of region<br />
of interest.<br />
Table: 1<br />
CLASS_NAME AREA (Metre) PERCENT<br />
Unclassified 0.00 0.000000<br />
Other 13741.00 12.795657<br />
Big Decrease 93647.00 87.204343<br />
Activities Undertaken<br />
To mention, we’ve had interactions with the personal assistant to the traditional ruler and some<br />
of the inhabitants of the community. Find photos below.<br />
Challenges<br />
Yes the project had challenges; such has Finance, software, human resource, mobility. Starting<br />
with the software, the first software pack sent to us (ENVI) was an upgrade (service pack) not<br />
the real installation software, which was later mention to ITT and the installation pack was sent<br />
and we really appreciated their effort. Also we had challenges with the software licenses which<br />
after some months were later resolved. We actually request for two softwares but we had just one<br />
ENVI delivered first and after some months precisely this October we just heard from ESRI. We<br />
have sent our address and we hope to hear from them soon.<br />
Secondly on Human resource, we had issues with this; field workers availability. So two of us<br />
from the team had to do some field work on the region, nevertheless there are still much we can<br />
accomplish on the field, that leads to the third aspect finance and mobility; as a team raising<br />
finance based on each step of the project hasn’t been easy, part of it which would have help to
support giving stipends to field workers as you supervise, and for mobility to different areas of<br />
the region. Nevertheless we have been trying on this aspect.<br />
What next?<br />
We intend to complete all image analysis as soon as possible not later than January 2011, and<br />
update our information on the website. Also to still pay a visit to the region for sensitization on<br />
the results we shall obtain at the end of the study. So the other indicators are to be analyzed and<br />
the risk map to be produced. Also the second step of the analysis of SPOT images donated for<br />
the region. Results will be sent as soon as possible.<br />
Conclusion<br />
The project is welcomed in the region from our meeting with the personal assistant to the<br />
traditional ruler. Nevertheless certain measures have been taken already by the Government to<br />
help the community in the region against soil erosion. Gutters are being built to help drainage<br />
round the community down the valley. Remote sensing and GIS are potent techniques to map out<br />
the region based on the subject tile of this project. We therefore hope to conclude this project,<br />
sending in all reports as applicable on or before May 2011.<br />
We wish to adjust the title of this project as stated above, but all other write-up and objectives of<br />
the project still apply only for areas adjustments is deem necessary. The title we are proposing to<br />
called this project is the second title in background color green<br />
Thanks<br />
Adia Samson O.<br />
Principal investigator<br />
adiaoros@yahoo.com
Appendix<br />
Plate1: Personal Assistant to traditional ruler (left), Principal investigator and P.A (right)<br />
Plate 2: Team member and P.A (left) Principal Investigator and a resident (right)<br />
Plate 3: Residents of the community (left), Principal investigator (right)<br />
Plate 4: Team member (left), Principal Investigator (right)
Plate 5: Built gutter