Landcover Delineation of Bukit Tigapuluh Landscape ... - Planet Action
Landcover Delineation of Bukit Tigapuluh Landscape ... - Planet Action
Landcover Delineation of Bukit Tigapuluh Landscape ... - Planet Action

You also want an ePaper? Increase the reach of your titles
YUMPU automatically turns print PDFs into web optimized ePapers that Google loves.
LANDCOVER DELINEATION OF BUKIT TIGAPULUH LANDSCAPE FOR<br />
YEAR 2011<br />
REPORT<br />
by: Paska Ariandy Iswanto* & Oktafa Rini Puspita**<br />
* GIS Consultant, World Wildlife Fund – Indonesia<br />
** GIS Officer, Frankfurt Zoological Society<br />
0<br />
©<strong>Bukit</strong> TIgapuluh National Park (flickr.com)
I. Introduction<br />
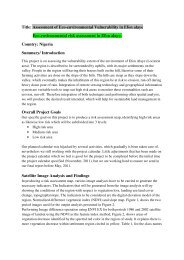
Sumatra, in Indonesia, is the sixth largest island in the world which is home to a rich variety <strong>of</strong> flora and<br />
fauna. Amongst 11 national parks <strong>of</strong> Sumatra, <strong>Bukit</strong> <strong>Tigapuluh</strong> National Park is unique because it<br />
comprises hilly lowland forest landscape that is separated from <strong>Bukit</strong> Barisan Mountain range, creating<br />
an ecosystem not found in other national parks. The 144,223 hectares national park is actually only<br />
small representation <strong>of</strong> the much larger continuous forest landscape, such as 651,232 hectares (KKI<br />
WARSI, Frankfurt Zoological Society, Eyes on the Forest, WWF-Indonesia, 2010) used as baseline area<br />
here (Figure1).<br />
Figure1. Location <strong>of</strong> baseline area relative to Sumatra Island and zoom-in map (baseline area with altitude information)<br />
Since the New Order regime, Indonesian government had granted several concessions to selectivelylogged<br />
the forest landscape, even inside the current national park boundary. This situation worsened<br />
when the selective logging concessions ceased their operation in early 21th century where the high<br />
conservation value forests that are still left were granted to be cleared by pulp & paper, oil palm, and<br />
mining companies. The landscape baseline area lost 50% <strong>of</strong> its original natural forest cover between<br />
1985 & 2010 (KKI WARSI, Frankfurt Zoological Society, Eyes on the Forest, WWF-Indonesia, 2010).<br />
1
In 2010, slightly more than 50% <strong>of</strong> natural forests were located outside the protection areas. Most <strong>of</strong><br />
them were either owned or applied for non-conservation purposes (KKI WARSI, Frankfurt Zoological<br />
Society, Eyes on the Forest, WWF-Indonesia, 2010). If this is allowed to continue, some endangered<br />
endemic flora and species will be doomed to extinction in the near future. Therefore, as environmental<br />
NGOs concern with the forest degradation and deforestation in <strong>Bukit</strong> <strong>Tigapuluh</strong> <strong>Landscape</strong>, World<br />
Wildlife Fund – Indonesia and Frankfurt Zoological Society are planning to apply for a multi-blocks<br />
ecosystem restoration concessions in area where there are no legal owners. This effort at least will halt<br />
and stop illegal and legal forest destruction in some <strong>of</strong> <strong>Bukit</strong> <strong>Tigapuluh</strong>’s crucial areas.<br />
One <strong>of</strong> the requirements to apply for such concession is a landcover map. Because <strong>of</strong> the rapid changes<br />
<strong>of</strong> landcover in the landscape, a new and accurate existing landcover map is needed. This is very<br />
important for making decisions on future spatial planning and also making us aware <strong>of</strong> the main agents<br />
and future threats <strong>of</strong> deforestation and forest degradation in the area <strong>of</strong> interest. The following<br />
discussion will discuss about the methodology and analysis <strong>of</strong> <strong>Bukit</strong> <strong>Tigapuluh</strong> <strong>Landscape</strong> landcover<br />
delineation for year 2011.<br />
2
II.<br />
Methodology<br />
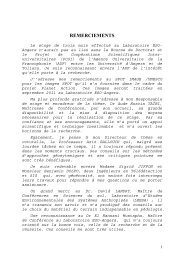
Satellite images have been heavily utilized for forest monitoring around the world. The 2011<br />
landcover delineation discussed here took advantage <strong>of</strong> the freely available Landsat data from<br />
United States Geological Survey (USGS) and SPOT data from FZS 2010-2011 <strong>Planet</strong> <strong>Action</strong> project.<br />
First <strong>of</strong> all, all available January – July 2011 Landsat 7+ ETM images were scanned for the image<br />
quality (clouds), and eight images from three different paths/rows were selected and downloaded.<br />
As for SPOT images, because <strong>of</strong> the limitation from the grant’s quota, only 2 images could be<br />
obtained. Figure 2 illustrates the contribution <strong>of</strong> each image to the landcover delineation.<br />
Figure2. Satellite Coverage for <strong>Landcover</strong> <strong>Delineation</strong><br />
Groundtruthing data were taken from the survey report <strong>of</strong> Frankfurt Zoological Society patrol teams<br />
(Wildlife Protection Unit) that spanned from January to August 2011 (8189 points). The data mainly<br />
covers southern and western part <strong>of</strong> <strong>Bukit</strong> <strong>Tigapuluh</strong> <strong>Landscape</strong> (Figure3). Beside that, several<br />
ancillary data were also used for aiding landcover interpretation especially in the area where<br />
groundtruthing data were unavailable. These data are summarized in Table1.<br />
3
Table1. Ancillary Data used for assisting delineation process<br />
No Data Type Source(s) From Year(s)<br />
1 ALOS PALSAR <strong>Landcover</strong> Groundtruthing Survey Sata WWF Riau 2010<br />
JAXA<br />
2 <strong>Bukit</strong> <strong>Tigapuluh</strong> <strong>Landscape</strong> <strong>Landcover</strong> FZS 2010<br />
3 Riau <strong>Landcover</strong> WWF -Indonesia 2007<br />
4 Jambi <strong>Landcover</strong> WWF -Indonesia 2008<br />
5 Settlement Distribution <strong>Bukit</strong> <strong>Tigapuluh</strong> 2008-2010<br />
National Park Office<br />
FZS<br />
KKI WARSI<br />
6 Former and Existing HTI and HPH Concessions Ministry <strong>of</strong> Forestry 2010-2011<br />
WWF- Indonesia<br />
FZS<br />
KKI-WARSI<br />
7 Existing Mining Concessions Ministry <strong>of</strong> Energy 2010-2011<br />
and Mineral<br />
Resources<br />
8 Existing Plantation Concessions WWF-Indonesia 2011<br />
9 National Park and Protected Forest Boundary <strong>Bukit</strong> <strong>Tigapuluh</strong> -<br />
National Park Office<br />
10 Road FZS<br />
2008-2011<br />
KKI-WARSI<br />
WWF-Indonesia<br />
11 River Bakosurtanal 1985<br />
4
Figure3. <strong>Landcover</strong> grountruthing data distribution<br />
Because multitemporal satellite images were used, normalization had to be undertaken to reduce<br />
the effect <strong>of</strong> atmospheric and radiometric disturbances. Corrections involved two steps, obtaining<br />
radiance value from raw digital number and surface reflectance value from radiance value. Radiance<br />
describes the amount <strong>of</strong> energy being emitted or reflected per unit solar angle and per unit time,<br />
usually expressed in n units <strong>of</strong> watts per square meter per steradian per micrometer<br />
(W/(m2*sr*µm)) ( (Tempfli, Kerle, Huurneman, & Jansen, 2009; ITT). The spectral radiance is<br />
calculated automatically in ENVI using the following formulas:<br />
1. For Landsat images: L <br />
<br />
where QCAL is the calibrated and<br />
quantized scaled radiance in units <strong>of</strong> digital numbers, LMIN is the spectral radiance at QCAL = 0,<br />
LMAX is the spectral radiance at QCAL = QCALMAX, and QCALMAX is the range <strong>of</strong> the rescaled<br />
radiance in digital numbers. LMIN and LMAX are derived from tables provided in the Landsat<br />
Technical Notes (August 1986) with the information provided through the TM Calibration<br />
Parameters dialog in ENVI (ITT).<br />
2. For SPOT images: L = (X/A) + B where L = the equivalent irradiance at the input <strong>of</strong> the<br />
instrument, , X = the count (0 to 255),, A = absolute calibration gain, for the considered spectral<br />
band, and B = absolute calibration <strong>of</strong>fset, for the considered spectral band.<br />
Reflectance is the portion <strong>of</strong> incident energy on a surface that is reflected. ENVI's Fast Line-<strong>of</strong>-sight<br />
Atmospheric Analysis <strong>of</strong> Spectral Hypercubes (FLAASH) module were used to derive surface<br />
reflectance with input data such as: scaled radiance images to nanometer, scene center location,<br />
5
sensor type, sensor altitude (km), ground elevation (km), pixel size (m), flight data, flight time,<br />
atmospheric model (tropical), aerosol model (rural), initial visibility (km) from BMKG Muaro Jambi,<br />
etc. (Figure4)<br />
Figure4. FLAASH input parameters for 23 July 2011 image.<br />
Not all satellite images underwent the correction, for this case, only Landsat 7 ETM+ path/row<br />
126/61 and SPOT images were taken part. This is because other satellite images were in JPEG format<br />
and it was assumed that the coverage areas are too insignificant, thus can be ignored. Visual<br />
observations revealed that the correction results are fairly good to make the images directly<br />
comparable, especially inside the gap areas(Figure5)<br />
Figure5. Left: Raw Images before correction, Right: Images after correction.<br />
6
After correction processes were done, the images were ready to be delineated. All the images were<br />
visualized in RGB (Red: Shortwave Infrared, Green: Infrared, Blue: Red) with RGB adjustments when<br />
needed (usually Red: Infrared, Green: Red, Blue: Green) and the delineation scale was fixed at 1:50,000.<br />
All digitization and topology editing processes were done in ArcGIS 9.3 s<strong>of</strong>tware. <strong>Landcover</strong> class<br />
definition followed Anderson, Hardy, Roach, & Witmer (1976) with some modifications. Seven<br />
interpretation elements were considered in categorizing landcover classes: tone/hue, texture, pattern,<br />
size, shape, height/elevation, and location/association (Tempfli, Kerle, Huurneman, & Jansen, 2009).<br />
Diagram1 summarizes the landcover delineation processes.<br />
Landsat and SPOT Images<br />
Radiometric and Atmospheric<br />
Corrections<br />
View in RGB<br />
<strong>Delineation</strong> Process<br />
Ancillary Data<br />
Groundtruthing Data<br />
<strong>Landcover</strong> 2011<br />
Undirect Relationship<br />
Direct Relationship<br />
Diagram1. <strong>Landcover</strong> <strong>Delineation</strong> Process Tree<br />
7
III.<br />
Analysis<br />
After assigning each polygon with their respective landcover class, 17 landcover classes could be<br />
identified in the baseline area. Amongst them, there are three oil palm classes, two acacia classes, and<br />
four mosaic classes. A polygon is classified as mosaic where individual landcover couldn’t be separated<br />
at mapping scale and neither predominate each other. The landcover classes will be described in detail<br />
below.<br />
Forest<br />
Forests are stocked with trees capable <strong>of</strong> producing timber or other wood products, and exert an<br />
influence on the climate or water regime (Anderson, Hardy, Roach, & Witmer, 1976). Forest appears in<br />
the darkest shade <strong>of</strong> green compare to other vegetation features (Figure6). It can be found inside the<br />
conservation areas (national park and protection forest and also in the buffer zones.<br />
Figure6. Left: Forest in clear atmosphere inside <strong>Bukit</strong> Sosah Protection Forest, Right: Forest in hazy atmosphere inside and in the buffer<br />
zone <strong>of</strong> the National Park<br />
Acacia Plantation /Young Acacia Plantation<br />
Acacia can be easily identified with its apple green colour and association with Hutan Tanaman Industri<br />
(HTI) aka pulp and paper concessions. Because eucalyptus is usually planted side by side with acacia in<br />
insignificant amounts, it was included in the acacia class. While the spectral characteristics <strong>of</strong> young<br />
acacia may appear very similar to other vegetation features, especially shrub/forest regrowth, it is<br />
differentiated by its more compact size, uniform textures, and most likely either borders acacia classes<br />
or located inside newly licensed concessions. Both acacia and young acacia spectral characteristic can be<br />
seen in Figure7.<br />
8
Figure7. Left: Acacia in <strong>Bukit</strong> Batabuh Sei Indah Concession, Middle: Acacia in WKS District VIII concession, Right: Young Acacia in Tebo<br />
Multi Agro Concession. HTI Concession boundaries are shown in red color.<br />
Cleared<br />
Cleared or barren land is an area <strong>of</strong> thin soil, sand, or rocks (Anderson, Hardy, Roach, & Witmer, 1976).<br />
Because no major settlement existed inside the baseline area, it was included in the cleared class.<br />
Cleared can appear in various shades <strong>of</strong> red color, from pink to purple, (Figure8) depend on how barren<br />
the area is, soil type, etc.<br />
Figure7. Left: Pink shade in the south <strong>of</strong> WKS District VIII concession, Middle: Pinkish Red in the east <strong>of</strong> National Park, Right: Pinkish purple<br />
inside <strong>Bukit</strong> Sosah-<strong>Bukit</strong> Limau Protection Forest.<br />
Dryland Agriculture<br />
Agricultural Land may be defined broadly as land used primarily for production <strong>of</strong> food and fiber<br />
(Anderson, Hardy, Roach, & Witmer, 1976). Only one dryland agriculture class was identified in the<br />
baseline area. There is no unique spectral characteristic belongs to this class (indistinguishable from<br />
shrubs/forest regrowth). The class was primarily assigned based on the extensive groundtruthing data<br />
and its location near a Talang Mamak settlement (Semarantihan) (see Figure8)<br />
9
Figure8. Dryland Agriculture near Semarantihan sub-village<br />
Mining<br />
Despite many coal mining licenses had been issued in the area, no evidence <strong>of</strong> open pit mining was<br />
found. Thus, the mining class here refers to sand extraction along big river that is common in the<br />
province. Sand mining appears in whitish pink and forms a long strip in both side <strong>of</strong> a river (Figure9).<br />
Figure9. Sand mining in both sides <strong>of</strong> Langsisip River<br />
Oil Palm Plantation/Young Oil Palm Plantation/Smallscale Oil Palm<br />
To delineate oil palm plantation and young oil palm plantation, oil palm concessions data were used as<br />
the guideline although most polygons didn’t precisely follow the plantation boundary. Oil Palm<br />
plantation class can be differentiated by its uniform undulating texture. Its green color is also a little<br />
brighter than it is in acacia class (Figure10Left). Young oil palm plantation appears in yellowish green and<br />
is identified by its location near oil palm plantation and presence <strong>of</strong> grid road network (Figure10Middle).<br />
Smallscale oil palm was delineated mostly from the groundtruthing data because it is hardly<br />
distinguishable from mosaic oil palm+rubber class. (Figure10Right).<br />
10
Figure10. Left: Oil Palm Plantation <strong>of</strong> Sumber Andalas Kencana, Middle: Obvious unknown largescale young oil palm plantation in the<br />
north <strong>of</strong> Ex Riau Andalan Pulp and Paper concession, Rigth: Smallscale oil palm plantation in the northern part <strong>of</strong> Ex Hatma Hutani HPH<br />
concessions<br />
Shrub/Forest Re-growth<br />
Shrub and forest re-growth were differentiated in Setiabudi (2006), although both appears in small<br />
coverage and sometimes mixed. Because the groundtruthing data took shrub and forest regwroth in one<br />
category and haze obstruct the view to clearly differentiate both features, they were combined as one<br />
class here. Shrubs/forest re-growth appears in the lightest green <strong>of</strong> the vegetation classes (Figure11). It<br />
is mostly associated with previously cleared areas (identified from historical landcover maps).<br />
Figure10. Left: Shrub between Artelindo Wiratama concession and <strong>Bukit</strong> Sosah Protection Forest, Right: Forest Regrowth in Ex Dalek<br />
Hutani Esa concession<br />
Smallscale Rubber<br />
No big rubber plantation existed in the landscape so that all rubber plantations were classified as<br />
smallscale rubber. Smallscale rubber has dense texture because <strong>of</strong> its canopy characteristics and<br />
appears in brownish green (Figure11). Its location is closer to settlement than other homogenous<br />
plantations.<br />
11
Figure11. Smallscale Rubber, southeast <strong>of</strong> Tebo Multi Agro concessions<br />
Water Body<br />
The delineation <strong>of</strong> water areas depends on the scale <strong>of</strong> data presentation and the scale and resolution<br />
characteristics <strong>of</strong> the remote sensor data used for interpretation <strong>of</strong> land use and land cover (Anderson,<br />
Hardy, Roach, & Witmer, 1976). River feature is easy to be identifed and it appears in dark blue color<br />
(Figure 12).<br />
Figure11. Water Body (Sungai Pemotongan)<br />
Mosaic Classes<br />
There are five mosaic classes identified: Mosaic Acacia+Oil Palm, Mosaic Acacia+Shrub, Mosaic Oil<br />
Palm+Rubber, Mosaic Rubber+Dryland Agriculture, and Mosaic Shrub+Rubber. Mosaic classes have<br />
both features’ spectral characteristics; either appears side by side in small patches or fuses into<br />
intermediate colors (Figure13). Ancillary data plays a great role in determining mosaic classes especially<br />
in the extremely confusing areas.<br />
12
Figure13. In clockwise order, Mosaic Acacia+Oil Palm in Arian Multi Kawa concession, Mosaic Acacia+Shrub west od Artelindo Wiratama<br />
concession, Mosaic Oil Palm+Rubber inside <strong>Bukit</strong> Limau Production Forest, Mosaic Shrub+ Rubber in Tanah Datar-Tua Datai Talang Mamak<br />
Settlements.<br />
Above, the spectral characteristics and the terminology <strong>of</strong> each landcover class have been<br />
described. Here (Figure14) are shown the landcover classes’ photographs taken from the field that<br />
represents the landcover perception <strong>of</strong> the survey teams and the analysts.<br />
1 2<br />
5<br />
3<br />
4<br />
13
6<br />
7 8<br />
9 10<br />
11<br />
12<br />
Figure14. 1. Forest (WPU-FZS, 2011), 2. Acacia (GIS-FZS, 2009), 3. Cleared 1 (WPU-FZS,2011), 4. Cleared 2 (WPU-FZS,2011), 5. Dryland<br />
Agriculture (WPU-FZS,2011), 6. Oil Palm Plantation (GIS-FZS, 2010), 7. Young Oil Palm Plantation (WPU-FZS, 2011). 8. Smallscale Oil Palm<br />
Plantation (WPU-FZS, 2011), 9. Shrub (WPU-FZS, 2011), 10. Forest Regrowth (GIS-FZS, 2010), 11. Smallscale Rubber Plantation (WPU-FZS,<br />
2011), 12. Water Body (WPU-FZS,2011).<br />
14
Spatial Pattern and Area Sizes<br />
Figure15. Map showing delineation result<br />
Figure15 shows delineation result for the whole baseline area. Forest is dominant in the center,<br />
while mosaic oil palm+rubber is mostly visible in the periphery region. Forest forms three big<br />
patches in which the westernmost patch is already severely deforested characterized by many very<br />
small polygons. Mosaic shrub+rubber class can predominantly be found in the forest buffers, with<br />
the exception in the southern and southwestern part <strong>of</strong> the baseline area. Large scale homogenous<br />
plantations mostly follow their respective concessions boundary while smallscale homogenous<br />
plantation such as oil palm and rubber marks the landscape’s northern, eastern, and southern<br />
boundary. Large size <strong>of</strong> cleared areas is easily visible in the middle <strong>of</strong> forest patches near and inside<br />
the protection forest. Mining appears in southwestern part forming a strip feature along the river.<br />
Dryland Agriculture and Mosaic Rubber+Dryland Agriculture show up in only one polygon (both near<br />
Talang Mamak settlements) and both mosaic acacia classes appear in the northwestern part.<br />
Although there are a lot <strong>of</strong> small and big rivers flowing inside the landscape, only one water body<br />
polygon was delineated.<br />
In Block I <strong>of</strong> applied ecosystem restoration concession, forested area is absence in the middle part<br />
which is covered by mosaic shrub+rubber, smallscale rubber, cleared areas, and dryland agriculture.<br />
In Block II, deforested area in the western and southern parts is mainly covered by mosaic oil<br />
15
palm+rubber. There are also noticeable shrubs polygons intrude into the forested areas in the<br />
southeastern part. In Block III, smallscale oil palm can be seen in the northeastern part while mosaic<br />
shrub+rubber is visible in the southeastern areas. Riau Block I is more complicated to explain. The<br />
most dominant landcover class beside forest is mosaic oil palm+rubber and the block’s boundary<br />
also coincides with oil palm and young oil palm plantations.<br />
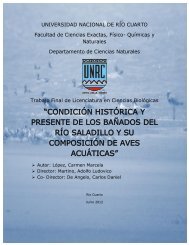
Graph1<br />
Graph1 shows the proportion <strong>of</strong> each landcover class according to its size. It is revealed that forest class<br />
is still the largest landcover class, accounts for 46% <strong>of</strong> the baseline area, followed by mosaic oil<br />
palm+rubber (28%). Forest cover losses since 2010 (KKI WARSI, Frankfurt Zoological Society, Eyes on the<br />
Forest, WWF-Indonesia, 2010) reaches almost 20,000 ha (6,2%) in just a year. This rate is a bit lower<br />
than 2009-2010 forest cover loss (6,7%) but it is most likely because the satellite images used in this<br />
landcover delineation is from the first half <strong>of</strong> year 2011 and the rate can be so much worse in the end <strong>of</strong><br />
year. Cleared, mosaic shrub+rubber, and acacia landcover classes presence in 8%, 6%, and 4% <strong>of</strong> the<br />
baseline area, respectively. Each <strong>of</strong> other landcover classes only constitutes less than 2% with dryland<br />
agriculture as the smallest size.<br />
16
IV.<br />
Conclusion and Reccomendation<br />
<strong>Bukit</strong> <strong>Tigapuluh</strong> <strong>Landscape</strong> landcover has been delineated for the year 2011 utilizing Landsat and SPOT<br />
satellite images and extensive grountruthing survey. It is more detail than the previous landcover maps<br />
ever produced for the region but still lacks accuracy checking for the un-surveyed areas, especially in the<br />
northern side and inside the national park where survey is highly inaccessible. It was found that forest<br />
and mosaic oil palm+rubber are the most noticeable landcover classes. It was also revealed that acacia,<br />
oil palm, and rubber are the most popular planted crops in which acacia and oil palm are highly<br />
preferred by corporate (big scale) plantations.<br />
Though originally this landcover data is aimed to apply for a restoration ecosystem concession (see<br />
Figure14 for concession extent), it can also be used for further studies especially those that want a new<br />
and moderately detail data on existing condition <strong>of</strong> <strong>Bukit</strong> <strong>Tigapuluh</strong> <strong>Landscape</strong>, such as the planned<br />
carbon calculation. Because <strong>of</strong> high difficulties in finding cloud-free images in the region, it was<br />
recommended to employ Synthetic Aperture Radar (SAR) satellite images in the future, so that a<br />
consistent and automatic landcover classification can be implemented. The relationship between SAR<br />
images and landcover types should be extensively studied.<br />
17
Bibliography<br />
Anderson, J. R., Hardy, E. R., Roach, J. T., & Witmer, R. E. (1976). A Landuse and <strong>Landcover</strong> Classsification<br />
System for Use with Remote Sensor Data: Geological Survey Pr<strong>of</strong>essional Paper. Washington: United<br />
States Government Printing Office.<br />
ITT. (n.d.). Envi 4.5. Help.<br />
KKI WARSI, Frankfurt Zoological Society, Eyes on the Forest, WWF-Indonesia. (2010). Last Chance to Save<br />
<strong>Bukit</strong> <strong>Tigapuluh</strong>. KI WARSI, Frankfurt Zoological Society, Eyes on the Forest,.<br />
Setiabudi. (2006). Final Report: Analysis <strong>of</strong> 1990-1995-2000 and 2005 Landuse Dynamics in the Kampar<br />
Penisula - Tesso Nilo - <strong>Bukit</strong> <strong>Tigapuluh</strong> Conservation <strong>Landscape</strong>, Riau, Sumatra, Indonesia. WWF<br />
Indonesia Tesso Nilo Conservation Programme and Conservation Management Ltd.<br />
Tempfli, K., Kerle, N., Huurneman, G. C., & Jansen, L. L. (2009). Principles <strong>of</strong> Remote sensing; An<br />
Introdutory Textbook. Enschede: The International Institute for Geo-Information Science and Earth<br />
Observation.<br />
18