- Page 1 and 2: Pirelli & C. S.p.A. — Milan Annua
- Page 3 and 4: EXTRAORDINARY SESSION CONSOLIDATED
- Page 5 and 6: EXTRAORDINARY SESSION CONSOLIDATED
- Page 7 and 8: EXTRAORDINARY SESSION CONSOLIDATED
- Page 9 and 10: EXTRAORDINARY SESSION CONSOLIDATED
- Page 11 and 12: EXTRAORDINARY SESSION CONSOLIDATED
- Page 14 and 15: Directors' report
- Page 16 and 17: Directors' report on operations Sha
- Page 18 and 19: Significant events in 2008 With reg
- Page 20 and 21: Turin and the Pirelli Group sealed
- Page 22 and 23: Yanzhou, China - Mixing department
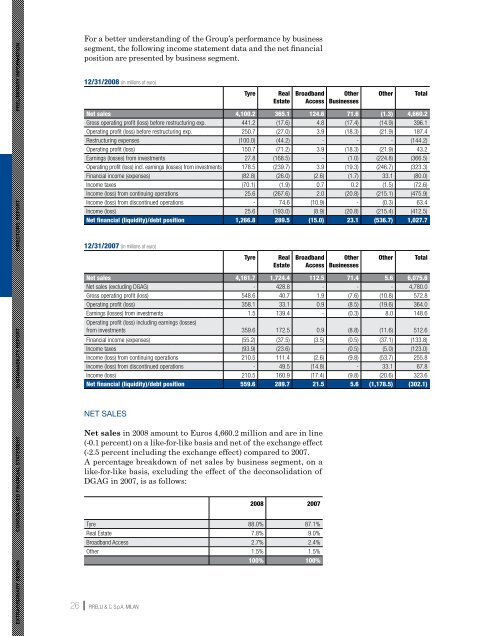
- Page 24 and 25: The Group ALTERNATIVE PERFORMANCE M
- Page 28 and 29: A percentage breakdown of the chang
- Page 30 and 31: The change can be summarized as fol
- Page 32 and 33: CAPITAL EXPENDITURES Capital expend
- Page 34 and 35: Thirty years after, the Pirelli Cin
- Page 36 and 37: On the other hand, the Sottozero Se
- Page 38 and 39: Information systems The Information
- Page 40 and 41: Pirelli Real Estate The information
- Page 42 and 43: Risks and uncertainties The current
- Page 44 and 45: This is accomplished by negotiating
- Page 46 and 47: sustainability. A gradual introduct
- Page 48 and 49: ued focus on higher-end product seg
- Page 50 and 51: Instead, Pirelli Tyre has kept its
- Page 52 and 53: ticipating in the championship. In
- Page 54 and 55: and Turkey and the start-up of proj
- Page 56 and 57: Pirelli & C. Real Estate The consol
- Page 58 and 59: Assets under management have a mark
- Page 60 and 61: Balance sheet and financial review
- Page 62 and 63: NON-PERFORMING LOANS Collections on
- Page 64 and 65: NET RESULT The net result is income
- Page 66 and 67: nology) lines; 3) Innovation with t
- Page 68 and 69: start-up of the factory in Romania
- Page 70 and 71: Pirelli & C. S.p.A. Summary of sele
- Page 72 and 73: The reason for the reclassification
- Page 74 and 75: —— details of income (expenses)
- Page 76 and 77:
Equity investments held by Director
- Page 78 and 79:
Compliance with Article 36 of Conso
- Page 80 and 81:
Appointment of the board of statuto
- Page 82 and 83:
Article 16 of the bylaws The Board
- Page 84 and 85:
ANNUAL FINANCIAL REPORT 2008 83
- Page 86 and 87:
Stock Exchange Regulations: indicat
- Page 88 and 89:
Savings shares do not have voting r
- Page 90 and 91:
e) Employee shareholdings: mechanis
- Page 92 and 93:
ers of convertible bonds, for a max
- Page 94 and 95:
The composition of the Board of Dir
- Page 96 and 97:
When the Board of Directors is due
- Page 98 and 99:
Remuneration of the directors veste
- Page 100 and 101:
more than 10 million euros (in the
- Page 102 and 103:
d) if they receive, or have receive
- Page 104 and 105:
8. APPOINTMENTS COMMITTEE The Board
- Page 106 and 107:
11. The Committee for Internal Cont
- Page 108 and 109:
The internal control officer also r
- Page 110 and 111:
12.3. Organisational model ex Legis
- Page 112 and 113:
and the set of businesses included
- Page 114 and 115:
after the expiry of the date for th
- Page 116 and 117:
members of the Board of Statutory A
- Page 118 and 119:
ensure orderly discussion and votin
- Page 120 and 121:
and cadres employed by the Company,
- Page 122 and 123:
priate measures to ensure the order
- Page 124 and 125:
with the title of Managing Director
- Page 126 and 127:
ing to the regulations issued by Co
- Page 128 and 129:
ANNUAL FINANCIAL REPORT 2008 127
- Page 130 and 131:
Telecom Italia S.p.A. Telecom Itali
- Page 132 and 133:
6. Bodies governing the agreement,
- Page 134 and 135:
ANNEX E - General Criteria for the
- Page 136 and 137:
— the general results of operatio
- Page 138 and 139:
9. Direction and coordination activ
- Page 140 and 141:
ANNEX G - Rules of conduct for effe
- Page 142 and 143:
mation “in the making,” so as t
- Page 144 and 145:
6.3 - Inside information must also
- Page 146 and 147:
8.6 — The definition of “roles
- Page 148 and 149:
— with the markets closed or in t
- Page 150 and 151:
ANNEX A Notices to be sent to perso
- Page 152 and 153:
ANNEX B Pirelli & C. S.p.A. Group R
- Page 154 and 155:
—— coordinates the Registering
- Page 156 and 157:
We further undertake to inform prel
- Page 158 and 159:
ANNEX I - Insider dealing - Black-o
- Page 160 and 161:
Article 6 —— In the conduct of
- Page 162:
ANNUAL FINANCIAL REPORT 2008 161
- Page 165 and 166:
EXTRAORDINARY SESSION CONSOLIDATED
- Page 168 and 169:
Pirelli and sustainable development
- Page 170 and 171:
In October 2004, in a letter addres
- Page 172 and 173:
Pirelli has adopted the traditional
- Page 174 and 175:
Several tools are simultaneously us
- Page 176 and 177:
In 2008 Pirelli commissioned indepe
- Page 178 and 179:
Scs Consulting Accountability Ratin
- Page 180 and 181:
Collaboration agreements with unive
- Page 182 and 183:
Pirelli one of the 100 most respect
- Page 184:
Customer satisfaction is the most i
- Page 187 and 188:
EXTRAORDINARY SESSION CONSOLIDATED
- Page 189 and 190:
EXTRAORDINARY SESSION CONSOLIDATED
- Page 191 and 192:
EXTRAORDINARY SESSION CONSOLIDATED
- Page 193 and 194:
EXTRAORDINARY SESSION CONSOLIDATED
- Page 195 and 196:
EXTRAORDINARY SESSION CONSOLIDATED
- Page 197 and 198:
EXTRAORDINARY SESSION CONSOLIDATED
- Page 199 and 200:
EXTRAORDINARY SESSION CONSOLIDATED
- Page 201 and 202:
EXTRAORDINARY SESSION CONSOLIDATED
- Page 203 and 204:
EXTRAORDINARY SESSION CONSOLIDATED
- Page 205 and 206:
EXTRAORDINARY SESSION CONSOLIDATED
- Page 207 and 208:
EXTRAORDINARY SESSION CONSOLIDATED
- Page 209 and 210:
EXTRAORDINARY SESSION CONSOLIDATED
- Page 211 and 212:
from an unprecedented crisis the po
- Page 213 and 214:
EXTRAORDINARY SESSION CONSOLIDATED
- Page 215 and 216:
EXTRAORDINARY SESSION CONSOLIDATED
- Page 217 and 218:
EXTRAORDINARY SESSION CONSOLIDATED
- Page 219 and 220:
EXTRAORDINARY SESSION CONSOLIDATED
- Page 221 and 222:
EXTRAORDINARY SESSION CONSOLIDATED
- Page 223 and 224:
EXTRAORDINARY SESSION CONSOLIDATED
- Page 225 and 226:
EXTRAORDINARY SESSION CONSOLIDATED
- Page 227 and 228:
EXTRAORDINARY SESSION CONSOLIDATED
- Page 229 and 230:
EXTRAORDINARY SESSION CONSOLIDATED
- Page 231 and 232:
EXTRAORDINARY SESSION CONSOLIDATED
- Page 233 and 234:
EXTRAORDINARY SESSION CONSOLIDATED
- Page 235 and 236:
EXTRAORDINARY SESSION CONSOLIDATED
- Page 237 and 238:
EXTRAORDINARY SESSION CONSOLIDATED
- Page 239 and 240:
EXTRAORDINARY SESSION CONSOLIDATED
- Page 241 and 242:
EXTRAORDINARY SESSION CONSOLIDATED
- Page 243 and 244:
EXTRAORDINARY SESSION CONSOLIDATED
- Page 245 and 246:
EXTRAORDINARY SESSION CONSOLIDATED
- Page 247 and 248:
EXTRAORDINARY SESSION CONSOLIDATED
- Page 249 and 250:
EXTRAORDINARY SESSION CONSOLIDATED
- Page 252 and 253:
Social dimension Internal Community
- Page 254 and 255:
WORKFORCE GEOGRAPHICAL BREAKDOWN 20
- Page 256 and 257:
The trend in the Group’s workforc
- Page 258 and 259:
International mobility, which is pe
- Page 260 and 261:
Pirelli’s participation in the Wo
- Page 262 and 263:
Training and Development Performanc
- Page 264 and 265:
Group DEVELOPMENT CENTERS Company/C
- Page 266 and 267:
For the years 2006-2007 the graph i
- Page 268 and 269:
the Sales&Marketing departments of
- Page 270 and 271:
language) to explain the meaning of
- Page 272 and 273:
(Have you ever been to a superbike
- Page 274 and 275:
Details on certain important initia
- Page 276 and 277:
A photo exhibit on the 100th annive
- Page 278 and 279:
The campaign began with the deliver
- Page 280 and 281:
As part of the restructuring proces
- Page 282 and 283:
Group affiliates still provide heal
- Page 284 and 285:
—— effective involvement of res
- Page 286 and 287:
To better understand these data, it
- Page 288 and 289:
Pirelli Real Estate S.p.A. Over the
- Page 290 and 291:
Awareness raising and training Pire
- Page 292 and 293:
This plan calls for: —— a self-
- Page 294 and 295:
larly on the work of the standing c
- Page 296 and 297:
focusing on reinforcing young peopl
- Page 298 and 299:
Romania In its first year of activi
- Page 300 and 301:
In the medical field, Pirelli provi
- Page 302 and 303:
A decade ago Pirelli signed an agre
- Page 304 and 305:
In April 2008 Pirelli and the Milan
- Page 306 and 307:
This is the spirit behind the proje
- Page 308 and 309:
THE GLOBAL COMPACT PRINCIPLES AND G
- Page 310:
ANNUAL FINANCIAL REPORT 2008 309
- Page 313 and 314:
EXTRAORDINARY SESSION CONSOLIDATED
- Page 315 and 316:
EXTRAORDINARY SESSION CONSOLIDATED
- Page 317 and 318:
EXTRAORDINARY SESSION CONSOLIDATED
- Page 319 and 320:
EXTRAORDINARY SESSION CONSOLIDATED
- Page 321 and 322:
EXTRAORDINARY SESSION CONSOLIDATED
- Page 323 and 324:
EXTRAORDINARY SESSION CONSOLIDATED
- Page 325 and 326:
EXTRAORDINARY SESSION CONSOLIDATED
- Page 327 and 328:
EXTRAORDINARY SESSION CONSOLIDATED
- Page 329 and 330:
EXTRAORDINARY SESSION CONSOLIDATED
- Page 331 and 332:
EXTRAORDINARY SESSION CONSOLIDATED
- Page 333 and 334:
EXTRAORDINARY SESSION CONSOLIDATED
- Page 335 and 336:
EXTRAORDINARY SESSION CONSOLIDATED
- Page 337 and 338:
EXTRAORDINARY SESSION CONSOLIDATED
- Page 339 and 340:
EXTRAORDINARY SESSION CONSOLIDATED
- Page 341 and 342:
EXTRAORDINARY SESSION CONSOLIDATED
- Page 343 and 344:
EXTRAORDINARY SESSION CONSOLIDATED
- Page 345 and 346:
EXTRAORDINARY SESSION CONSOLIDATED
- Page 347 and 348:
EXTRAORDINARY SESSION CONSOLIDATED
- Page 349 and 350:
EXTRAORDINARY SESSION CONSOLIDATED
- Page 351 and 352:
EXTRAORDINARY SESSION CONSOLIDATED
- Page 353 and 354:
EXTRAORDINARY SESSION CONSOLIDATED
- Page 355 and 356:
EXTRAORDINARY SESSION CONSOLIDATED
- Page 357 and 358:
EXTRAORDINARY SESSION CONSOLIDATED
- Page 359 and 360:
EXTRAORDINARY SESSION CONSOLIDATED
- Page 361 and 362:
EXTRAORDINARY SESSION CONSOLIDATED
- Page 363 and 364:
EXTRAORDINARY SESSION CONSOLIDATED
- Page 365 and 366:
EXTRAORDINARY SESSION CONSOLIDATED
- Page 367 and 368:
EXTRAORDINARY SESSION CONSOLIDATED
- Page 369 and 370:
EXTRAORDINARY SESSION CONSOLIDATED
- Page 371 and 372:
EXTRAORDINARY SESSION CONSOLIDATED
- Page 373 and 374:
EXTRAORDINARY SESSION CONSOLIDATED
- Page 375 and 376:
EXTRAORDINARY SESSION CONSOLIDATED
- Page 377 and 378:
EXTRAORDINARY SESSION CONSOLIDATED
- Page 379 and 380:
EXTRAORDINARY SESSION CONSOLIDATED
- Page 381 and 382:
EXTRAORDINARY SESSION CONSOLIDATED
- Page 383 and 384:
EXTRAORDINARY SESSION CONSOLIDATED
- Page 385 and 386:
EXTRAORDINARY SESSION CONSOLIDATED
- Page 387 and 388:
EXTRAORDINARY SESSION CONSOLIDATED
- Page 389 and 390:
EXTRAORDINARY SESSION CONSOLIDATED
- Page 391 and 392:
EXTRAORDINARY SESSION CONSOLIDATED
- Page 393 and 394:
EXTRAORDINARY SESSION CONSOLIDATED
- Page 395 and 396:
EXTRAORDINARY SESSION CONSOLIDATED
- Page 397 and 398:
EXTRAORDINARY SESSION CONSOLIDATED
- Page 399 and 400:
EXTRAORDINARY SESSION CONSOLIDATED
- Page 401 and 402:
EXTRAORDINARY SESSION CONSOLIDATED
- Page 403 and 404:
EXTRAORDINARY SESSION CONSOLIDATED
- Page 405 and 406:
EXTRAORDINARY SESSION CONSOLIDATED
- Page 407 and 408:
EXTRAORDINARY SESSION CONSOLIDATED
- Page 409 and 410:
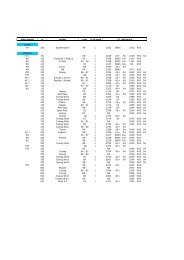
Companies consolidated line-by-line
- Page 411 and 412:
EXTRAORDINARY SESSION CONSOLIDATED
- Page 413 and 414:
EXTRAORDINARY SESSION CONSOLIDATED
- Page 415 and 416:
EXTRAORDINARY SESSION CONSOLIDATED
- Page 417 and 418:
EXTRAORDINARY SESSION CONSOLIDATED
- Page 419 and 420:
EXTRAORDINARY SESSION CONSOLIDATED
- Page 421 and 422:
EXTRAORDINARY SESSION CONSOLIDATED
- Page 423 and 424:
EXTRAORDINARY SESSION CONSOLIDATED
- Page 425:
Designed by Leftloft Printed by Art