Ferromagnetic Resonance Force Microscopy
Ferromagnetic Resonance Force Microscopy
Ferromagnetic Resonance Force Microscopy

Create successful ePaper yourself
Turn your PDF publications into a flip-book with our unique Google optimized e-Paper software.
<strong>Ferromagnetic</strong> <strong>Resonance</strong> <strong>Force</strong> <strong>Microscopy</strong><br />
P. E. Wigen a , M. L. Roukes b , and P. C. Hammel a<br />
Abstract<br />
The Magnetic <strong>Resonance</strong> <strong>Force</strong> Microscope (MRFM) is a novel scanning probe<br />
instrument which combines the three-dimensional imaging capabilities of magnetic<br />
resonance imaging (MRI) with the high sensitivity and resolution of atomic force<br />
microscopy (AFM). In the nuclear magnetic resonance (NMR) mode or the electron spin<br />
resonance (ESR) mode it will enable nondestructive, chemical-specific, high resolution<br />
microscopic studies and imaging of subsurface properties of a broad range of materials.<br />
In its most successful application to date, MRFM has been used to study microscopic<br />
ferromagnets. In ferromagnets the long range spin-spin couplings preclude localized<br />
excitation of individual spins. Rather the excitations employed in ferromagnetic<br />
resonance (FMR) are the normal magnetostatic wave (or spin wave) modes determined<br />
by the geometry of the sample. In this case the response of the cantilever will be a<br />
measure of the amplitude of the FMR signal integrated over the volume where the<br />
magnetic field gradient of the tip magnet is significant. Thus, as the magnetic tip is<br />
scanned across the material under study, the signal intensity will be proportional to the<br />
local amplitude of the normal modes. In addition, the MRFM technique has proven useful<br />
for the observation of relaxation processes in microscopic samples. The MRFM will also<br />
enable the microscopic investigations of the non-equilibrium spin polarization resulting<br />
from spin injection. Microscopic MRFM studies will provide unprecedented insight into<br />
the physics of magnetic and spin-based materials at the micron and sub-micron<br />
dimensions.<br />
1.1 Introduction<br />
Recent years have seen an extraordinary increase in the density of magnetic storage<br />
media and access speeds of read/write heads as well as great interest in the field of spin<br />
electronics. With such devices having dimensions at the nanometer scale, there is a need<br />
for the development of new techniques to characterize these materials. Two such<br />
examples include the near-field microwave microscopes [1] and the ferromagnetic<br />
resonance microscope [2]. The near-field microwave microscope uses a loop probe to<br />
measure local magnetic properties in ferromagnetic samples measures local magnetic<br />
properties on the length scale of 200 µm. The ferromagnetic resonance microscope uses<br />
a small hole, ~1mm diameter, in a thinned side wall of a microwave cavity to couple the<br />
microwaves to a sample. By moving the sample with respect to the opening a resolution<br />
on the order of the hole diameter is obtained. Scanning optical microscopes have<br />
recently been developed to observe phenomena at the submicron dimensions. Using<br />
“solid immersion lenses” and stroboscopic techniques, the measurement of the<br />
magnetization of a thin-film recording head was measured obtaining a resolution on the<br />
order of 200 nanometers [3] , In another experiment using microfocus Brillouin light<br />
scattering the magnetic dynamics of magnetic elements that are submicron in size were<br />
investigated [4,5].<br />
12/5/2005 1
The Magnetic <strong>Resonance</strong> <strong>Force</strong> Microscope (MRFM) provides another technique that has<br />
the sensitivity to detect a single electronic spin [6] and thus to obtain atomic resolution<br />
[7,8]. MRFM achieves such resolution by sensitively detecting the force between a small<br />
probe magnet mounted on a compliant cantilever and the magnetic moment of spins in<br />
the sample that are driven to vary their z-component at the cantilever resonance<br />
frequency.[9].<br />
High resolution imaging techniques such as atomic-force microscopy (AFM) and<br />
magnetic resonance imaging (MRI) have had a substantial impact in the fields of<br />
electonic and structual materials and medical science. AFM provides atomic scale<br />
resolution but is essentially limited to surface studies. MRI is a fully threedimensional,<br />
noninvasive imaging technology which employs an applied field gradient,<br />
∇B, to distinguish magnetic resonance signals arising from different locations in the<br />
sample. The high sensitivity of MRFM offers the possibility of shrinking the linear<br />
dimension of resolved volumes into the submicron regime with the potential of achieving<br />
spatial resolution comparable to that obtained from scanning tunneling and atomic force<br />
microscopy while obtaining detailed information such as obtained from optical<br />
spectroscopies. [10, 11] MRFM offers several unique advantages over other scanned<br />
probes including:<br />
• A 3-D imaging field with the extent of scanning below the surface being<br />
determined by the spatial dependence of the field gradient.<br />
• Because each nucleus has a unique gyromagnetic ratio, NMR imaging is<br />
chemical-species specific.<br />
• The well-developed and validated theory of magnetic-resonance interactions<br />
provides a reliable basis for the design and operation of imaging instruments.<br />
The MRFM is proving to be a versatile instrument that has been demonstrated in a<br />
variety of magnetic-resonance experiments;<br />
• Electron spin resonance [8,12]<br />
• Nuclear spin resonance [13, 14]<br />
• <strong>Ferromagnetic</strong> resonance [15]<br />
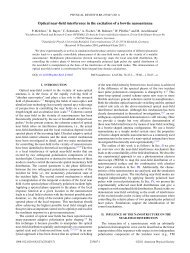
A schematic diagram of an MRFM apparatus is shown in Figure 1. The time dependence<br />
of m(r,t) is driven by modulating the bias magnetic field B 0 at some amplitude B M and at<br />
some frequency f M and simultaneously modulating the amplitude of the rf field B 1 at<br />
some frequency f 1 such that the beat frequency, f b = f M – f 1 , produces a time variation in<br />
the transfers component of the magnetization m(r,t) at the resonance frequency of the<br />
mechanical resonator, f c = f b .This produces a small variation in the z-component of the<br />
magnetization at the resonance frequency of the mechanical resonator. [16, 17] This<br />
time dependent variation in M z is coupled to mechanical resonator via the gradient in the<br />
magnetic field due to a small magnet on its tip. The oscillation amplitude of the<br />
mechanical resonator is detected by an optical fiber interferometer. By scanning the<br />
cantilever across the surface of a sample, a spatially resolved evaluation of the amplitude<br />
of m(r,t) can be obtained.<br />
12/5/2005 2
The rf microstrip excites the spin resonance in the sample while the probe magnet<br />
mounted on the tip of a compliant micromechanical resonantor produces a bowl shaped<br />
region in the sample (“resonant slice”) in which the resonant conditions for the spins in<br />
the sample are satisfied (See Figure 1). The field gradient produced by the tip magnet<br />
provides the conditions for establishing a force on the compliant cantilever necessary for<br />
the detection of the resonance. A time variation of the spin moments in the sample,<br />
m(r,t), will couple to the probe magnet mounted on a resonantor producing a force that is<br />
given by the relation<br />
F(r,t) = -[m(r,t)·∇]B probe (r). (1)<br />
Figure 1. A schematic view of the MRFM apparatus. In addition to the external field B o the<br />
sample is also exposed to an alternating field applied by the field solenoid, the field gradient<br />
of the magnetic tip on the mechanical resonator and the rf field produced by the rf microstrip.<br />
The resonant slice is the region in which the bias field plus the gradient field are sufficient to<br />
satisfy the resonant conditions for spins in that region of the sample [ref. 20].<br />
1.2 MRFM detection of Weakly Interacting Spins (ESR and NMR)<br />
The MRFM technique relies on the coupling between a time dependent resonating<br />
moment m(r,t) and a probe magnet mounted on a compliant micromechanical resonator<br />
via the force interaction given in Eq. 1 with the strength of the interaction being<br />
proportional to the gradient of the inhomogeneous magnetic field of the probe magnet.<br />
This force is measured through the detection of the displacement of the resonator that is<br />
deflected by the force F(r,t), or by the change in the resonant frequency of the cantilever.<br />
12/5/2005 3
The sensitivity of force detection is ultimately limited by the thermomechanical noise F n<br />
of the detector<br />
F n = √(2kk B T∆ν/πQf c ) . (2)<br />
This noise depends on the temperature T (k B is Boltzman’s constant) and the detection<br />
bandwidth ∆ν as well as the mechanical characteristics of the resonantor, such as its<br />
spring constant k, resonance frequency f c , and quality factor Q. [9, 12 18].<br />
A second key function of the magnetic field gradient is the definition of the volume of the<br />
spin magnetization that will be coupled to the force detector. The electron spin precesses<br />
at the Larmor frequency, f L<br />
f L = gµ B B Tot (3)<br />
where g is the electron g-factor of the given paramagnetic species in the host material and<br />
B Tot is the total magnetic field at the site of the resonating species and is the sum of the<br />
applied magnetic field, B o , and the magnetic field of the tip, B probe (r),<br />
B = B o + B probe (r). (4)<br />
If the applied field, B o , is set just below the value sufficient to establish resonance of the<br />
paramagnetic spins in the sample, then spins that are too close to the micromagnetic<br />
probe will have a resonance frequency that is too high to couple to the rf field, b rf , and<br />
will not resonate. Similarly, those too far from the probe magnet will have a resonance<br />
frequency that is too low to couple to the rf field. The region in the sample in which the<br />
resonant frequency of the paramagnetic spins satisfy the resonant condition determined<br />
by the frequency of the rf field, f rf , defines a bowl shaped “resonance slice” as shown in<br />
Figure 1. The width of the sensitive slice will be determined by magnitude of the field<br />
gradient, |∇ z B| established by the probe magnet and the resonance line-width ∆H lw . The<br />
width of the resonant slice, z sl , is given by<br />
z sl ≈ ∆H lw / |∇ Z B|. (5)<br />
This resonance slice can be scanned in the z-direction by changing the value of the<br />
applied field, B o , and in the xy-plane by scanning the position of the cantilever over the<br />
sample. Field gradients sufficiently large to obtain angstrom scale resolution can be<br />
obtained using probe magnets with sub-micron tip radii. Reliable interpretation of<br />
MRFM signals requires a thorough and detailed understanding of the interaction between<br />
the micromagnetic probe and the sample. [19, 20] The deconvolution of the signal to<br />
obtain sample images is more complicated for the bowl shaped resonance slice but<br />
imaging has been demonstrated [21] and this is a topic of active research [ 22-24].<br />
Further details of the ESR and NMR application are reviewed in the literature [20].<br />
12/5/2005 4
1.3 MRFM in <strong>Ferromagnetic</strong> Systems<br />
<strong>Ferromagnetic</strong> <strong>Resonance</strong> <strong>Force</strong> <strong>Microscopy</strong> (FMRFM) is a variation of MRFM that<br />
enables the characterization of the dynamic magnetic properties of magnetic structures at<br />
the micron scale. <strong>Ferromagnetic</strong>ally coupled systems pose unique challenges for<br />
magnetic resonance imaging due to the strong exchange coupling of the spins. The<br />
resulting magnetostatic/exchange resonance modes involve spins occupying the entire<br />
sample. The detector then monitors the amplitude of the oscillating magnetization within<br />
the range of the resonance slice of the detector probe and enables the characterization of<br />
the ferromagnetic resonance in three regimes defined by the degree to which the field of<br />
the micromagnetic probe perturbs the resonance modes [25,26]:<br />
• If the detector is scanned sufficiently far above the sample, the perturbation field<br />
of the tip magnet B tip is small, the amplitude of the various excited intrinsic<br />
resonance modes can be spatially resolved.<br />
• At intermediate heights, the magnetic field of the probe magnet is sufficiently<br />
strong as to alter the spatial “shape” of the resonance mode near the region of the<br />
probe. These perturbations will alter the detected amplitudes of the modes [27]<br />
and when scanned across the sample, this perturbation breaks the symmetry of the<br />
magnetic field within the sample and the normally “hidden” modes having odd<br />
symmetry in the unperturbed case will have a net dipole moment and will be<br />
observed.<br />
• As the probe magnet is moved very close to the sample surface the strong<br />
perturbations the local magnetic field results in those modes having a half<br />
wavelength approximately the size of the “resonant slice” becoming strongly<br />
excited. [26]<br />
1.3.1 Magnetostatic Modes.<br />
The ability of FMRFM to detect resonance in thin magnetic Yttrium Iron Garnet (YIG)<br />
films was first reported by Zhang, et al. [15]. While this initial report clearly showed a<br />
spectrum of magnetostatic modes, the irregular shape of the sample made it impossible to<br />
consider the details of the modes. Since that time a number of additional groups have<br />
observed the ferromagnetic resonance spectra in a variety of magnetic materials having<br />
well structured and characterized geometries. M. Midzor, et al. [25] investigated the<br />
ability of the spectrometer to scan the resonant modes in a series of well structured<br />
microscopic YIG films having rectangular shapes. O. Klein, et al., have investigated the<br />
magnetostatic mode spectra and relaxation processes in a 160 µm diameter YIG disc [28-<br />
33]. D. Rugar, et al., have reported the observation of magnetostatic modes in YIG discs<br />
[34]. Z. Zhang has also reported the observation of the force detected resonance in thin<br />
cobalt microscopic films. [18].<br />
The observations by the group of O. Klein in thin YIG discs reported the resonances<br />
ascribed to magnetostatic modes having axial symmetry across the sample. The two<br />
dimensional Bessel function like modes are labeled by (n,m), the number of nodes,<br />
respectively, in the radial and circumferential directions. The various modes resonate at<br />
12/5/2005 5
different fields as a consequence of the dependence of their excitation energies on the<br />
dipolar interactions between spins in the cylinder, and hence on its aspect ratio.[35]<br />
Figure 2b shows a sample fabricated by ion milling from a single crystal YIG film having<br />
a thickness of 4.75 µm with the [111] direction, the easy axis, oriented normal to the film<br />
plane. The disk has a radius R = 80 µm. The dimensions are large enough so that<br />
standard FMR experiments can be carried out on the sample. Figure 2c shows the<br />
microwave susceptibility of the disk as a function of the dc magnetic field applied<br />
parallel to the disk axis (perpendicular resonance). The absorption spectrum was<br />
measured at 10.46 GHz. Four magnetostatic modes are resolved corresponding to the<br />
longest wavelength magnetostatic modes.<br />
Figure 2. Images of both the cylindrical probe magnet (a) and the YIG disk(b). (c) The<br />
derivative of the imaginary part of the microwave susceptibility of the disk obtained from a<br />
microwave cavity.[ref.28]<br />
The same disk measured by standard FMR methods was then tested by the mechanical<br />
force detection. The sample temperature was fixed at T = 285 K where the saturation<br />
magnetization is 4πM s (T) = 1815 G. A probe magnet (shown in Figure 2a) 18 µm in<br />
12/5/2005 6
diameter and 40 µm in length is glued to the end of a cantilever having a spring constant<br />
k = 0.5 N/m in a bias field of 5.3 kG.<br />
The probe magnet is set a distance of 110 µm above the YIG sample. This large<br />
separation is required so that the magnetic field of the probe magnet at the sample is<br />
sufficiently weak so as not to perturb the “shape” of the magnetostatic modes. At this<br />
height the magnetic field gradient produced on the sample is less than 0.16 G/ µm. The<br />
MRFM is then used not for sensitive detection of FMR, but to allow measurement of the<br />
longitudinal sample magnetization that can be compared with data obtained by traditional<br />
FMR techniques. The MRFM signal is proportional to variations in the longitudinal<br />
magnetization ∆M z and thus it increases linearly with microwave power (~b rf 2 ) below<br />
saturation where the transverse component of the magnetization m(r,t) is proportional to<br />
b rf .<br />
Figure 3 shows the field dependence of the FMRFM signal when the probe magnet is<br />
placed on the symmetry axis of the disk and the amplitude of b rf is fully modulated at the<br />
resonance frequency of the cantilever f = 2.8 kHz. The microwave peak power is<br />
increased gradually during the sweep, from 25 µW for the longest wavelength modes up<br />
to 2.5 mW at B o = 4.7 kOe. The normalized result is shown on a logarithmic scale. A<br />
FIG. 3. Mechanically detected FMR spectrum of the normally magnetized YIG disk. The signal is<br />
proportional to the changes of the longitudinal component of the magnetization ∇M z . The<br />
absence of even absorption peaks, (2n,0), is a signature that the probe is placed precisely on the<br />
symmetry axis of the disk. [ref. 28]<br />
12/5/2005 7
series of 100 absorption peaks is resolved demonstrating the sensitivity of mechanical<br />
detection.<br />
A fit of the magnetostatic modes to the dispersion relation is shown in Figure 4. Although<br />
exact modeling can be carried out numerically, an analytical expression which assumes<br />
that the disk is uniformly magnetized has been used. In practice, the rotation of the<br />
magnetization at the outer edge of the sample results in an effective decrease of the radial<br />
wave vector, k, which is equivalent to an increase of the effective disc radius. To fit the<br />
data with a uniformly magnetized disk model at n = 30, a radius of 85 µm (compared to<br />
the actual radius of 80 µm) had to be assumed. In addition, for n > 50, a better fit was<br />
obtained by including exchange effects into the dispersion relation. The FMRFM data<br />
agree quantitatively with the model for the entire range of observed modes.<br />
Figure 4. Mode number n as a function of the external field where n is the number of<br />
standing waves in the radial direction. The open circles are the field position of each<br />
absorption peak measured in Fig. 3. The solid line is the theoretical predictions for a<br />
uniformly magnetized disk of radius 85 mm. The long dashed line is the same calculation<br />
for R = 80 mm (approximately the physical dimension of the sample). The short dashed line<br />
in the inset shows the behavior when exchange effects are omitted (D = 0). [ref. 28]<br />
12/5/2005 8
1.3.2 Linewidths<br />
In addition to determining the internal fields of ferromagnetic materials, another<br />
important application of FMR is to understand magnetization dynamics; measurement of<br />
relaxation of magnetization provides insight into the dissipation of magnetic energy. A<br />
recent report [31] describes the application of MRFM to the measurement of the<br />
transverse relaxation time T 2 and the longitudinal relaxation time T 1 in micron size<br />
ferromagnetic films.<br />
By measuring the linewidth of the ferromagnetic system at different rf-frequencies three<br />
separate contributions to the linewidth can be extracted from the data:<br />
• A radiation damping term ∆H rd of 0.62G due to relaxation of the magnetization<br />
through coupling to the microstrip resonator.<br />
• A second contribution ∆H lin with a linear dependence on frequency having a<br />
slope of 0.043G/GHz.<br />
• A frequency independent term ∆H cst = 0.50G which is due to inhomogeneous<br />
broadening and to scattering inside the magnon manifold.<br />
The results are shown in Figure 5. These measurements are consistent with the early<br />
reports of LeCraw [36] .<br />
Figure 5 The frequency dependence of the linewidth measured mechanically. The magnetic field<br />
strength is 5324.5 Oe. Contributions to the line width are separated into linear, ∆H lin , and<br />
frequency independent, ∆H cst , relaxation channels. Homogeneous broadening, ∆H h and radiation<br />
damping effects, ∆H rd , are indicated by arrows [ref. 31].<br />
The contribution of the homogeneous and inhomogeneous broadening was obtained by<br />
performing a series of experiments in which the amplitude of the longitudinal and<br />
transverse components of the magnetization are independently observed for various<br />
modulation frequencies. As the resonant frequency of the cantilever ω c is fixed at 3 kHz,<br />
the broad band modulation experiments were performed by using anharmonic techniques<br />
[16,17]. The amplitude of the rf field was fully modulated at a frequency ω s while the<br />
frequency output of the generator was modulated at a frequency ω f such that ω f = ω s +<br />
ω c . Figure 6 shows the decrease of and with increasing modulation<br />
frequency ω f . From this data the homogeneous broadening of ∆H h = 0.70 ± 0.05 G and a<br />
12/5/2005 9
longitudinal relaxation time of T 2 = 2/(γ∆H h ) = 162 ± 10 ns was determined. From the<br />
measurement of the power dependence of the longitudinal magnetization a value of T 1 =<br />
106 ± 10 ns is obtained for the transverse relaxation time.<br />
A consistency check was obtained by repeating the measurements at higher power when<br />
foldover effects take place [31]. The locus of the resonance, observed during sweeps of<br />
H ext , decreases quadratically with the precession angle θ. When the shift is greater than<br />
the linewidth, the response becomes hysteretic. Figure 7 shows the line shape asymmetry<br />
of the mechanical signal when the disk is excited at different powers.<br />
Figure 6 (a) Theoretical and (b) experimental distortion of the anharmonic absorption line<br />
(longitudinal and transverse) for different modulation frequencies between 0.1 and 10 MHz in<br />
steps of 1 MHz. The amplitude of the frequency modulation corresponds to 10% of the line width.<br />
[ref. 31]<br />
12/5/2005 10
Figure 7 The up-sweep and down-sweep profile of the resonance peak at high power. [Ref. 31]<br />
More recently the group has reported the first measurements of M z , the time average<br />
magnetization at the saturation of the main resonance [33]. They find that M z decreases<br />
rapidly when saturation effects set in. This decrease results from a rapid growth of the<br />
non-equilibrium degenerate magnons. The sample is large enough that they are able to<br />
simultaneously observe the reflected signal from the microwave stripline as in<br />
conventional FMR and observe the longitudinal signal with the MRFM. Figure 8 is a<br />
plot of both the transverse susceptibility, χ” and ∆M z as a function of the driving field, h.<br />
The results are in qualitative agreement with the Suhl model describing the saturation of<br />
the main resonance in the presence of two–magnon scattering [37].<br />
Figure 8 The microwave field strength dependence of the transverse and longitudinal<br />
components of the magnetization at 10.47 GHz [Ref.33]<br />
1.3.3 Scanning Mode<br />
The most versatile application of FMRFM has been reported by M. Midzor [25, 26]. The<br />
probe magnet was a 170 nm thick Permalloy film deposited on an ultrasharp conical<br />
12/5/2005 11
AFM tip as shown in Figure 9. The calculated strength of the magnetic field and the<br />
magnetic field gradient as a function of the distance from the tip of the probe magnet are<br />
shown in Figure 10.<br />
In these experiments a 3 µm thick single crystal YIG film was patterned into a<br />
geometrical series of rectangular samples by optical lithography and ion beam milling.<br />
Two sets of rectangular samples of different widths were fabricated: (a) w = 10µm<br />
having lengths L =10, 20, 40, 80 and 160µm and (b) w = 20µm having lengths L = 20,<br />
40, 80, 160 and 320µm. A typical spectrum observed for the 20 X 80 µm sample is<br />
shown in Figure 11.<br />
In the measurements represented in Figure 11, the probe magnet is approximately 10µm<br />
above the sample surface and produces a negligible additional field, H probe , at the sample<br />
(calculated to be about 15 Gauss). In this weak field perturbation limit the modes are<br />
identified by the values of n x (half wavelength modes across the width of the sample) and<br />
n y (half wavelength modes along the length of the sample).<br />
Figure 9, Permalloy film selectively deposited on an ultrasharp conical AFM tip [Ref 26].<br />
12/5/2005 12
Field (Gauss)<br />
100<br />
8<br />
6<br />
4<br />
2<br />
10<br />
8<br />
6<br />
4<br />
Field Gradient<br />
Tip Field<br />
2 3 4 5 6 7 8 9<br />
10<br />
d (µm)<br />
4<br />
2<br />
4<br />
2<br />
4<br />
2<br />
10<br />
1<br />
Field Gradient (Gauss/ µm)<br />
Figure 10, Magnetic field and the magnetic field gradient of the coated tip shown in Figure 9 vs.<br />
distance from the tip is shown. The blue line is from a micromagnetic calculation of the tip field<br />
and the red line is obtained by differentiating that curve. [Ref 26].<br />
MRFM Signal (Arbitrary Units)<br />
9/2,1/2<br />
7/2,1/2<br />
5/2,1/2<br />
1/2,11/2<br />
1/2,9/2<br />
1/2,7/2<br />
1/2,5/2<br />
1/2,3/2<br />
3/2,1/2<br />
B o = 4.2 kG<br />
-600 -400 -200 0<br />
B sweep (Gauss)<br />
1/2,1/2<br />
Figure 11. The spectrum obtained from the 20 X 80 µm sample with the magneto-static modes<br />
identified by the numbers (n x , n y ). B 0 is the field position of the fundamental mode and B sweep is the<br />
field separation from the fundamental mode [ref 26].<br />
1.3.3.1 Dependence of the Fundamental Mode on Sample Dimensions.<br />
12/5/2005 13
The positions of the peaks in the magnetostatic mode spectra depend on the size of the<br />
sample. For the series of 20µm wide samples, the spectra are shown in Figure 12.<br />
MRFM Signal (Arbitrary Units)<br />
-<br />
20 X 40<br />
20 X20<br />
-300 -200 -100 0 100 200 300<br />
B Sweep (G)<br />
Figure 12. The observed spectra for a family samples having lengths of 20, 40, 80, 160 and 320<br />
µm. The positions of the fundamental modes are compared with the theory in Figure14 and the<br />
mode spacings are compared with Eqn.8 in Figure 15 [ref. 26].<br />
For an ellipsoidal sample the resonance condition is given by the relation:<br />
⎛<br />
⎜<br />
⎝ γ ⎠<br />
2<br />
[ ] ,<br />
ω ⎞<br />
⎟ = [ B − π ( N − N ) M ] × B − 4π<br />
( N − N ) M<br />
(6)<br />
o<br />
4<br />
z x<br />
0<br />
z<br />
y<br />
where ω is the radial frequency of the RF field, γ is the gyromagnetic ratio, H o is the<br />
applied field, M is the magnetic moment of the media and the N i are the demagnetization<br />
factors along the three principle axes of the ellipsoid.<br />
Because the samples used in this study are not ellipsoidal in shape, the internal fields vary<br />
within the sample; this can be calculated as a function of the position within the material.<br />
Assuming that the magnetization is saturated along a given axis, the magnetic “surface<br />
charge” at the surfaces will produce a demagnetization field which varies as a function of<br />
position between the two surfaces normal to the direction of the magnetization and<br />
having a minimum value at the center of the film. Typical results are shown for the<br />
20µm × 80µm sample in Figure 13.<br />
12/5/2005 14
x-direction, short axis, 20µm<br />
y-direction, long axis, 80µm<br />
z-direction, normal, 3µm<br />
Internal Field (Gauss)<br />
1600<br />
1200<br />
800<br />
400<br />
0<br />
-50 -25 0 25 50<br />
Percentage Position Along the i th -direction<br />
Figure 13 The internal field along the various axes of the 20µm by 80µm sample. The value of<br />
the internal field at the center of the sample (zero percent) was taken as the value of H i,int in Eq. 4<br />
above.<br />
The value of the internal field at the center of the sample (zero percent in Figure 13) for<br />
each orientation is used for the demagnetization field in the dispersion relation for the<br />
case of ellipsoidal shapes of Eqn, 6 to give an approximate dispersion relation of the<br />
form:<br />
2<br />
[ H − ( H − H )] × [ H − ( H − H )] . (7)<br />
⎛ ω ⎞<br />
⎜ ⎟ =<br />
o z ,int x ,int<br />
0 z ,int y ,int<br />
⎝ γ ⎠<br />
Using a value of 4πM = 1730 G, the values of the calculated resonances compare<br />
quantitatively with the observed resonances for the fundamental modes of the 20 micron<br />
wide series in Figure 14.<br />
12/5/2005 15
Hres, Fundamental Mode (G)<br />
3900<br />
3850<br />
3800<br />
3750<br />
3700<br />
3650<br />
18 14 12 10 8 6 4 2 0<br />
Sample Length (µm)<br />
Figure 14. The magnetic field at which the fundamental modes were excited as a<br />
function of the length of the series of 10 µm wide samples. The fit to the experimental<br />
data is represented by the curve which results if the best fit values ω/γ = 2.7 kG and 4πM<br />
= 1.6 kG are used [ref 26].<br />
1.3.3.2 Dispersion Relation<br />
The dispersion of the higher order modes shown in Figure 11 are plotted in Figure 15. At<br />
these dimensions the linear approximation to the Damon Eshbach (DE) theory is not<br />
applicable and the dispersion curve must be solved explicitly [36,37]:<br />
⎡<br />
2<br />
ω = ω<br />
i ⎢ω<br />
i<br />
+ ω<br />
⎣<br />
M<br />
⎛ 1−exp(<br />
−k<br />
⎜ 1−<br />
⎝ kt<br />
d<br />
t<br />
d)<br />
⎞⎤<br />
⎟⎥,<br />
⎠⎦<br />
where ω i = γH i , ω M = 4πγM s and H i = H res – H demag . H i is the internal field required to<br />
support the i th magnetostatic mode having the transverse wave number k t , H demag is the<br />
demagnetization field at the center of the sample, ω is the applied rf radial frequency and<br />
H res is the external field at which resonance occurs.<br />
By imposing the natural physical boundary conditions established by the lateral<br />
dimensions of a rectangular sample, k t is approximated as plane waves having the<br />
allowed values<br />
k<br />
t<br />
=<br />
⎛<br />
⎜<br />
⎝<br />
1 / 2<br />
2 2<br />
2 2 2<br />
( ) 1 / ⎜<br />
n<br />
x<br />
π y<br />
k + k = + ⎟ .<br />
x<br />
y<br />
w<br />
2<br />
n<br />
2<br />
π<br />
L<br />
2<br />
2<br />
⎞<br />
⎟<br />
⎠<br />
(8)<br />
(9)<br />
12/5/2005 16
The mode numbers n x and n y are positive integers equal to the number of half<br />
wavelengths along the width, w, and the length, L, respectively. Since the samples are<br />
not ellipsoidal the internal fields are not uniform across the sample, yet it is observed that<br />
the complicated amplitude dependence of the modes can be reasonably represented in the<br />
plane wave approximation. The modes having even values of n will have odd symmetry<br />
and thus a zero net dipole moment. As a result they will not be excited by the uniform rf<br />
field (hidden modes). The following parameters were used in the calculation: ω = 7.6<br />
GHz, d = 3.15µm, 4πM s = 1760 G and g = 2. H demag is calculated for the sample of this<br />
geometry to be 1660 G. The calculated positions are also plotted in Figure 15.<br />
Magnetic Field (kGauss)<br />
4.2<br />
4.1<br />
4.0<br />
3.9<br />
3.8<br />
3.7<br />
Theory<br />
higher modes along length<br />
(1, n x )<br />
Experiment<br />
higher modes along width<br />
(n y , 1)<br />
1 3 5 7 9 11<br />
Magnetostatic mode number (n x , n y )<br />
Figure 15. A comparison of the magnetic field at which magnetostatic modes are<br />
observed in experiment and predicted by theory (Eqn 6 [ref 26]).<br />
1.3.3.3 Spatial Mapping of Magnetostatic Modes<br />
A series of measurements showing the variation in the amplitude of the time dependent<br />
magnetization associated with various magnetostatic modes are shown in Figure 16. The<br />
probe magnet is positioned about 5 µm vertically above the sample surface. The spectra<br />
are then obtained with the probe positioned at nine different lateral locations along the<br />
long axis of the 20µm × 80µm sample.<br />
12/5/2005 17
The lateral spatial resolution of FMRFM is demonstrated by plotting the lateral position<br />
dependence (along the 80 µm axis) of several mode amplitudes as shown in Figure 17.<br />
The signal amplitude measured at the detector depends on the spatial variation of the<br />
amplitude of the magnetostatic modes m t (r,t). The amplitude of the fundamental mode,<br />
n x = n y = 1, has a maximum amplitude at the center of the film and falls off as expected<br />
for the cosine dependence of a mode having a wavelength equal to twice the length of the<br />
sample. The wavelength of the first higher order mode, n y = 3, is 2/3 the sample length,<br />
hence 3/2 of the spatial period is contained in the long axis of the film, so the amplitude<br />
shows a minimum near the 13 µm position and a maximum near the 26 µm as expected.<br />
The scan of the n y = 5 mode (λ/2=16 µm) evidenced no detectable variation in the mode<br />
amplitude. This suggests a resolution limit of about 20 µm, a diameter established by the<br />
extent of the dipole field of the probe magnet, approximately twice the scan height.<br />
Figure 16. The spectra obtained from the 20 X 80 µm as the probe is scanned along the length<br />
from one end of the sample to the other [ref 26].<br />
12/5/2005 18
16<br />
14<br />
mode (1,1)<br />
mode (1,3)<br />
mode (1,5)<br />
12<br />
Amplitude (a.u.)<br />
10<br />
8<br />
6<br />
4<br />
2<br />
0<br />
-40 -30 -20 -10 0 10 20 30 40<br />
Distance across sample (µm)<br />
Fgure 17. The amplitude of the peaks as a function of the position of the probe magnet along the<br />
length of the 20 X 80 µm sample.<br />
1.3.3.4 Hidden Modes<br />
A second interesting feature of the spectra in Figure 16 is the demonstration of the ability<br />
of the probe magnet field to break the field symmetry in the sample and enable<br />
observation of “hidden modes.” At a distance of 5 µm above the film the strength of the<br />
probe magnetic field at the surface is approximately 20 G. When the probe is located at<br />
the center of the film, the internal field remains symmetric and the hidden modes having<br />
even n-values are not excited by the rf-field. However, as the probe magnet is scanned<br />
along the long axis, the 20 G magnetic field due to the probe magnet is sufficient to break<br />
the symmetry of the internal field in the sample. The normally hidden mode n y = 2, n x =<br />
1 is then no longer antisymmetric and has a weak maximum in its intensity at y = ± 20<br />
µm as shown in Figure 16.<br />
1.3.3.5 Mapping RF force fields<br />
FMRFM also has the potential to determine the strength and the shape of the RF field<br />
associated with the precessing ferromagnetic moment in the volume surrounding the<br />
resonant sample. Figure 18a shows spectra observed when the probe magnet is scanned<br />
across the narrow dimension of the 20µm × 80µm sample at a probe height of 10 µm.<br />
Note that the amplitude of the fundamental mode goes to zero at x = 8µm as expected and<br />
the phase rotates by π for larger values of x. In Figure 18b the data is repeated for a<br />
12/5/2005 19
sweep height of 5µm showing the intensity of the modes going to zero at x = 12µm and<br />
again a phase rotation at larger distances. When the spectrum is observed as<br />
a function of the height of the probe magnet above the sample at the position x = 10µm,<br />
the modes have a zero intensity at z = 8µm with the phase of the signal changing by π<br />
above and below.that height.<br />
The origin of this effect is the spatial dependence of the interaction between the gradient<br />
field of the probe magnet and the precessing moment of the sample [16]. The gradient of<br />
the dipole field generated by the probe magnet is negative directly below the probe and<br />
positive in the plane of the tip. As the probe is moved laterally beyond the edge of the<br />
sample the gradient of the dipole field decreases and eventually changes sign. As the<br />
sample is moved under the probe magnet there will be a position at which the integrated<br />
sum of the positive and the negative forces will cancel and beyond that position the<br />
negative force, observed as a reversal of the signal phase, will dominate. Calculated<br />
positions of expected phase reversals as a function of the height of the probe magnet are<br />
consistent with the data shown in Figure 18.<br />
Figure 18 Spectra obtained from the 20µm × 80µm sample as the probe magnet is scanned<br />
perpendicular to the long axis of the sample; the traces are labeled by the distance of the probe<br />
from the center of the film at a height of 10µm(panel a) and 5µm above the sample (panel b) [ref<br />
26].<br />
1.3.4 FMRFM in metal films.<br />
FMRFM in metal films have been reported [38-39] for metallic Co films deposited on the<br />
cantilever with the magnetic field applied in the film plane. Midzor [23] investigated a<br />
12/5/2005 20
imagnetic layer structure of Ag 30 Å\Co 50 Å\Cu 150 Å\Co 100 Å\Cu 35Å as shown in<br />
Figure 19. A 40 µm by 40 µm film composite was sputter deposited directly on the<br />
cantilever. The relatively thick 150 Å Cu layer was used in order to ensure negligible<br />
exchange coupling between the Co layers. The gradient field was ~ 0.15 G/µm so the<br />
Figure 19. FMRFM spectrum obtained for the multilayer composite indicated in the inset. The<br />
two Co films have different resonance fields due to the different volume and surface anisotropy<br />
energies [ref 26].<br />
field variation of 6 G across the sample is small in comparison to the ~80 G linewidth of<br />
50 100<br />
the samples. The amplitude ratio of the two signals is A<br />
pp<br />
A pp<br />
≈ 0. 3. The discrepancy<br />
with the ratio of layer thicknesses is within the accuracy of the ability to determine the<br />
thicknesses of films of this area depositied by shadow masking techniques. In the<br />
analysis below, it was assumed that the thinner Co layer has a thickness of 30 Å.<br />
The volume and the surface anisotropy energies of the Co layers can be estimated by<br />
fitting their resonance fields to the empirical formula<br />
H<br />
eff<br />
U<br />
=<br />
2<br />
M<br />
S<br />
⎛<br />
⎜ K<br />
⎝<br />
V<br />
2K<br />
+<br />
t<br />
S<br />
film<br />
⎞<br />
⎟<br />
⎠<br />
(10)<br />
where K V and K s are the volume and surface anisotropies for the films, t is the film<br />
thickness and H is the effective uniaxial anisotropy field. The calculated values of K V<br />
eff<br />
U<br />
12/5/2005 21
and K s are given in Table I where it is assumed that the Co films have bulk values of<br />
4πM s . The experimental values agree well with typical results reported in the literature.<br />
[41-43]<br />
Table I<br />
Experimentally determined values of the volume and surface anisotropy energies for the<br />
Co/Cu interfaces in the bilayer film [26].<br />
⎛<br />
⎞<br />
eff 2<br />
⎜<br />
2K<br />
Fit to data<br />
Literature Values<br />
S<br />
H = + ⎟<br />
U<br />
K<br />
V<br />
M<br />
Co/Cu interface<br />
Co/Cu interface<br />
S ⎝ M<br />
S<br />
t<br />
film ⎠<br />
t Co (Å) 100 10-50<br />
K V (×10 6 erg/cm 3 ) 1.1±0.2 0.9 – 2.0<br />
K S (erg/cm 2 ) 0.15±0.05 0.1 - 0.35<br />
For the Co/Ag Interface<br />
⎛<br />
⎞<br />
eff 2<br />
⎜<br />
2K<br />
Fitted<br />
Typical Values<br />
S<br />
H = + ⎟<br />
U<br />
K<br />
V<br />
Co/Ag interface<br />
Co/Ag interface<br />
M<br />
S ⎝ M<br />
S<br />
t<br />
film ⎠<br />
t Co (Å) 30 15-30<br />
K V (×10 6 erg/cm 3 ) 1.7±0.3 1.0 – 1.4<br />
K S (erg/cm 2 ) 0.45±0.05 0.2 - 0.4<br />
1.4 Torque Measurements in a Uniform Field<br />
Moreland and colleagues have demonstrated micromechanical detection of ferromagnetic<br />
moments and ferromagnetic resonance in thin magnetic films using torque deflection of<br />
the cantilever in a homogeneous magnetic field. [45-49] The detection scheme monitors<br />
the deflection of the cantilever with a laser beam-bounce method with the laser beam<br />
focused on the cantilever and reflected onto a split four quadrant photodiode detector as<br />
shown in Figure 20. The cantilever deflection signal corresponds to the (C+D)-(A+B)<br />
signal, whereas the cantilever torque signal corresponds to the (A+C)-(B+D) signal. This<br />
configuration enables the detection of both the deflection and the torque signals with the<br />
same apparatus. The Si cantilever has a deflection spring constant of 0.35 N/m with a<br />
resonant frequency of 17 kHz and a torsion spring constant of 3.0 × 10 -20 Nm/rad with a<br />
torsional resonance frequency of 250.3 kHz. The system is capable of detecting 10 pm<br />
amplitudes of vibration under ambient conditions.<br />
1.4.1 Mechanical Torque on a Thin Film<br />
12/5/2005 22
In the presence of an applied torque field, H T , the magnetization M of a thin film will<br />
generate a mechanical torque T. In many cases the shape anisotropy is sufficient to<br />
generate the mechanical torques that can be measured with micromechanical detectors.<br />
Considering the geometry in Figure 21 the torque is given by<br />
T = |M s × H T |V = M s H T V, (11)<br />
where M s is the sample magnetization, H T is the total magnetic field and V is the volume<br />
of the sample.<br />
Figure 20. Reflected laser spot on photodiode detector. [ref. 45]<br />
Figure 21. Vector diagram showing the orientations of the magnetic fields and torque on a thin<br />
film magnetized in-plane along the z direction [ref. 45]<br />
12/5/2005 23
1.4.2 Magnetization versus Field (M-H) Loops<br />
Figure 22 shows the experimental confguration for measuring M-H loops.[48] The<br />
torque field, H T , was applied by a solenoid and kept constant while the applied field, H o ,<br />
is applied in the film plane perpendicular to the long axis of the cantilever and cycled<br />
over the range of the observation. A typical result is shown in Figure 23. Fe films<br />
having thicknesses as small as 1 nm and a total volume of 2.2 × 10 -11 cm 3 could be<br />
measured.<br />
Figure 22. Experimental configuration for magnetic torque measurements with a cantilever. [ref.<br />
45]<br />
Figure 23. M-H loops on similar Fe films measured with a MTM. [ref. 45]<br />
12/5/2005 24
1.4.3 Micro Resonating Torque Magnetometer (µRTM)<br />
In the FMR mode [45,47,48] the change in the mechanical torque in FMR is proportional<br />
to the change in the longitudinal component of the magnetization as shown in Figure 24.<br />
∆T FMR = ∆M z H T V, (12)<br />
where ∆M z is the change in the magnetization due to the FMR precession.<br />
M<br />
Z<br />
=<br />
2 2<br />
2 2 2 2<br />
[ ] 1/ ⎛ m ⎞<br />
in<br />
+ mout<br />
M − m − m ≈ M − ⎜ ⎟<br />
(13)<br />
S<br />
in<br />
out<br />
S<br />
⎜<br />
⎝<br />
2M<br />
S<br />
⎟<br />
⎠<br />
where M s is the change in the magnetization, m in is the in-plane component of the<br />
magnetization and m out is the out-of-plane component.<br />
Figure 24. Vector diagram showing the orientation of the applied fields and mechanical torque<br />
generated in an FMR experiment. [ref. 45]<br />
Figure 25 shows the experimental configuration. The torque on the cantilever is<br />
measured as a function of the magnetic field applied along the axis of the cantilever and<br />
swept over the desired range. The Si cantilever was positioned 200 to 300 µm above a<br />
microstrip resonator having a resonance frequency of 9.17 GHz. At resonance, the torque<br />
developed by the precession is coupled to the cantilever and by modulating the amplitude<br />
of the microwave field at the torsional resonance frequency of 250.3 kHz the cantilever is<br />
excited in its torsional mode. Figure 26 shows the result for a 30 nm thick Permalloy<br />
film having a volume of 1.1 ×10 -10 cm 3 . Note that the direction of the torque is reversed<br />
upon reversing the direction of the sweep magnetic field, H o .<br />
12/5/2005 25
Figure 25. Experimental configuration for FMR with a µRTM [ref. 45]<br />
Figure 26. Torque versus applied field measured with the µRTM for a 30 nm thick NiFe film<br />
[ref. 45].<br />
1.4.4 Bimaterial Micromechanical Calorimeter Sensor for FMR<br />
<strong>Ferromagnetic</strong> resonance in magnetic metal films was also detected by using calorimetric<br />
detection of the microwave absorption using a micromechanical bimaterial sensor. [49]<br />
The detection method can be understood within the mathematical framework developed<br />
for other bimaterial thermal sensors. Consider the silicon cantilever, layer 1, as a<br />
rectangular beam fixed at one end with its metallic magnetic coating, layer 2, as a two<br />
12/5/2005 26
layer system each having different thermal properties. Solving the heat equation for this<br />
configuration the deflection at the free end of the beam will be<br />
E<br />
z = a<br />
E<br />
1<br />
2<br />
t<br />
l<br />
2 3<br />
1<br />
3<br />
t2<br />
w<br />
⎛ γ<br />
1<br />
− γ<br />
2<br />
⎜<br />
⎝ λ1t1<br />
+ λ2t<br />
2<br />
⎟ ⎞<br />
P<br />
⎠<br />
(14)<br />
where γ, λ, t , w, l, and E are respectively the thermal expansion coefficient, thermal<br />
conductivity, thickness, width, length, and Young’s modulus of the beam layers<br />
(subscripts refer to the different materials) and P is the absorbed power. Equation (14)<br />
applies only in the limit t 1
Figure 28. Cantilever vibration vs. applied field showing microwave absorption in Co, NiFe, Ni,<br />
and Au thin film samples.[ref. 49]<br />
1.5 CONCLUSION<br />
The MRFM employs a micromechanical resonator to detect the force between a<br />
micromagnetic probe tip and the time dependent spin magnetization of a well defined<br />
resonant slice within the sample. One, two and three dimensional imaging capabilities of<br />
MRFM have been demonstrated using ESR and NMR techniques. The recent<br />
demonstration of the detection of a single electron spin by MRFM will strongly stimulate<br />
additional interest in the field [6].<br />
The high sensitivity of MRFM takes advantage of the high Q of a mechanical cantilever.<br />
The amplitude of the magnetic resonance signal is modulated at a frequency that matches<br />
the cantilever resonance frequency f c thus generating a large amplitude cantilever<br />
oscillation. This time dependent drive is generated by modulating the uniform magnetic<br />
field and/or the rf field. The oscillation amplitude of the cantilever depends sensitively<br />
on the modulation amplitude, the rf field strength and the external field gradient.<br />
In ferromagnetic systems the resonance conditions are strongly influenced by exchange<br />
coupling and long range dipole-dipole effects so that the dispersion relation depends upon<br />
the total magnetic field resulting from external, effective internal anisotropy fields and<br />
upon the sample geometry. With the application of the probe magnet field, the wave<br />
vector k of magnetostatic modes will be modified by the magnetic field near the probe as<br />
the sample accommodates the localized inhomogeneous fields of the micromagnetic tip<br />
in order to satisfy the resonance condition in the entire sample. The volume of sample<br />
studied in an FMRFM experiment is thus not determined solely by the magnetic field<br />
gradient and the sample line width as in the case of the electron spin or the nuclear spin<br />
12/5/2005 28
esonant versions of MRFM. The challenge of achieving spatially localized FMR within<br />
an extended sample remains a topic of active research.<br />
FMRFM opens the possibility of conducting spatially resolved, sub-surface studies of<br />
many solid state materials. Examples include:<br />
• Magneto-static modes have been detected in YIG films having microscopic<br />
dimensions. The observed dispersion is in quantitative agreement with the<br />
Damon-Eshbach theory. [26, 28]<br />
• In a scanning mode, the spatial variations in the amplitudes of the magnetostatic<br />
modes have been observed in microscopic samples of YIG films. [26,27]<br />
• When the perturbation of the tip field is sufficient, the variation of the magnetic<br />
field in the media will modify the resonance condition of the magneto-static<br />
modes which will produce modification of the signal amplitude and when the tip<br />
is moved off the center of the sample the symmetry of the internal field is broken<br />
and the normally “hidden modes” can be excited. [26-28]<br />
• Mapping of the force fields reflecting the dipole nature of the magnetic<br />
interaction between the sample and the probe magnet has been observed. [26]<br />
• Sub-surface studies have been demonstrated in magnetic layer structures.<br />
FMRFM signals from microscopic Co/Cu/Co trilayer films demonstrate that<br />
MRFM is sensitive enough to perform microscopic evaluation of local magnetic<br />
environments that can affect the performance of magnetic layered devices. [40,<br />
41]<br />
• Bulk and surface anisotropy energies in microscopic metal films have been<br />
evaluated. [26]<br />
• Measurement of both the transverse susceptibility χ” and ∆M z as a function of the<br />
driving field H and evaluation of the relaxation times T 1 and T 2 in ferromagnetic<br />
resonance. [31, 33].<br />
• Investigation of the dramatic decrease in M z when the driving field reaches the<br />
threshold for 2 magnon excitation. [33]<br />
Using a mechanical torque effect on the cantilever:<br />
• From the torque acting on the cantilever hysteresis loops have been observed in<br />
microscopic samples. [45]<br />
• The torque induced rotation of the cantilever due to the precession of spins has<br />
been used to detect the ferromagnetic resonance in thin metal films mounted on<br />
the cantilever. [47, 48]<br />
• Treating the cantilever/film structure as a bilayer material, the heating of the<br />
ferromagnetic metal layer at resonance induces a thermal stress on the cantilever<br />
giving rise to a calorimeter sensor for FMR. [49]<br />
The extremely strong FMR signals obtained from microscopic samples of magnetic thin<br />
films indicates that MRFM has the potential to study a large variety of magnetic materials<br />
with very high sensitivity. By increasing the magnetic field gradients associated with the<br />
probe magnets it is expected that it will be possible to conduct microscopic FMR<br />
experiments with micron to submicron resolution.<br />
12/5/2005 29
Future generations of MRFM instruments will operate at lower temperatures, apply larger<br />
magnetic field gradients and employ advanced micromechanical resonators. Such<br />
instruments would enable unprecedented insight into topics of scientific and<br />
technological interest in the fields of electronic and magnetic materials.<br />
As the size and magnetic moment of the probe magnet is reduced, the resolution limit of<br />
FMRFM will approach that of the magnetic correlation length, 100 nm, the limit of the<br />
resolution of the magnetic properties in ferromagnetic materials.<br />
In addition to its application to ferromagnetic resonance phenomena, magnetic resonance<br />
force microscopy holds significant promise for applications in spin injection devices and<br />
in magnetic semiconductor devices where a spin-polarized electron current is employed<br />
to enhance information processing capabilities.<br />
1.6 Acknowledgements<br />
The authors wish to acknowledge the assistance received from there students and post<br />
doctoral fellows who have contributed to this program and assisted with the preparation<br />
of this manuscript, Z. Zhang, D. Pelekov, M. Midzor, A. Putilin and R. Urban and to<br />
Prof. M. Cross. PEW acknowledges the support of the R. J. Yeh fund during his visits at<br />
California Institute of Technology.<br />
1.7 References<br />
a. Ohio State University<br />
b. California Institute of Technology<br />
1. S-C. Lee, C. P. Vlahacos, B. J. Feenstra, A. Schwartz, D. E. Steinhauer, F. C.<br />
Wellstood and S. M. Anlage, “Magnetic Permeability Imaging of Metals with a<br />
Scanning Near-filed Microwave Microscope”, Appl. Phys. Lett. 77, 4404 (2000)<br />
2. S. E. Lofland, S. M. Bhagat, Q. Q. Shu, M. C. Robsen and R. Ramesh,<br />
“Magnetic Imaging of Perovskite Thin Films by Ferrromagnetic <strong>Resonance</strong><br />
<strong>Microscopy</strong>-La 0.7 Sr 0.3 MnO 3 ”, Appl. Phys. Lett.75, 1947 (1999).<br />
3. J. A. H. Stotz and M. R. Freeman, “A Stroboscopic Scanning Solid Emersion<br />
Lens Microscope”, Rev. Sci. Instrum. 68, 4468 (1997).<br />
4. K. Perzlmaier, M. Buess, C.H. Back, V.E. Demidov, B. Hillebrands, S.O.<br />
Demokritov, “Spin-wave eigenmodes of permalloy squares with closure domain<br />
structure”, Phys. Rev. Lett. (in press).<br />
5. V.E. Demidov, S.O. Demokritov, B. Hillebrands, M. Laufenberg, “Radiation of<br />
spin waves by a single micrometer-sized magnetic element”, Appl. Phys. Lett.<br />
85, 2866 (2004).<br />
12/5/2005 30
6. D. Rugar, R. Budakian, H. J. Mamin and B. W. Chui, “Single Spin Detection by<br />
Magnetic <strong>Resonance</strong> <strong>Force</strong> <strong>Microscopy</strong>”, Nature, 430, 329 (2004).<br />
7. J. A. Sidles, “Noninductive Detection of Single-Proton Magnetic <strong>Resonance</strong>,”<br />
Appl. Phys. Lett. 58, 2854 (1991).<br />
8. D. Rugar, C. S. Yannoni and J. A. Sidles, “Mechanical Detection of Magnetic<br />
<strong>Resonance</strong>,” Nature, 360, 563 (1992).<br />
9. J. A. Sidles and D. Rugar, “Signal-to-noise Ratios in Inductive and Merchanical<br />
Detection of Magnetic <strong>Resonance</strong>”, Phys. Rev. Lett., 70, 3506 (1993).<br />
10. B. C. Choi, M. Belov, W. K. Heibert, G. E. Ballentine and M. R. Freeman,<br />
“Ultrafast Reversal Magnetization Dynamics Investigated by Time Domain<br />
Imaging”, Phys. Rev. Lett., 86, 728 (2001).<br />
11. J. P. Park, P. Eames, D. M Engebretson, J. Berezovsky and P. A. Crowell,<br />
“Spatially Resolved Spin Dynamics of Localized Spin-wave Modes in<br />
<strong>Ferromagnetic</strong> Wires”, Phys. Rev. Lett. 89, 277201 (2002).<br />
12. P. C. Hammel, Z. Zhang, G. J. Moore and M. L. Roukes, “Subsurface Imaging<br />
with the Magnetic <strong>Resonance</strong> <strong>Force</strong> Microscope”, J. Low Temp. Phys., 101, 59,<br />
1995.<br />
13. D. Rugar, O. Zugar, S. T. Hoen, C. S. Yannoni, H. M. Vieth and R. D.<br />
Kendrick, “<strong>Force</strong> Detection of Nuclear Magnetic <strong>Resonance</strong>”, Science, 264,<br />
1560 (1994).<br />
14. T. A. Barrett, C. R. Miers, H. A. Sommer, K. Mochizuki, and J. T. Markert,<br />
"Design and Construction of a Sensitive Nuclear Magnetic <strong>Resonance</strong> <strong>Force</strong><br />
Microscope," J. Appl. Phys. 83, 6235 (1999).<br />
15. Z. Zhang, P. C. Hammel and P. E. Wigen , “Observation of <strong>Ferromagnetic</strong><br />
<strong>Resonance</strong> Using Magnetic <strong>Resonance</strong> <strong>Force</strong> <strong>Microscopy</strong>“, Appl. Phys. Lett.,<br />
68, 2005, (1996).<br />
16. D. Rugar, C. S. Yamoni and J. A. Sidles, “Mechanical Detection of Magnetic<br />
<strong>Resonance</strong>”, Nature, 360, 563 (1992).<br />
17. K. J. Bruland, J. Krzystek, J. L. Garbini, and J. A. Sidles , “Anharmonic<br />
modulation for noise reduction in magnetic resonance force microscopy”, Rev.<br />
Sci. Inst. 66, 2853 (1994).<br />
12/5/2005 31
18. Z. Zhang, M. L. Roukes and P. C. Hammel, “Sensitivity and Spatial Resolution<br />
for Electron-spin-resonance Detection by Magnetic <strong>Resonance</strong> <strong>Force</strong><br />
<strong>Microscopy</strong>”. J. Appl. Phys. 80, 6931 (1996).<br />
19. A. Suter, D. V. Pelekov, M. L. Roukes and P. C. Hammel, “Probe Sample<br />
Coupling in the Magnetic <strong>Resonance</strong> <strong>Force</strong> Microscope”, J. Magn. Reson. 154,<br />
210 (2002).<br />
20. P. C. Hammel, D. V. Pelekov, P. E. Wigen, T. R. Gosnell, M. M. Midzor and<br />
M. L. Roukes, “The Magnetic-resonance <strong>Force</strong> Microscope: A New Tool for<br />
High-resolution, 3-D, Subsurface Scanned Probe Imaging”, Proc. IEEE, 91, 789<br />
2003).<br />
21. O. Zuger and D. Rugar, ” First images from a magnetic resonance force<br />
microscope,” Appl. Phys. Lett., 63 2496 (1993).<br />
22. R. K. Pina, R. C. Puetter, “Bayesian Image Reconstruction: The Pixon Method<br />
and Optimal Image Modeling”, Publ. Astron. Soc. Pac.,105, 630 (1993).<br />
23. R. C. Puetter, “Pixon-based Multiresolution Image Reconstruction and the<br />
Quantification of Picture Information Content”, Int. J. Syst. Tech., 6, 314<br />
(1995).<br />
24. R. C. Ruetter and A. Yahil, “Astronomical Data Analysis Software and Systems<br />
VIII, D. M. Mehringer, R. L. Plante and D. A. Roberts, Eds., San Francisco,<br />
CA: Astron. Soc. Pacific Conf. Ser., 172, 307 (1999).<br />
25. M. M. Midzor, P. E. Wigen, D. Pelekhov, W. Chen, P. C. Hammel and M. L.<br />
Roukes, “Imaging Mechanisms of <strong>Force</strong> Detected FMR <strong>Microscopy</strong>”, J. Appl.<br />
Phys., 87, 6493 (2000).<br />
26. M. M. Midzor, <strong>Ferromagnetic</strong> <strong>Resonance</strong> <strong>Force</strong> <strong>Microscopy</strong>, PhD dissertation,<br />
California Institute of Technology, Pasadena, CA, 2000.<br />
27. R. Urban, A. Putilin, P. E. Wigen, M. Cross and M. L. Roukes, “Perturbation of<br />
the Magnetostatic Modes Observed by FMRFM” (In preparation).<br />
28. V. Charbois, V. V. Naletov, J. Ben Joussef and O. Klein, “Mechanical detection<br />
of ferromagnetic resonance spectrum in a normally magnetized yttrium-irongarnet<br />
disk”, J. Appl. Phys. 91, 7337 (2002).<br />
29. V. Charbois, V. V. Naletov, J. Ben Joussef and O. Klein, “Influence of the<br />
magnetic tip in ferromagnetic resonance force microscopy”, Appl. Phys. Lett.<br />
80, 4795 (2002).<br />
12/5/2005 32
30. V. V. Naletov, V. Charbois, O. Klein and C. Fermon, “Quantitative<br />
measurement of the ferromagnetic resonance signal by force detection”, Appl.<br />
Phys. Lett. 83, 3132 (2003).<br />
31. O. Klien, V. Charbois, V. V. Natelov and C. Fermon, “Measurement of the<br />
<strong>Ferromagnetic</strong> Relaxation in a Micron-size Sample”, Phys. Rev. B, Rap. Comm.<br />
67, 220407 (2003).<br />
32. V. V. Naletov, V. Charbois, O. Klein and C. Fermon, “Quantitative<br />
Measurementsd of the <strong>Ferromagnetic</strong> <strong>Resonance</strong> Signal by <strong>Force</strong> Detection”,<br />
Appl. Phys. Lett., 83, 3132 (2003).<br />
33. V. V. Naletov, G. deLoudens and O. Klein, “Magnetization Reduction Induced<br />
by Non-linear Effects”, Phys. Rev. Lett. (submitted).<br />
34. K. Wago, D. Botkin, C. S. Yannoni and D. Rugar, “Paramagnetic and<br />
<strong>Ferromagnetic</strong> <strong>Resonance</strong> Imaging with a Tip-on-cantilever magnetic <strong>Force</strong><br />
Microscope”, Appl. Phys. Lett. 72, 2757 (1998).<br />
35. J. F. Dillon, J. Appl. Physics, 31, 1605 (1960).<br />
36. R. C. LeCraw and E. G. Spencer, J. Phys. Soc. Japan, Suppl (B1), 17, 401<br />
(1962).<br />
37. H. Suhl, J. Phys. Chem. Solids, 1, 209 (1957)<br />
38. [R. W. Damon and J. R. Eshbach, “Magnetostatic Modes of a <strong>Ferromagnetic</strong><br />
Slab”, J. Phys. Chem. Solids, 19, 308 (1961).<br />
39. B. A. Kalinikos, “Excitation of Propagating Spin Waves in Ferromagneteic<br />
Films“, IEE Proc., 127 H, 4 (1980).<br />
40. Z. Zhang, P. C. Hammel, M. Midzor, M. L. Roukes and J. R. Childress,<br />
“<strong>Ferromagnetic</strong> resonance force microscopy on microscopic Co single layer<br />
films”, Appl. Phys. Lett. 73, 2036 (1998).<br />
41. B. J. Suh, P. C. Hammel, Z. Zhang, M. M. Midzor, M. L. Roakes and J. R<br />
Childress, “<strong>Ferromagnetic</strong> <strong>Resonance</strong> Imaging of Co Films Using Magnetic<br />
<strong>Resonance</strong> <strong>Force</strong> <strong>Microscopy</strong>”, J. Vac. Sci. Technol. B16, 2275 (1998).<br />
42. J. W. Feng, S.S. Kang, F. M Pan, G. J. Jin, A. Hu, S. S. Jiang and D. Feng,<br />
“Magnetic anisotropy and interlayer exchange coupling in the sputtered Co/Ag<br />
multilayers”, J. Appl. Phys. 78, 5549 (1995).<br />
43. F. J. A. Den Broeder, W. Having and P. J. H. Bloeman, “Magnetic Anisotropy<br />
of Multilayers”, J. Magn. Magn. Mats. 93, 562 (1994).<br />
12/5/2005 33
44. M. Sakurai, and T. Shinjo, “Interface Magnetic Properties of X/Co/Y Sandwich<br />
Films (X,Y = Pd, Au, Cu)”, J. Phys. Soc. Japan, 62, 1853 (1993).<br />
45. J. Moreland, P. Kabos, A. Jander, M. Lohndorf, R. M. McMichael and C-G Lee,<br />
“Micromechanical detectors for <strong>Ferromagnetic</strong> <strong>Resonance</strong> Spectroscopy”, Proc.<br />
SPIE 4176: Micromachined Devices and Components VI, Eric Peters and<br />
Oliver Paul, Eds., 84-95 (September 2000).<br />
46. M. Lohndorf, J. Moreland, P. Kabos and N. Rizzo, “Microcantilever Torque<br />
Magnetometery of Thin Magnetic Films”, J. Appl. Phys. 87, 5995 (2000).<br />
47. M. Lohndorf, J. Moreland and P. Kabos, “<strong>Ferromagnetic</strong> <strong>Resonance</strong> Detection<br />
with a Torsion-Mode Atomic-<strong>Force</strong> Microscope”, Appl. Phys. Lett., 76, 1176<br />
(2000).<br />
48. A. Jander, J. Moreland and P. Kabos, “Angular Momentum and Energy<br />
Transferred Through <strong>Ferromagnetic</strong> <strong>Resonance</strong>”, Appl. Phys. Lett., 78, 2348<br />
(2001).<br />
49. J. Moreland, M. Lohndorf, P. Kabos and R. D. McMichael, “<strong>Ferromagnetic</strong><br />
<strong>Resonance</strong> Spectroscopy with a Micromechanical Calorimeter Sensor”, Rev.<br />
Sci. Instr., 71, 3099 (2000).<br />
12/5/2005 34