J.Wang, A.K. Sood, P. Satyam, Y.Feng, X-Wu, Z.Cai, W ... - Physics
J.Wang, A.K. Sood, P. Satyam, Y.Feng, X-Wu, Z.Cai, W ... - Physics
J.Wang, A.K. Sood, P. Satyam, Y.Feng, X-Wu, Z.Cai, W ... - Physics

Create successful ePaper yourself
Turn your PDF publications into a flip-book with our unique Google optimized e-Paper software.
VOLUME 80, NUMBER 5 PHYSICAL REVIEW LETTERS 2FEBRUARY 1998<br />
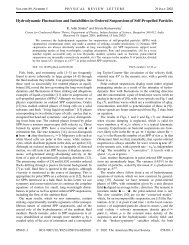
FIG. 2. The experimental (circles) and theoretical (line) fluorescence<br />
autocorrelation functions for samples 1 (A), 2 (B), and<br />
3 (C). The diffusion and sedimentation time constants (t d and<br />
t s , see text for the definitions) are also shown in the figure.<br />
Two theoretical simulations are also presented using only the<br />
sedimentation model [dashed line in (A)] or only the diffusion<br />
model [dash-dotted line in (C)].<br />
opposite limit t d ¿ t s , g f t 2 1 ~ exp2t 2 ts 2 <br />
with t s ~ R 22 s. The time constants obtained from the<br />
fits indicate that the diffusion of particles is the dominant<br />
dynamic process, observed by the XFCS measurement<br />
under the given experimental conditions, in samples 1 and<br />
2. When the particle size is larger, as in sample 3, the decay<br />
of the fluorescence autocorrelation function is mainly<br />
governed by the sedimentation time t s . Therefore, in<br />
this case, the XFCS measurement is more sensitive to the<br />
sedimentation than the diffusion of the particles. It should<br />
be noted that the translational diffusion and sedimentation<br />
processes have very distinct forms for the correlation<br />
function. The translational diffusion dominated correlation<br />
function decays approximately as t 21 and the<br />
sedimentation governed correlation function decays as<br />
exp2t 2 ts 2 . To illustrate this, fits to the correlation<br />
functions using only the sedimentation model [dashed line<br />
in Fig. 2(A)] or the diffusion model [dash-dotted line in<br />
Fig. 2(C)] are also included.<br />
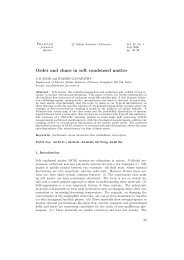
To demonstrate the effect of x-ray beam size on XFCS<br />
measurements, we also studied the ferrofluids (sample 4)<br />
at different locations along the zone plate axis and corresponding<br />
to different distances d from the focal point.<br />
Away from the focal point, the beam size s is directly<br />
proportional to d. Although iron is a relatively light atom,<br />
its x-ray fluorescence signal from the sample was sufficiently<br />
intense to penetrate through the solution and to be<br />
1112<br />
picked up by the detection system with adequate counting<br />
statistics. The correlation functions of iron fluorescence<br />
at and 12 mm away from the focal point are shown in<br />
Fig. 3(A) with theoretical fits according to Eq. (1). In the<br />
fitting procedure, t d , t s , and the intercept N 21 were all<br />
allowed to change as the fitting parameters. The theoretical<br />
fit to the correlation function reveals that the correlation<br />
function measured at the focal point is more sensitive to<br />
the diffusive motion of microspheres. On the other hand,<br />
the correlation functions measured far away from the focal<br />
point are more sensitive to the sedimentation. This is<br />
demonstrated more clearly in Fig. 3(B) where the fitting<br />
parameters t d and t s are plotted as a function of d. With<br />
excellent agreement with the theoretical predictions, t d is<br />
proportional to d 2 while t s is proportional to d when d<br />
is beyond about 4 mm (fits not shown). As d increases<br />
to about 5 mm, where t d .t s , the beam size becomes so<br />
large that the parameters related to diffusion may not be<br />
accurately measured. This indicates the necessity of using<br />
microsized x-ray beams in the measurement. The reliability<br />
of the fitting parameters is further verified by the fact<br />
that hydrodynamic radius R of the microspheres, derived<br />
from R ~t 225<br />
d ts<br />
15<br />
at each position [dots in Fig. 3(B)],<br />
is approximately constant, with a mean value of 0.71 mm<br />
[dashed line in Fig. 3(B)]. The measured R value was<br />
FIG. 3. Experimental results for sample 4 measured at different<br />
positions, on the zone plate axis, at a distance d to the<br />
focal point. (A) The experimental (circles and rectangles) and<br />
theoretical (line) fluorescence autocorrelation functions at and<br />
12 mm away from the focal point. (B) The fitting parameters<br />
t d (circles), t s (rectangles), and derived values of R (dots)<br />
at each position are shown. The solid lines connecting data<br />
points are for guiding the eye. The dashed line represents the<br />
mean value of R. The inset for (B) shows the relationship between<br />
g f 0 2 1 212 and d (dots) and the linear function fit<br />
(solid line).