J.Wang, A.K. Sood, P. Satyam, Y.Feng, X-Wu, Z.Cai, W ... - Physics
J.Wang, A.K. Sood, P. Satyam, Y.Feng, X-Wu, Z.Cai, W ... - Physics
J.Wang, A.K. Sood, P. Satyam, Y.Feng, X-Wu, Z.Cai, W ... - Physics

You also want an ePaper? Increase the reach of your titles
YUMPU automatically turns print PDFs into web optimized ePapers that Google loves.
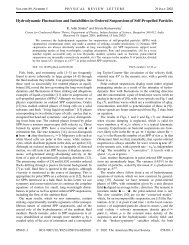
VOLUME 80, NUMBER 5 PHYSICAL REVIEW LETTERS 2FEBRUARY 1998<br />
where t d and t s are the translational diffusion and sedimentation<br />
time constants, respectively, t d seffD 2 t ,<br />
t s 2s eff y, s eff p s 2 1 Rg 2 3, translational diffusion<br />
constant D t k B T6phR, sedimentation velocity<br />
y 2DrgR 2 9h. Here, R is the hydrodynamic radius<br />
of the particle, h the viscosity of the solvent, k B<br />
the Boltzmann constant, T the temperature, Dr the<br />
density difference between the colloidal particles and<br />
water, and g the gravity acceleration. From Eq. (1),<br />
N g f 0 2 1 21 , and therefore, fluorescence correlation<br />
spectroscopy has been used in the visible spectral<br />
region to estimate the particle concentration [9].<br />
To demonstrate the usefulness of this method for elucidating<br />
particle dynamics, two types of samples were<br />
studied. First, colloidal gold particles, which have been<br />
studied by x-ray coherent intensity correlation spectroscopy<br />
[4], represented a good choice for the initial<br />
studies. Three colloidal gold samples of different particle<br />
sizes (denoted as samples 1 to 3) were studied to establish<br />
the relationship between particle dynamics and the particle<br />
size. Specifically, samples 1 and 2 were prepared<br />
using standard techniques [10] which yielded reasonably<br />
monodisperse colloidal particles of radii of approximately<br />
100 and 200 nm, respectively, as determined by atomic<br />
force microscopy (AFM) performed on the gold colloids<br />
deposited on silicon substrates. Sample 3 was prepared by<br />
adding pyridine to the gold colloid suspension to reduce<br />
the stabilizing surface charge on the colloidal particles<br />
[11] resulting in colloidal aggregates of radii less than<br />
900 nm, as measured by dynamic light scattering (DLS)<br />
and x-ray small angle scattering (XSAS). The dilute suspensions<br />
of gold particles had volume fractions ranging<br />
from 2 3 10 27 to 4 3 10 26 . The second type of sample,<br />
namely, a suspension of superparamagnetic microspheres<br />
(commonly referred to as ferrofluids, denoted as sample<br />
4) was utilized to show the effect of the x-ray beam size<br />
to the measurements. This sample, with particle diameter<br />
0.82 mm, as specified by the manufacturer (Bangs<br />
Laboratories, Inc., Fisher, IN), was diluted from 0.1 (as<br />
purchased) to 0.01 volume fraction with low conductivity<br />
deionized water.<br />
The samples were measured during two separate synchrotron<br />
runs on the 2-ID undulator beam line at the Advanced<br />
Photon Source. For the gold particle samples, the<br />
colloidal suspensions were loaded in a thin walled quartz<br />
capillary tube of diameter 0.6 mm and placed in the focal<br />
spot of a microfocused beam of 12.4 keV photons, as illustrated<br />
schematically in Fig. 1. The focusing zone plate<br />
has a focal length of 76.5 mm with an estimated total beam<br />
intensity of approximately 2 3 10 8 photonss at the focal<br />
point. The effective dimension of the illuminated volume<br />
was estimated to be approximately 1.9 3 10 3 mm 3 . The<br />
fluorescence intensity from the sample was monitored by<br />
an energy-dispersive solid state detector placed as close<br />
as possible to the sample to maximize the solid angle acceptance.<br />
Discriminated by a single-channel analyzer, the<br />
gold La fluorescence signal at about 9.7 keV was fed to a<br />
FIG. 1. Schematic of the experimental setup. The microfocused<br />
beam was obtained by first monochromating the beam<br />
from the undulator using a Si(111) double-crystal monochromator<br />
and then transmitting through a transmission Fresnel zone<br />
plate. A magnified view of sample is also sketched in the figure,<br />
where the shaded region outlines the x-ray illuminated area<br />
in the sample.<br />
correlator (ALV 5000) that displays both the fluorescence<br />
intensity, I f t, in real time and its normalized autocorrelation<br />
function, g f t. The autocorrelation functions being<br />
presented were obtained by averaging over 5 to 10 runs,<br />
each of 120 s duration. The measurements on the ferrofluids<br />
were carried out with a similar experiment setup. Iron<br />
Ka fluorescence lines at 6.4 keV were collected and the<br />
autocorrelation functions were measured with 1 to 2 runs,<br />
each of 600 s duration.<br />
Shown in Fig. 2 are the averaged g f t measured for<br />
Fig. 2(A) sample 1, Fig. 2(B) sample 2, and Fig. 2(C)<br />
sample 3. The full theoretical expression given in Eq. (1)<br />
fits extremely well to the data. In the fitting procedure, the<br />
gold colloids are assumed to be monodisperse. Because<br />
of the divergent nature of the focused beam and the<br />
finite size of the capillary tube along the beam direction<br />
(z direction), an exact measure of the beam size in the<br />
x-y direction was not possible at the focal point. An<br />
estimate of the beam size was obtained as follows: For<br />
the initial fit to the correlation functions taken at the focal<br />
point, s, R, and the intercept g f 0 2 1 were all allowed<br />
to vary as fitting parameters. The average value<br />
0.86 mm of s from different samples and different<br />
measurements was regarded as the measured beam size<br />
in the x-y direction. Subsequently, the correlation functions<br />
were fit with the remaining two parameters. The<br />
least-square-fitted values of the hydrodynamic radii of the<br />
particles are 102, 220, and 370 nm for samples 1, 2, and<br />
3, respectively, in good agreement with the AFM, DLS,<br />
and XSAS measurements. The particle sizes for samples<br />
1, 2, and 3 correspond to values of D t of 2.1, 0.97,<br />
and 0.53 mm 2 s and of y of 0.24, 1.1, and 3.2 mms,<br />
respectively. The corresponding time constants are<br />
listed in the figure. It can be seen that when t d ø t s<br />
(i.e., s eff R 3 ø 0.1 mm 4 for gold colloids in water),<br />
the decay of g f t is governed by the diffusion process,<br />
i.e., g f t 2 1 ~ 11 1 tt d with t d ~ Rs 2 . In the<br />
1111