J.Wang, A.K. Sood, P. Satyam, Y.Feng, X-Wu, Z.Cai, W ... - Physics
J.Wang, A.K. Sood, P. Satyam, Y.Feng, X-Wu, Z.Cai, W ... - Physics
J.Wang, A.K. Sood, P. Satyam, Y.Feng, X-Wu, Z.Cai, W ... - Physics

You also want an ePaper? Increase the reach of your titles
YUMPU automatically turns print PDFs into web optimized ePapers that Google loves.
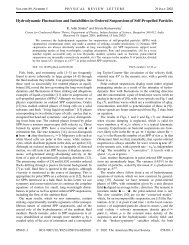
VOLUME 80, NUMBER 5 PHYSICAL REVIEW LETTERS 2FEBRUARY 1998<br />
X-Ray Fluorescence Correlation Spectroscopy: A Method for Studying Particle Dynamics<br />
in Condensed Matter<br />
Jin <strong>Wang</strong>, 1 Ajay K. <strong>Sood</strong>, 1, * Parlapalli V. <strong>Satyam</strong>, 1 Yiping <strong>Feng</strong>, 1 Xiao-zhong <strong>Wu</strong>, 2<br />
Zhonghou <strong>Cai</strong>, 1 Wenbing Yun, 1 and Sunil K. Sinha 1<br />
1 Experimental Facilities Division, Argonne National Laboratory, Argonne, Illinois 60439<br />
2 Department of <strong>Physics</strong>, Northern Illinois University, Dekalb, Illinois 60115<br />
and Materials Science Division, Argonne National Laboratory, Argonne, Illinois 60439<br />
(Received 1 October 1997)<br />
We have demonstrated that x-ray fluorescence correlation spectroscopy, in conjunction with<br />
microfocused synchrotron x-ray beams, can be used for elucidating particle dynamics. The dynamics of<br />
gold and ferromagnetic colloidal particles and aggregates undergoing both diffusion and sedimentation<br />
in water has been studied by measuring the time autocorrelation of the x-ray fluorescence intensity<br />
from a small illuminated volume. The dynamical parameters obtained are in excellent agreement with<br />
theoretical estimates and other measurements. Potential applications of the technique are discussed.<br />
[S0031-9007(97)05208-3]<br />
PACS numbers: 83.10.Pp, 05.40.+j, 07.85.Qe, 78.70.En<br />
Photon-correlation spectroscopy, probing fluctuations in<br />
scattered [1] or fluorescent [2,3] intensity to study particle<br />
dynamics in fluids, is well established in the visible light<br />
regime. With the advent of high-brilliance synchrotron<br />
radiation sources, correlation spectroscopy utilizing scattered<br />
radiation has only recently been extended to the x-<br />
ray wavelength regime by using spatially coherent x rays<br />
to study the time fluctuations of the corresponding speckle<br />
patterns [4–6]. Because x-ray fluorescence is an incoherent<br />
process, its intensity is simply proportional to the product<br />
of the number of fluorescent atoms in the x-ray beam<br />
and the x-ray exciting field intensity. Thus, x-ray fluorescence<br />
correlation spectroscopy (XFCS) does not require<br />
coherent x-ray beams. For an assembly of noninteracting<br />
particles undergoing diffusive motion, the fractional<br />
root-mean-square fluctuation in the number of particles in<br />
a given volume will be N 212 , where N is the average<br />
number of particles in the given volume. If N is<br />
sufficiently small, such number fluctuations can be studied<br />
in real time, by measuring the time dependence of the<br />
fluorescence intensity I f t and its normalized autocorrelation<br />
function g f t I f 0I f tI f 0 2 , thus yielding<br />
direct information about the particle dynamics. The small<br />
value of N can be realized with either a small illuminated<br />
sample volume, or a low particle concentration. This<br />
will necessitate a high x-ray beam intensity in order to get<br />
sufficient fluorescence signal from the small number of<br />
particles. With a Fresnel zone plate and third-generation<br />
synchrotron x-ray sources, such a high intensity microfocused<br />
x-ray beam is readily achievable [7]. A distinct advantage<br />
of the method is the element specificity by using<br />
an energy-dispersive x-ray detector. This method is particularly<br />
useful for studying both diffusive particle motion<br />
and flow in optically opaque systems for which methods<br />
employing visible light are not suited.<br />
The fluorescence intensity from a collection of randomly<br />
moving particles with instantaneous positions R i t<br />
is given by I f t c R drI 0 r P i dr 2 R i t, where<br />
I 0 r is the spatial variation of the incident beam intensity<br />
and c is the fluorescent yield per particle. After taking<br />
Fourier transforms of I 0 r, denoted by Ĩ 0 k, and expressing<br />
the fact that positions of different particles are uncorrelated,<br />
the autocorrelation function yields g f t 1 1<br />
1N R dkjĨ 0 kj 2 j fkj 2 Fk, tjĨ 0 0f0j 2 , where<br />
N is the number of colloidal particles, and Fk, t is the<br />
single particle autocorrelation function given by Fk, t <br />
expik ? R i 0 2 R i t and a form factor fk for<br />
the particles has also been introduced to account for<br />
their finite sizes and shapes. The noninteracting limit<br />
is generally applicable to many of the systems that the<br />
method is best suited for. For example, given a detectable<br />
autocorrelation function intercept of 10 23 (or N 10 3 ,<br />
the upper limit of the number of particles in the illuminated<br />
volume), we estimate that the volume fraction of the<br />
particles is below 0.03 for particles with diameter less than<br />
500 nm. For diffusive motion, Fk, t exp2k 2 D t t,<br />
with D t being the translational diffusion constant. For<br />
a uniform drift velocity v, on the other hand, Fk, t <br />
exp2ik ? vt. Finally, we take the form factor of<br />
I 0 r as exp2x 2 1 y 2 2s 2 exp2z 2 2sz 2 with the<br />
beam propagating along the z direction. The beam size<br />
along the z direction, s z , as dictated by the sample<br />
thickness, is much larger than the beam size s in the<br />
transverse x-y direction, and is taken to be essentially<br />
infinite for the purpose of the calculation. Therefore,<br />
the measurement is not sensitive to the diffusion in the z<br />
direction, and hence, probes particle motion only in the<br />
x and y directions. Carrying out the integrals explicitly,<br />
and setting the form factor fk exp2Rg 2k2 3 with<br />
R g being the radius of gyration [8], we arrive at the<br />
result [3]<br />
g f t 1 1 N 21 1 1 tt d 21<br />
3 exp2t 2 t 2 s 1 1 tt d , (1)<br />
1110 0031-90079880(5)1110(4)$15.00 © 1998 The American Physical Society
VOLUME 80, NUMBER 5 PHYSICAL REVIEW LETTERS 2FEBRUARY 1998<br />
where t d and t s are the translational diffusion and sedimentation<br />
time constants, respectively, t d seffD 2 t ,<br />
t s 2s eff y, s eff p s 2 1 Rg 2 3, translational diffusion<br />
constant D t k B T6phR, sedimentation velocity<br />
y 2DrgR 2 9h. Here, R is the hydrodynamic radius<br />
of the particle, h the viscosity of the solvent, k B<br />
the Boltzmann constant, T the temperature, Dr the<br />
density difference between the colloidal particles and<br />
water, and g the gravity acceleration. From Eq. (1),<br />
N g f 0 2 1 21 , and therefore, fluorescence correlation<br />
spectroscopy has been used in the visible spectral<br />
region to estimate the particle concentration [9].<br />
To demonstrate the usefulness of this method for elucidating<br />
particle dynamics, two types of samples were<br />
studied. First, colloidal gold particles, which have been<br />
studied by x-ray coherent intensity correlation spectroscopy<br />
[4], represented a good choice for the initial<br />
studies. Three colloidal gold samples of different particle<br />
sizes (denoted as samples 1 to 3) were studied to establish<br />
the relationship between particle dynamics and the particle<br />
size. Specifically, samples 1 and 2 were prepared<br />
using standard techniques [10] which yielded reasonably<br />
monodisperse colloidal particles of radii of approximately<br />
100 and 200 nm, respectively, as determined by atomic<br />
force microscopy (AFM) performed on the gold colloids<br />
deposited on silicon substrates. Sample 3 was prepared by<br />
adding pyridine to the gold colloid suspension to reduce<br />
the stabilizing surface charge on the colloidal particles<br />
[11] resulting in colloidal aggregates of radii less than<br />
900 nm, as measured by dynamic light scattering (DLS)<br />
and x-ray small angle scattering (XSAS). The dilute suspensions<br />
of gold particles had volume fractions ranging<br />
from 2 3 10 27 to 4 3 10 26 . The second type of sample,<br />
namely, a suspension of superparamagnetic microspheres<br />
(commonly referred to as ferrofluids, denoted as sample<br />
4) was utilized to show the effect of the x-ray beam size<br />
to the measurements. This sample, with particle diameter<br />
0.82 mm, as specified by the manufacturer (Bangs<br />
Laboratories, Inc., Fisher, IN), was diluted from 0.1 (as<br />
purchased) to 0.01 volume fraction with low conductivity<br />
deionized water.<br />
The samples were measured during two separate synchrotron<br />
runs on the 2-ID undulator beam line at the Advanced<br />
Photon Source. For the gold particle samples, the<br />
colloidal suspensions were loaded in a thin walled quartz<br />
capillary tube of diameter 0.6 mm and placed in the focal<br />
spot of a microfocused beam of 12.4 keV photons, as illustrated<br />
schematically in Fig. 1. The focusing zone plate<br />
has a focal length of 76.5 mm with an estimated total beam<br />
intensity of approximately 2 3 10 8 photonss at the focal<br />
point. The effective dimension of the illuminated volume<br />
was estimated to be approximately 1.9 3 10 3 mm 3 . The<br />
fluorescence intensity from the sample was monitored by<br />
an energy-dispersive solid state detector placed as close<br />
as possible to the sample to maximize the solid angle acceptance.<br />
Discriminated by a single-channel analyzer, the<br />
gold La fluorescence signal at about 9.7 keV was fed to a<br />
FIG. 1. Schematic of the experimental setup. The microfocused<br />
beam was obtained by first monochromating the beam<br />
from the undulator using a Si(111) double-crystal monochromator<br />
and then transmitting through a transmission Fresnel zone<br />
plate. A magnified view of sample is also sketched in the figure,<br />
where the shaded region outlines the x-ray illuminated area<br />
in the sample.<br />
correlator (ALV 5000) that displays both the fluorescence<br />
intensity, I f t, in real time and its normalized autocorrelation<br />
function, g f t. The autocorrelation functions being<br />
presented were obtained by averaging over 5 to 10 runs,<br />
each of 120 s duration. The measurements on the ferrofluids<br />
were carried out with a similar experiment setup. Iron<br />
Ka fluorescence lines at 6.4 keV were collected and the<br />
autocorrelation functions were measured with 1 to 2 runs,<br />
each of 600 s duration.<br />
Shown in Fig. 2 are the averaged g f t measured for<br />
Fig. 2(A) sample 1, Fig. 2(B) sample 2, and Fig. 2(C)<br />
sample 3. The full theoretical expression given in Eq. (1)<br />
fits extremely well to the data. In the fitting procedure, the<br />
gold colloids are assumed to be monodisperse. Because<br />
of the divergent nature of the focused beam and the<br />
finite size of the capillary tube along the beam direction<br />
(z direction), an exact measure of the beam size in the<br />
x-y direction was not possible at the focal point. An<br />
estimate of the beam size was obtained as follows: For<br />
the initial fit to the correlation functions taken at the focal<br />
point, s, R, and the intercept g f 0 2 1 were all allowed<br />
to vary as fitting parameters. The average value<br />
0.86 mm of s from different samples and different<br />
measurements was regarded as the measured beam size<br />
in the x-y direction. Subsequently, the correlation functions<br />
were fit with the remaining two parameters. The<br />
least-square-fitted values of the hydrodynamic radii of the<br />
particles are 102, 220, and 370 nm for samples 1, 2, and<br />
3, respectively, in good agreement with the AFM, DLS,<br />
and XSAS measurements. The particle sizes for samples<br />
1, 2, and 3 correspond to values of D t of 2.1, 0.97,<br />
and 0.53 mm 2 s and of y of 0.24, 1.1, and 3.2 mms,<br />
respectively. The corresponding time constants are<br />
listed in the figure. It can be seen that when t d ø t s<br />
(i.e., s eff R 3 ø 0.1 mm 4 for gold colloids in water),<br />
the decay of g f t is governed by the diffusion process,<br />
i.e., g f t 2 1 ~ 11 1 tt d with t d ~ Rs 2 . In the<br />
1111
VOLUME 80, NUMBER 5 PHYSICAL REVIEW LETTERS 2FEBRUARY 1998<br />
FIG. 2. The experimental (circles) and theoretical (line) fluorescence<br />
autocorrelation functions for samples 1 (A), 2 (B), and<br />
3 (C). The diffusion and sedimentation time constants (t d and<br />
t s , see text for the definitions) are also shown in the figure.<br />
Two theoretical simulations are also presented using only the<br />
sedimentation model [dashed line in (A)] or only the diffusion<br />
model [dash-dotted line in (C)].<br />
opposite limit t d ¿ t s , g f t 2 1 ~ exp2t 2 ts 2 <br />
with t s ~ R 22 s. The time constants obtained from the<br />
fits indicate that the diffusion of particles is the dominant<br />
dynamic process, observed by the XFCS measurement<br />
under the given experimental conditions, in samples 1 and<br />
2. When the particle size is larger, as in sample 3, the decay<br />
of the fluorescence autocorrelation function is mainly<br />
governed by the sedimentation time t s . Therefore, in<br />
this case, the XFCS measurement is more sensitive to the<br />
sedimentation than the diffusion of the particles. It should<br />
be noted that the translational diffusion and sedimentation<br />
processes have very distinct forms for the correlation<br />
function. The translational diffusion dominated correlation<br />
function decays approximately as t 21 and the<br />
sedimentation governed correlation function decays as<br />
exp2t 2 ts 2 . To illustrate this, fits to the correlation<br />
functions using only the sedimentation model [dashed line<br />
in Fig. 2(A)] or the diffusion model [dash-dotted line in<br />
Fig. 2(C)] are also included.<br />
To demonstrate the effect of x-ray beam size on XFCS<br />
measurements, we also studied the ferrofluids (sample 4)<br />
at different locations along the zone plate axis and corresponding<br />
to different distances d from the focal point.<br />
Away from the focal point, the beam size s is directly<br />
proportional to d. Although iron is a relatively light atom,<br />
its x-ray fluorescence signal from the sample was sufficiently<br />
intense to penetrate through the solution and to be<br />
1112<br />
picked up by the detection system with adequate counting<br />
statistics. The correlation functions of iron fluorescence<br />
at and 12 mm away from the focal point are shown in<br />
Fig. 3(A) with theoretical fits according to Eq. (1). In the<br />
fitting procedure, t d , t s , and the intercept N 21 were all<br />
allowed to change as the fitting parameters. The theoretical<br />
fit to the correlation function reveals that the correlation<br />
function measured at the focal point is more sensitive to<br />
the diffusive motion of microspheres. On the other hand,<br />
the correlation functions measured far away from the focal<br />
point are more sensitive to the sedimentation. This is<br />
demonstrated more clearly in Fig. 3(B) where the fitting<br />
parameters t d and t s are plotted as a function of d. With<br />
excellent agreement with the theoretical predictions, t d is<br />
proportional to d 2 while t s is proportional to d when d<br />
is beyond about 4 mm (fits not shown). As d increases<br />
to about 5 mm, where t d .t s , the beam size becomes so<br />
large that the parameters related to diffusion may not be<br />
accurately measured. This indicates the necessity of using<br />
microsized x-ray beams in the measurement. The reliability<br />
of the fitting parameters is further verified by the fact<br />
that hydrodynamic radius R of the microspheres, derived<br />
from R ~t 225<br />
d ts<br />
15<br />
at each position [dots in Fig. 3(B)],<br />
is approximately constant, with a mean value of 0.71 mm<br />
[dashed line in Fig. 3(B)]. The measured R value was<br />
FIG. 3. Experimental results for sample 4 measured at different<br />
positions, on the zone plate axis, at a distance d to the<br />
focal point. (A) The experimental (circles and rectangles) and<br />
theoretical (line) fluorescence autocorrelation functions at and<br />
12 mm away from the focal point. (B) The fitting parameters<br />
t d (circles), t s (rectangles), and derived values of R (dots)<br />
at each position are shown. The solid lines connecting data<br />
points are for guiding the eye. The dashed line represents the<br />
mean value of R. The inset for (B) shows the relationship between<br />
g f 0 2 1 212 and d (dots) and the linear function fit<br />
(solid line).
VOLUME 80, NUMBER 5 PHYSICAL REVIEW LETTERS 2FEBRUARY 1998<br />
almost twice as large as the value specified by the manufacturer.<br />
It was not possible to characterize the same system<br />
with our DLS experimental setup because at this concentration<br />
(0.01 volume fraction) the sample is opaque. Transmission<br />
electron microscopy (TEM) studies of deposited<br />
and evaporated film of the suspension did reveal the existence<br />
of a large number of larger particles with a significant<br />
degree of polydispersity, implying that the present fits,<br />
while agreeing well with the data, should be taken as yielding<br />
only average parameters for particle sizes. As shown<br />
in Eq. (1), the intercept of the correlation function should<br />
be proportional to N 21 . Thus, g f 0 2 1 212 , a value<br />
directly derived from one of the fitting parameters, g f 0<br />
should be proportional to the beam size s or, in turn, to d.<br />
This has been clearly observed in the experiment [shown<br />
as the inset for Fig. 3(B)]. It is worth mentioning here that<br />
g f 0 can be regarded as a model-independent fitting parameter<br />
and that the value of g f 0 is highly reliable.<br />
We have demonstrated a new and powerful technique<br />
to probe the dynamics of colloidal particles by real-time<br />
analysis of x-ray fluorescence intensity fluctuations. While<br />
the model for independent particles diffusion and sedimentation<br />
fits our data well for the present dilute colloidal<br />
systems, it would be obviously of interest to study deviations<br />
from the model as the concentration of particles is<br />
increased to show interaction effects. We estimate that<br />
samples with particle concentration up to 10 times higher<br />
than those being examined could still be studied with the<br />
technique, which will be the subject of future studies. Furthermore,<br />
with the attainment of the maximum achievable<br />
intensities in microfocused beams at current synchrotron<br />
sources and optimization of the solid angle subtended by<br />
the detector, the limits of the technique could be extendible<br />
to particles containing 10 5 fluorescent atoms. The element<br />
specificity and the high sensitivity of the x-ray fluorescence<br />
makes XFCS a particularly unique probe. Parenthetically,<br />
we also note that the concept of XFCS was independently<br />
proposed by Goulon et al. [12]. However, without the microfocused<br />
x-ray beams, such an idea had never been realized.<br />
Furthermore, coherent x rays, which are required for<br />
other x-ray photon correlation spectroscopy techniques, are<br />
not needed for this method. There have been one or two<br />
examples of the use of noncoherent x-ray beams to study<br />
slow dynamics of large particles. Wakabayashi [13] used<br />
the time-autocorrelation functions of the Bragg reflected<br />
intensity to study the rotational diffusion of the particles.<br />
One may also use a host of alternative x-ray focusing devices<br />
[14] for achieving a microfocused x-ray beam.<br />
We conclude with a listing of some of the novel possibilities<br />
opened up for study with this technique. These include<br />
the study of the motion of biological macromolecules<br />
containing heavy atoms on or across membranes; the study<br />
of interdiffusion of atoms at interfaces between two species<br />
of materials; the study of the sedimentation or flow of colloidal<br />
particles in fluids containing polymers or surfactants<br />
which, we note, is unobservable by coherent x-ray intensity<br />
correlation spectroscopy techniques; the study of glass<br />
transitions or phase separations in liquid using tracer particles<br />
of gold or other colloids to probe the dynamics, and<br />
the study of the diffusion of particles through gels and other<br />
porous media. An interesting variant would be the study<br />
of magnetic domain dynamics or domain wall motion using<br />
circularly polarized beams and the magnetic circular<br />
dichroism effect.<br />
We thank H. Zhao and A. Wong for their assistance and<br />
the entire 2-ID beam line staff at the Advanced Photon<br />
Source for their technical support. We also thank R. E.<br />
Cook for the TEM measurements. This work is supported<br />
by the U.S. Department of Energy, BES-Materials Science,<br />
under Contract No. W-31-109-ENG-38, and is partially<br />
supported by the State of Illinois under HECA.<br />
*On leave from Department of <strong>Physics</strong>, Indian Institute of<br />
Science, Bangalore 560012, India.<br />
[1] B. Chu, Laser Light Scattering: Basic Principles and<br />
Practice (Academic Press, Boston, 1991).<br />
[2] D. Magde, E. Elson, and W. W. Webb, Phys. Rev. Lett.<br />
29, 705 (1972).<br />
[3] B. J. Berne and R. Pecora, Dynamic Light Scattering:<br />
with Applications to Chemistry Biology, and <strong>Physics</strong> (John<br />
Wiley & Sons, New York, 1976).<br />
[4] S. B. Dierker, R. Pindak, R. M. Fleming, I. K. Robinson,<br />
and L. Berman, Phys. Rev. Lett. 75, 449 (1995).<br />
[5] S. Brauer, G. B. Stephenson, M. Sutton, R. Brüning,<br />
E. Dufresne, S. G. J. Mochrie, G. Grübel, J. Als-Nielsen,<br />
and D. L. Abernathy, Phys. Rev. Lett. 74, 2010 (1995).<br />
[6] S. G. J. Mochrie, A. M. Mayes, A. R. Sandy, M. Sutton,<br />
S. Brauer, G. B. Stephenson, D. L. Abernathy, and G. Grübel,<br />
Phys. Rev. Lett. 78, 1275 (1997).<br />
[7] A. A. Krasnoperova, J. Xiao, F. Cerrina, E. Di Fabrizio,<br />
L. Luciani, M. Figliomeni, M. Gentili, W. Yun, B. Lai,<br />
and E. Gluskin, J. Vac. Sci. Technol. B 11, 2588 (1993).<br />
[8] O. Glatter and O. Kratky, Small Angle X-Ray Scattering<br />
(Academic Press Inc., New York, 1982).<br />
[9] Z. Huang and N. L. Thomson, Biophys. J. 70, 2001 (1996).<br />
[10] G. Frens, Nature (London) 241, 19 (1973).<br />
[11] P. Dimon, S. K. Sinha, D. A. Weitz, C. R. Safinya, G. S.<br />
Smith, W. A. Varady, and H. M. Linsay, Phys. Rev. Lett.<br />
57, 595 (1986).<br />
[12] J. Goulon, C. Goulon, C. Gauthier, and H. Emerich, in<br />
Particle and Fields Series 49: Synchrotron Radiation and<br />
Dynamic Phenomena, edited by A. Beswick (American<br />
Institute of <strong>Physics</strong>, New York, 1991), pp. 420–427.<br />
[13] N. Wakabayashi (unpublished).<br />
[14] E. A. Stern, Z. Kalman, A. Lewis, and K. Lieberman,<br />
Appl. Opt. 27, 5135 (1988); D. H. Bilderback, S. A.<br />
Hoffman, and D. J. Thiel, Science 263, 201 (1994);<br />
A. Snigirev, V. Kohn, I. Snigireva, and B. Lengeler,<br />
Nature (London) 384, 49 (1996); J. <strong>Wang</strong>, M. J. Bedzyk,<br />
and M. Caffrey, Science 258, 775 (1992); Y. P. <strong>Feng</strong>, S. K.<br />
Sinha, H. W. Deckman, J. B. Hastings, and D. P. Siddons,<br />
Phys. Rev. Lett. 71, 537 (1993).<br />
1113