C. Usha Devi, R. S. Bharat Chandran, R. M. Vasu and A.K. ... - Physics
C. Usha Devi, R. S. Bharat Chandran, R. M. Vasu and A.K. ... - Physics
C. Usha Devi, R. S. Bharat Chandran, R. M. Vasu and A.K. ... - Physics

You also want an ePaper? Increase the reach of your titles
YUMPU automatically turns print PDFs into web optimized ePapers that Google loves.
<strong>Devi</strong> et al.: Mechanical property assessment of tissue-mimicking phantoms…<br />
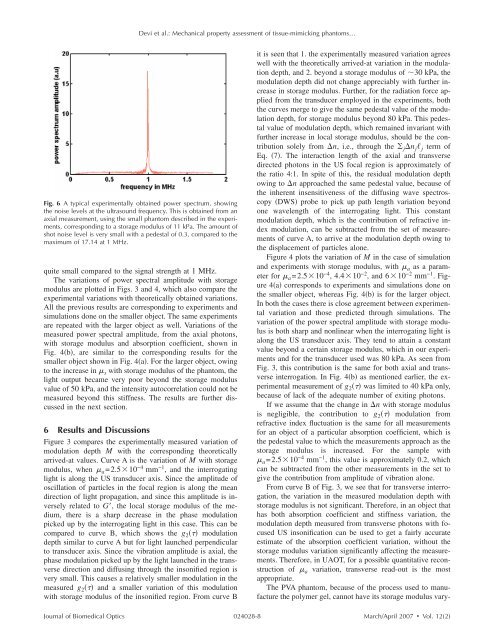
Fig. 6 A typical experimentally obtained power spectrum, showing<br />
the noise levels at the ultrasound frequency. This is obtained from an<br />
axial measurement, using the small phantom described in the experiments,<br />
corresponding to a storage modulus of 11 kPa. The amount of<br />
shot noise level is very small with a pedestal of 0.3, compared to the<br />
maximum of 17.14 at 1 MHz.<br />
quite small compared to the signal strength at 1 MHz.<br />
The variations of power spectral amplitude with storage<br />
modulus are plotted in Figs. 3 <strong>and</strong> 4, which also compare the<br />
experimental variations with theoretically obtained variations.<br />
All the previous results are corresponding to experiments <strong>and</strong><br />
simulations done on the smaller object. The same experiments<br />
are repeated with the larger object as well. Variations of the<br />
measured power spectral amplitude, from the axial photons,<br />
with storage modulus <strong>and</strong> absorption coefficient, shown in<br />
Fig. 4b, are similar to the corresponding results for the<br />
smaller object shown in Fig. 4a. For the larger object, owing<br />
to the increase in s with storage modulus of the phantom, the<br />
light output became very poor beyond the storage modulus<br />
value of 50 kPa, <strong>and</strong> the intensity autocorrelation could not be<br />
measured beyond this stiffness. The results are further discussed<br />
in the next section.<br />
6 Results <strong>and</strong> Discussions<br />
Figure 3 compares the experimentally measured variation of<br />
modulation depth M with the corresponding theoretically<br />
arrived-at values. Curve A is the variation of M with storage<br />
modulus, when a =2.510 −4 mm −1 , <strong>and</strong> the interrogating<br />
light is along the US transducer axis. Since the amplitude of<br />
oscillation of particles in the focal region is along the mean<br />
direction of light propagation, <strong>and</strong> since this amplitude is inversely<br />
related to G, the local storage modulus of the medium,<br />
there is a sharp decrease in the phase modulation<br />
picked up by the interrogating light in this case. This can be<br />
compared to curve B, which shows the g 2 modulation<br />
depth similar to curve A but for light launched perpendicular<br />
to transducer axis. Since the vibration amplitude is axial, the<br />
phase modulation picked up by the light launched in the transverse<br />
direction <strong>and</strong> diffusing through the insonified region is<br />
very small. This causes a relatively smaller modulation in the<br />
measured g 2 <strong>and</strong> a smaller variation of this modulation<br />
with storage modulus of the insonified region. From curve B<br />
it is seen that 1. the experimentally measured variation agrees<br />
well with the theoretically arrived-at variation in the modulation<br />
depth, <strong>and</strong> 2. beyond a storage modulus of 30 kPa, the<br />
modulation depth did not change appreciably with further increase<br />
in storage modulus. Further, for the radiation force applied<br />
from the transducer employed in the experiments, both<br />
the curves merge to give the same pedestal value of the modulation<br />
depth, for storage modulus beyond 80 kPa. This pedestal<br />
value of modulation depth, which remained invariant with<br />
further increase in local storage modulus, should be the contribution<br />
solely from n, i.e., through the j n j j term of<br />
Eq. 7. The interaction length of the axial <strong>and</strong> transverse<br />
directed photons in the US focal region is approximately of<br />
the ratio 4:1. In spite of this, the residual modulation depth<br />
owing to n approached the same pedestal value, because of<br />
the inherent insensitiveness of the diffusing wave spectroscopy<br />
DWS probe to pick up path length variation beyond<br />
one wavelength of the interrogating light. This constant<br />
modulation depth, which is the contribution of refractive index<br />
modulation, can be subtracted from the set of measurements<br />
of curve A, to arrive at the modulation depth owing to<br />
the displacement of particles alone.<br />
Figure 4 plots the variation of M in the case of simulation<br />
<strong>and</strong> experiments with storage modulus, with a as a parameter<br />
for a =2.510 −4 , 4.410 −2 , <strong>and</strong> 610 −2 mm −1 . Figure<br />
4a corresponds to experiments <strong>and</strong> simulations done on<br />
the smaller object, whereas Fig. 4b is for the larger object.<br />
In both the cases there is close agreement between experimental<br />
variation <strong>and</strong> those predicted through simulations. The<br />
variation of the power spectral amplitude with storage modulus<br />
is both sharp <strong>and</strong> nonlinear when the interrogating light is<br />
along the US transducer axis. They tend to attain a constant<br />
value beyond a certain storage modulus, which in our experiments<br />
<strong>and</strong> for the transducer used was 80 kPa. As seen from<br />
Fig. 3, this contribution is the same for both axial <strong>and</strong> transverse<br />
interrogation. In Fig. 4b as mentioned earlier, the experimental<br />
measurement of g 2 was limited to 40 kPa only,<br />
because of lack of the adequate number of exiting photons.<br />
If we assume that the change in n with storage modulus<br />
is negligible, the contribution to g 2 modulation from<br />
refractive index fluctuation is the same for all measurements<br />
for an object of a particular absorption coefficient, which is<br />
the pedestal value to which the measurements approach as the<br />
storage modulus is increased. For the sample with<br />
a =2.510 −4 mm −1 , this value is approximately 0.2, which<br />
can be subtracted from the other measurements in the set to<br />
give the contribution from amplitude of vibration alone.<br />
From curve B of Fig. 3, we see that for transverse interrogation,<br />
the variation in the measured modulation depth with<br />
storage modulus is not significant. Therefore, in an object that<br />
has both absorption coefficient <strong>and</strong> stiffness variation, the<br />
modulation depth measured from transverse photons with focused<br />
US insonification can be used to get a fairly accurate<br />
estimate of the absorption coefficient variation, without the<br />
storage modulus variation significantly affecting the measurements.<br />
Therefore, in UAOT, for a possible quantitative reconstruction<br />
of a variation, transverse read-out is the most<br />
appropriate.<br />
The PVA phantom, because of the process used to manufacture<br />
the polymer gel, cannot have its storage modulus vary-<br />
Journal of Biomedical Optics 024028-8<br />
March/April 2007 Vol. 122