C. Usha Devi, R. S. Bharat Chandran, R. M. Vasu and A.K. ... - Physics
C. Usha Devi, R. S. Bharat Chandran, R. M. Vasu and A.K. ... - Physics
C. Usha Devi, R. S. Bharat Chandran, R. M. Vasu and A.K. ... - Physics

Create successful ePaper yourself
Turn your PDF publications into a flip-book with our unique Google optimized e-Paper software.
<strong>Devi</strong> et al.: Mechanical property assessment of tissue-mimicking phantoms…<br />
forward elastography equation for the focal region. The US<br />
transducer input power is adjusted so that the force in regions<br />
outside the focal volume is small <strong>and</strong> hence also the resulting<br />
displacements. We estimate the perturbation in refractive index<br />
n j using n/p value for soft tissue <strong>and</strong> the pressure<br />
estimated in Sec. 2.<br />
To evaluate g 1 , we compute through MC simulations<br />
both the detected photon weights <strong>and</strong> the optical path traversed<br />
by the photon through the object. From g 1 , g 2 is<br />
estimated, again using the Siegert relation. The strength of the<br />
power spectrum is estimated by finding the area under the<br />
peak at 1 MHz of the Fourier transform of g 2 . The power<br />
spectral component is proportional to the depth of modulation<br />
in g 2 . Simulations are carried out launching photons along<br />
the US transducer axis <strong>and</strong> perpendicular to it Fig. 2, soas<br />
to intercept the focal region.<br />
The simulation results, which are discussed in Sec. 6, always<br />
showed a larger modulation depth in g 2 for light<br />
traversed along the axis than perpendicular to it. The reasons<br />
for this are as follows. 1. The component of amplitude of<br />
vibration which is along the transducer axis picked up by the<br />
axially launched photons are much larger compared to that<br />
picked up by the photons launched in the transverse direction.<br />
The result is that the phase modulation in the axial photons is<br />
contributed by n <strong>and</strong> a larger component of the vibration<br />
amplitude u. For the transverse photons, the contribution from<br />
u is smaller. 2. Photons launched along the axis had a four<br />
times larger length of interaction with the insonification region<br />
than those launched perpendicular to the axis. We show<br />
through both simulations <strong>and</strong> experiments that when the storage<br />
modulus of the object is increased, the modulation depth<br />
in g 2 measured from axial photons decreased rapidly,<br />
whereas the same measurements from the transverse photons<br />
showed smaller absolute modulation depth <strong>and</strong> range of variation<br />
see Fig. 3. As indicated in the Introduction <strong>and</strong> demonstrated<br />
in Fig. 3, when the storage modulus increased, the<br />
modulation depth in g 2 measured from transverse <strong>and</strong> axial<br />
light approached the same constant value. Since with increase<br />
in storage modulus the amplitude of vibration decreased, this<br />
fall-off of the detected modulation depth indicated the decreasing<br />
contribution of vibration amplitude of particles to the<br />
overall modulation of light. These results are further discussed<br />
in Sec. 6.<br />
In our theoretical simulations, we have used both the analytical<br />
expression arrived at on the basis of Eq. 12 22 <strong>and</strong> the<br />
MC simulation to estimate g 1 , <strong>and</strong> through it g 2 , <strong>and</strong> the<br />
power spectral component at the US frequency. The typical<br />
values for tissue optical properties used in the simulation are<br />
absorption coefficient=2.510 −4 mm −1 , 4.410 −2 mm −1 ,<br />
<strong>and</strong> 610 −2 mm −1 , scattering coefficient1.441 to<br />
4.5 mm −1 , anisotropy factor0.9, <strong>and</strong> refractive index1.34.<br />
The values of storage modulus are 11.4, 23.4, 43.7, 51.2, <strong>and</strong><br />
97.3 kPa. The average sound velocity in tissue is assumed to<br />
be 1545 m/sec. The simulations are repeated for photons<br />
launched along <strong>and</strong> perpendicular to the transducer directions.<br />
The results showing variation of modulation depth with<br />
optical <strong>and</strong> mechanical properties are shown in Fig. 4, which<br />
are further discussed in Sec. 6. We would like to mention that<br />
the modulation depths obtained through the theoretical expression<br />
for g 1 <strong>and</strong> MC simulation agreed with one another<br />
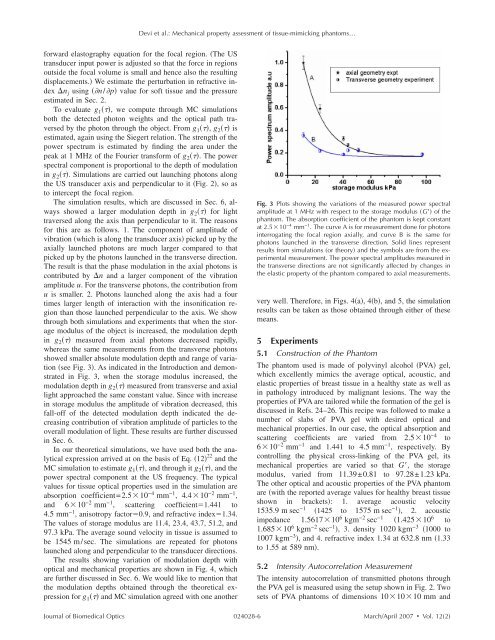
Fig. 3 Plots showing the variations of the measured power spectral<br />
amplitude at 1 MHz with respect to the storage modulus G of the<br />
phantom. The absorption coefficient of the phantom is kept constant<br />
at 2.510 −4 mm −1 . The curve A is for measurement done for photons<br />
interrogating the focal region axially, <strong>and</strong> curve B is the same for<br />
photons launched in the transverse direction. Solid lines represent<br />
results from simulations or theory <strong>and</strong> the symbols are from the experimental<br />
measurement. The power spectral amplitudes measured in<br />
the transverse directions are not significantly affected by changes in<br />
the elastic property of the phantom compared to axial measurements.<br />
very well. Therefore, in Figs. 4a, 4b, <strong>and</strong> 5, the simulation<br />
results can be taken as those obtained through either of these<br />
means.<br />
5 Experiments<br />
5.1 Construction of the Phantom<br />
The phantom used is made of polyvinyl alcohol PVA gel,<br />
which excellently mimics the average optical, acoustic, <strong>and</strong><br />
elastic properties of breast tissue in a healthy state as well as<br />
in pathology introduced by malignant lesions. The way the<br />
properties of PVA are tailored while the formation of the gel is<br />
discussed in Refs. 24–26. This recipe was followed to make a<br />
number of slabs of PVA gel with desired optical <strong>and</strong><br />
mechanical properties. In our case, the optical absorption <strong>and</strong><br />
scattering coefficients are varied from 2.510 −4 to<br />
610 −2 mm −1 <strong>and</strong> 1.441 to 4.5 mm −1 , respectively. By<br />
controlling the physical cross-linking of the PVA gel, its<br />
mechanical properties are varied so that G, the storage<br />
modulus, varied from 11.39±0.81 to 97.28±1.23 kPa.<br />
The other optical <strong>and</strong> acoustic properties of the PVA phantom<br />
are with the reported average values for healthy breast tissue<br />
shown in brackets: 1. average acoustic velocity<br />
1535.9 m sec −1 1425 to 1575 m sec −1 , 2. acoustic<br />
impedance 1.561710 6 kgm −2 sec −1 1.42510 6 to<br />
1.68510 6 kgm −2 sec −1 , 3. density 1020 kgm −3 1000 to<br />
1007 kgm −3 , <strong>and</strong> 4. refractive index 1.34 at 632.8 nm 1.33<br />
to 1.55 at 589 nm.<br />
5.2 Intensity Autocorrelation Measurement<br />
The intensity autocorrelation of transmitted photons through<br />
the PVA gel is measured using the setup shown in Fig. 2. Two<br />
sets of PVA phantoms of dimensions 101010 mm <strong>and</strong><br />
Journal of Biomedical Optics 024028-6<br />
March/April 2007 Vol. 122