Pulsed/CW Nuclear Magnetic Resonance Brochure - TeachSpin
Pulsed/CW Nuclear Magnetic Resonance Brochure - TeachSpin
Pulsed/CW Nuclear Magnetic Resonance Brochure - TeachSpin

Create successful ePaper yourself
Turn your PDF publications into a flip-book with our unique Google optimized e-Paper software.
PULSED/<strong>CW</strong> NUCLEAR MAGNETIC RESONANCE<br />
“The Second Generation of <strong>TeachSpin</strong>’s Classic”<br />
• Explore NMR for both Hydrogen (at 21 MHz) and Fluorine Nuclei<br />
• <strong>Magnetic</strong> Field Stabilized to 1 part in 2 million<br />
• Homogenize <strong>Magnetic</strong> Field with Electronic Shim Coils<br />
• Quadrature Phase-Sensitive Detection with 1° Phase Resolution<br />
• Direct Measurement of Spin-Spin and Spin-Lattice Relaxation Times<br />
• Carr-Purcell and Meiboom-Gill Pulse Sequences<br />
• Observe Chemical Shifts in both Hydrogen and Fluorine Liquids<br />
• Compare <strong>Pulsed</strong> and Continuous Wave NMR Detection<br />
• Study <strong>Pulsed</strong> and <strong>CW</strong> NMR in Solids<br />
• Built-in Lock-In Detection and <strong>Magnetic</strong> Field Sweeps<br />
Instruments Designed For Teaching
PULSED/<strong>CW</strong> NUCLEAR MAGNETIC RESONANCE<br />
INTRODUCTION<br />
<strong>Nuclear</strong> <strong>Magnetic</strong> <strong>Resonance</strong> has been an important research<br />
tool for physics, chemistry, biology, and medicine since its discovery<br />
simultaneously by E. Purcell and F. Bloch in 1946. In the<br />
1970’s, pulsed NMR became the dominant paradigm for reasons<br />
your students will discover using the apparatus described in this<br />
brochure, <strong>TeachSpin</strong>’s second generation of our classic PS1-A&B.<br />
This new unit was designed in response to requests for additional<br />
functions from some of the 200 users of our original unit. It has<br />
many new features and capabilities, yet it remains designed<br />
specifically for teaching. Its modular design and rugged construction,<br />
combined with sophisticated rock-stable electronics, allows<br />
students to take research-grade, publishable data on an instrument<br />
that they configure. Its outstanding reliability (backed by a two<br />
year warranty) and straightforward operation means that no<br />
“resident expert” is required to teach or maintain this apparatus.<br />
<strong>Pulsed</strong> NMR experiments provide a rich “intellectual phasespace”,<br />
bringing together important aspects of classical mechanics<br />
(torque, angular momentum, precession), quantum mechanics<br />
(time-dependent perturbation, stimulated emission, superposition<br />
of states), statistical mechanics (density matrix and relaxation),<br />
electricity and magnetism (Faraday’s law, Fourier transforms,<br />
and rf magnetic fields), and chemical physics (spin-exchange,<br />
paramagnetic impurities, and dipolar coupling). Students connect<br />
these concepts, studied in separate courses, as they analyze these<br />
experiments and their data.<br />
THE INSTRUMENT<br />
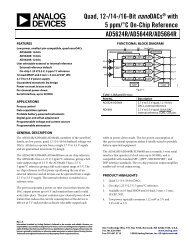
PS2-A is a completely redesigned spectrometer with state-ofthe-art<br />
digital and analog electronics. It consists of four major<br />
“components”: the permanent magnet, the rf sample probe inside it,<br />
the PS2 controller, and the mainframe. The 0.50 Tesla high-homogeneity<br />
permanent magnet is temperature stabilized so that its field<br />
is stable to 1 part in 2 million over 20 minutes. This makes it<br />
possible to do phase-sensitive detection and signal averaging in<br />
pulse experiments. The rf sample probe (residing in the magnet gap)<br />
is a single-coil, capacitively-tuned, 50-ohm, impedance-matched<br />
system with an attached set of four magnetic field-gradient coils<br />
(<br />
∂B z, ∂B z, ∂B z,<br />
∂ 2 B z ). The PS2 controller provides both the<br />
servomechanism for temperature regulation and four currentregulated<br />
supplies for the field gradient coils.<br />
The mainframe contains four independent modules, which are<br />
the heart of the spectrometer (Figure 1). The modular design<br />
enhances educational transparency. The low-noise, broadband,<br />
fast-recovery 21 MHz Receiver includes a λ/4 coaxial cable,<br />
protective fast-recovery diodes, a 20 dB directional coupler, as well<br />
as both envelope and quadrature phase-sensitive detectors. The<br />
receiver can be tuned for either hydrogen or fluorine NMR signals.<br />
The 21 MHz Digital Synthesizer produces rf power in both<br />
pulsed and cw formats. There is sufficient rf power to produce<br />
a π/2 pulse in about 2.5 microseconds. It also produces the<br />
reference signals (in 1° phase steps) for the quadrature detectors.<br />
The Pulse Programmer digitally creates the pulsed sequences of<br />
various pulse lengths, number of pulses, time between pulses, and<br />
repetition times. The Lock-In/Field Sweep provides a wide range<br />
of magnetic field sweeps, as well as a lock-in detection system for<br />
examining weak cw NMR signals from solids.<br />
The modules are configured by the students using the BNC<br />
cables supplied. Mistakes can be made in these interconnections<br />
yielding erroneous data, but without damaging the electronics.<br />
The high-power outputs connect through special reverse-gender<br />
BNC cables, which prevent their accidental connection to delicate<br />
electronic components. Setting the frequency to the Larmor<br />
precession frequency of the spins is done using the quadrature<br />
detectors. The rf sample probe must be tuned by the students for<br />
pulse measurements and retuned for the precise impedance-match<br />
needed for cw detection. This provides the students a good<br />
learning opportunity to understand AC circuits, especially the<br />
creation of a 50 ohm resistive impedance from essentially pure<br />
reactive components.<br />
EXPERIMENTS<br />
I. SINGLE PULSE<br />
A good way for students to begin their exploration of NMR is<br />
to start with “single pulse” experiments. These experiments<br />
require the student to find the NMR signal, tune the rf probe and<br />
the frequency of the spectrometer, set the single pulse parameters<br />
(pulse length and repetition time), and identify π/2, π, 3π/2,<br />
2π pulses.<br />
∂x ∂y ∂z ∂z 2 Fig. 2 Free Induction Decay (FID) of protons in mineral oil. Lower trace from<br />
envelope detector, Upper trace, Q-phase detector – slightly off resonance by 520 Hz
Figure 2 shows the free-induction decay (FID) signal following<br />
a single 90° pulse to the protons in a light mineral oil sample. The<br />
frequency synthesizer is used to tune the frequency of the<br />
rf pulse to match the Larmor Precession frequency of the protons.<br />
It can also be used to examine the magnetic field’s temporal<br />
stability with the temperature servo loop activated.<br />
Students can now easily familiarize themselves with the operation<br />
of the magnetic field gradient coils. Figure 3 shows the dramatic<br />
increase in the decay time of the FID of distilled water with<br />
proper adjustment of all four gradient coils. Since the decay time<br />
(T 2 *) is due to the inhomogeneity in the magnetic field over the<br />
sample, the longer the T 2 *, the better the field homogeneity. The<br />
upper trace is the FID with no currents in the gradient coils and the<br />
lower is with the field homogeneity optimized.<br />
Fig. 4 FID of Fluorinert FC-70. Upper trace phase detector, Lower trace<br />
envelope detector<br />
Note the multiple peaks indicating at least two (possibly five)<br />
inequivalent fluorine sites. The addition of the field gradient coils<br />
makes it possible to observe signals from inequivalent nuclear<br />
spins in both fluorine and hydrogen liquids. We have measured<br />
these chemical shifts in ethyl alcohol and toluene (see Fig. 12).<br />
Fig. 3 FID of distilled water. Upper trace magnet without gradient field,<br />
lower trace gradients optimized<br />
Next, the student might search for FID signals from one of the<br />
fluorine liquids provided. This requires reducing the synthesizer<br />
frequency approximately 6%, switching bands on the receiver, and<br />
retuning the rf sample probe. The FID signals from Fluorinert<br />
FC-70 are shown in Figure 4.<br />
The FID signal can also be recorded in frequency space by<br />
taking the FFT (Fast Fourier Transform) of the phase detector<br />
signal. Figure 5 shows this data with a vertical logarithmic scale of<br />
10 dB/division.<br />
Fig. 5 FFT of the FID of Fluorinert FC-70. Vertical scale 10 dB/div,<br />
Horizontal scale 500 Hz/div<br />
Fig. 1 The “Mainframe” with its four modules
Fig. 6 – Block Diagram PS2-A<br />
II. CONTINUOUS WAVE (<strong>CW</strong>)<br />
Although <strong>CW</strong> techniques inaugurated the field of magnetic<br />
resonance and remained the method of choice as a research tool<br />
for about 25 years, pulsed NMR now completely dominates<br />
nuclear magnetic spectroscopy. However, <strong>TeachSpin</strong> believes it is<br />
important for students to carry out a few <strong>CW</strong> experiments so they<br />
can compare these two methods and understand the advantages<br />
that pulsed techniques provide.<br />
The spectrometer must be reconfigured for <strong>CW</strong> experiments.<br />
In this new configuration the 20 dB directional coupler plays a<br />
crucial role, since the continuous rf power is directed to the sample<br />
coil via this coupler (see Fig. 6). Critical to the success of these<br />
experiments is the matching of the rf sample coil to the 50 ohm<br />
line. This is done using the two quadrature phase-sensitive detectors<br />
as a reflection bridge. When the probe is “perfectly” matched,<br />
there is no reflected power to the low-noise amplifier (LNA).<br />
The lock-in module provides magnetic field sweeps whose<br />
magnitude and sweep time can be chosen by the experimenter.<br />
It also provides an analog output voltage proportional to the<br />
sweep field. Thus, using a digital ’scope in x-y mode, where<br />
x is proportional to the magnetic sweep field and y is the output<br />
of one of the phase detectors, one can observe the change<br />
in bridge balance as the magnetic field is swept through the<br />
resonant conditions. Figure 7 shows the signals for fluorine in<br />
FC-70 (where no attempt has been made to separate the real<br />
and imaginary part of the nuclear susceptibility using the<br />
phase shifter).<br />
II. CONTINUOUS WAVE (<strong>CW</strong>)<br />
However, the magnetic field splittings observed in the<br />
<strong>CW</strong> spectrum can now be compared to the frequency splitting<br />
detected in the FFT spectrum of the free-induction decay (Fig. 5).<br />
Broad lines from solids can be examined using 20 Hz field modulation<br />
and lock-in detection. After performing both experiments,<br />
it should become clear to the students why modern spectrometers<br />
all use Fourier analysis of the FID signal.<br />
III. MEASURING T 1 SPIN-LATTICE RELAXATION<br />
The spin-lattice relaxation time T 1 is the characteristic time<br />
for a spin system to return to its thermal equilibrium magnetization<br />
after the magnetization has been driven away from<br />
equilibrium by some external perturbation. This time constant<br />
can be measured using several different techniques. These<br />
include saturation-recovery, zero-crossing of the magnetization<br />
inversion following a 180° pulse, or a least-squares fit to<br />
the entire recovery signal after magnetization inversion.<br />
Figure 8 shows the superposition of 23 experiments of<br />
π - delay - π/2 pulse sequence. The π-pulse inverts the<br />
magnetization and the π/2 pulse rotates the magnetization into<br />
the transverse plane. This figure shows 23 FID signals from<br />
the phase sensitive detector as a function of delay time for a<br />
light mineral oil sample.<br />
Fig. 8 Superposition of 23 experiments in a T 1 measurement<br />
(π - delay - π/2 sequence)<br />
Fig. 7 <strong>CW</strong> <strong>Resonance</strong> of FC-70. The Horizontal scale is 62.5 μT/div
The Bloch differential equation that describes the nuclear<br />
magnetization M z (t) returning to its thermal equilibrium value<br />
M 0 is given by<br />
∂M z M 0 – M z (t)<br />
= , (1)<br />
∂t T 1<br />
whose solution, for the initial condition of magnetization<br />
inversion, can be written as<br />
Ln(M 0 – M z (t)) = Ln2M 0<br />
t<br />
– .<br />
(2)<br />
T 1<br />
A plot of equation (2) on a semilog graph yields a straight<br />
line whose slope can be used to extract T 1 . Such a plot is<br />
shown in Figure 9.<br />
3.0<br />
ln{M 0<br />
-M z<br />
(t)}<br />
2.5<br />
2.0<br />
1.5<br />
1.0<br />
0.5<br />
0.0<br />
Y =3.151-0.39883 X<br />
T 1<br />
= 2.50 seconds<br />
0 1 2 3 4 5<br />
time (sec)<br />
Fig. 10 Two-Pulse spin-echo measurement of T 2 in light mineral oil<br />
The Carr-Purcell pulse sequence, π/2-delay-π-delay-πetc.,<br />
can be generated to measure T 2 in a “single shot”.<br />
However, accumulated errors in the amplitude of the π pulses<br />
limit the use of this one-shot method to a few π pulses. The<br />
Meiboom-Gill sequence, π/2-delay-90° phase shift-π-delayπ-etc.<br />
eliminates the error accumulation in the π pulses.<br />
Figure 11 shows such a measurement of T 2 for the same<br />
mineral oil sample.<br />
Fig. 9 Plot of Equation (2) to extract T 1 for distilled water<br />
IV. MEASURING T 2 SPIN-SPIN RELAXATION<br />
The time characteristic of the decay of the transverse<br />
nuclear magnetization, after it has been created by a π/2 pulse,<br />
is called the spin-spin relaxation time, T 2 . It can be measured<br />
in several ways. If the magnet has sufficient field homogeneity,<br />
the decay of the FID signal gives T 2 directly. Such is the<br />
case for many solids, including Teflon, as shown in Figure 13.<br />
But in most liquids, T 2 is so long that the inhomogeneity of the<br />
magnetic field over the sample causes the FID to decay in a<br />
time called T 2 *, shorter than the real T 2 .<br />
The genius of Hahn’s pulse techniques is that the magnet<br />
homogeneity no longer limits the measurement of T 2 . Using a<br />
two-pulse sequence, π /2-delay-π, the π pulse creates a<br />
spin-echo, rephasing the magnetization that has been<br />
dephased by the field inhomogeneities. Figure 10 shows such<br />
a two-pulse sequence for light mineral oil.<br />
The π/2 and π pulses are not fully visible in the figure<br />
because they are so short, with durations 2.5 and 5.0<br />
microseconds respectively, but the FID and spin echo are<br />
clearly visible with a signal to noise ratio of about 100:1.<br />
Fig. 11 Meiboom-Gill pulse sequence, T 2 measurement of light mineral oil<br />
V. CHEMICAL SHIFTS OF PROTONS<br />
Chemical shifts of protons, measured by the modern highfield,<br />
high-resolution commercial spectrometer, are the “bread<br />
and butter” of chemists’ application of NMR. Although this<br />
teaching apparatus cannot produce the resolution of such an<br />
instrument, it can achieve splittings that are clearly observable<br />
and measurable. Figure 12 shows the FFT of toluene,<br />
(125 Hz/div x .8 div = 100Hz splitting out of 21.2 MHz or<br />
about 4.7 ppm) The agreement with published data is<br />
excellent. With the PS2-A, students can also determine the<br />
absolute direction of the shift relative to a proton standard.
SPECIFICATIONS<br />
Fig. 12 FFT showing resolved chemical shifts for protons in Toluene<br />
VI. OTHER EXPERIMENTS<br />
Because PS2-A was designed for short recovery times (15 μs )<br />
the unit is also capable of observing <strong>Pulsed</strong> NMR in solids.<br />
Figure 13 shows the FID of fluorine in Teflon.<br />
Fig. 13 FID for fluorine nuclei in solid Teflon<br />
Students can examine the effect of paramagnetic ion concentration<br />
on relaxation times for a variety of solutes. Because the sample<br />
vials cost only a few cents, it is also practical to perform “irreversible”<br />
experiments where the vial cannot be reused. This<br />
includes measurement of T 1 and T 2 during slow chemical reactions,<br />
such as epoxy curing and concrete hardening. Here is an<br />
apparatus whose possibilities are limited only by the imagination<br />
of the user. It is the ideal instrument for senior projects.<br />
TEACHSPIN, INC.<br />
2495 Main Street, Suite 409,<br />
Buffalo NY 14214-2153<br />
Phone/Fax 716-885-4701<br />
www.teachspin.com