Course Syllabus
Course Syllabus
Course Syllabus

Create successful ePaper yourself
Turn your PDF publications into a flip-book with our unique Google optimized e-Paper software.
1/10/13 List<br />
General <strong>Course</strong> Information<br />
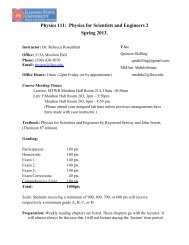
Physics 270 Spring 2013<br />
Instructor: Dr. David T. Marx<br />
Office: 312F Moulton Hall Phone: 438 – 5382 e-mail: marx@phy.ilstu.edu<br />
Lecture: Moulton 309 Tuesdays 2:00 - 3:50 PM<br />
Lab: Section 2 Thursdays 2:00 - 4:50 PM<br />
Section 3 Thursdays 9:00 - 11:50 AM<br />
Learning Goals<br />
The purpose of this course is to train you to be a professional scientist. The<br />
specific things for you to learn are:<br />
• careful planning and execution of experiments<br />
• creative approaches to examining physical phenomena<br />
• understanding the capability and limitations of a variety of scientific instruments<br />
• data acquisition and analysis using computers<br />
• error analysis and statistical analysis of data<br />
• journal-quality scientific reporting<br />
Required Items<br />
Notebooks:<br />
Students must maintain a lab notebook with the pages numbered consecutively. Lab notebooks will<br />
be collected and graded twice during the semester..<br />
Class notes should be taken and kept in a separate notebook.<br />
Textbook:<br />
Probability and Statistics for Engineers and Scientists, 4th edition<br />
(ISBN 9781111827045)<br />
by Anthony Hayter<br />
https://reggienet.illinoisstate.edu/xsl-portal/tool/4a109edf -2bba-4e8d-a79e-7c3ad5456f 32/printFriendly<br />
1/5
1/10/13 List<br />
Attendance<br />
Time in this course is expected to strongly affect your growth as a professional physicist. Therefore,<br />
attending both lecture and lab sessions is incredibly important. If you must be absent, please<br />
contact Dr. Marx for information on what you missed and be sure to get all information from your<br />
group.<br />
Homework<br />
Learning the material in this course requires you to practice it. For homework assignments that<br />
involve calculations, you are expected to submit well organized solutions that show all equations<br />
used, mathematical manipulations, and proper units. If you write a computer program or a<br />
Mathematica workbook, you are to submit a copy to your instructor when you turn in your<br />
assignment.<br />
Working in Groups<br />
Students will work in small, assigned groups. The assignments and schedule will be given to<br />
students during the first or second week of class.<br />
Each student is responsible for his/her own work. The data collected by each group will be shared,<br />
but each student must prepare a unique report, including original graphs produced separately by<br />
each student for their report. Anyone copying work from someone else may receive a zero for the<br />
report or be asked to submit a new report.<br />
No late reports will be accepted without prior approval from Dr. Marx.<br />
Lab Report Requirements and Grading<br />
Preparation<br />
Students must read the experiment description (see Resources & Materials) and be knowledgeable with<br />
respect to any assigned readings before coming to class to begin the experiment. You may also want to read<br />
about the physics behind these experiments by consulting various other textbooks and online resources.<br />
Record Keeping<br />
All students must have a lab notebook in which all notes and experimental data, including graphs and tables,<br />
will be kept. A notebook that has both vertical and horizontal lines (like graph paper) is preferred, but not<br />
required. A loose-leaf notebook is unacceptable. This notebook should be kept such that anyone could open it<br />
and understand what is written there. The notebook will be used to prepare your final report for each<br />
experiment. The best way to produce a good final report is to have everything you need readily available in your<br />
lab notebook. The notebook should contain the original data, analyses that support the results, uncertainties,<br />
tables, figures, and calculations. Work done in spreadsheets and/or plotting/fitting programs should be<br />
documented with descriptions of the calculations performed. Any circuit diagrams should be those actually used in<br />
the experiment. The notebooks will be graded after the first experiment and at the end of the semester.<br />
The notebook is not a place to scribble or doodle. It should be professional looking.<br />
https://reggienet.illinoisstate.edu/xsl-portal/tool/4a109edf -2bba-4e8d-a79e-7c3ad5456f 32/printFriendly<br />
2/5
1/10/13 List<br />
The pages of the notebook should be consecutively numbered. Use page 1 for a table of contents, writing the<br />
name of the experiment and the page number on which it begins. All information should be written in ink. No<br />
pages should be removed at any time. Indicate mistakes with a single line through the incorrect material. Any<br />
additions, such as graphs, data sets, etc. should be taped in, so that they will be a permanent addition to the<br />
notebook.<br />
On the first page for each experiment, indicate the date and the names of persons involved in the experiment.<br />
On subsequent days, indicate the date before proceeding to write new information.<br />
When making notes on measurements, properly label the measurement and record numbers with the correct<br />
number of significant digits and correct units. Define quantities before they are used. When using equations,<br />
perform all algebraic manipulations before inserting the values of the parameters.<br />
Tables should present the data in logical order. If you get a printout from Excel or other program, the cells<br />
should be formatted to give the proper precision of the measurements (for example, 1.500 should not be tabulated<br />
as 1.5 and 2.97 should not show up as 2.69581043). Numbers written in scientific notation should be in the<br />
proper format. Example: 1.23 mm = 1.23 ´ 10 -3 m. Note: the real multiplication sign and a real minus sign<br />
must be used. Both of these symbols are available in Word using the Symbol palette. Do not use the equation<br />
editor to insert scientific notation. All equations should be rendered using the equation editor. If you need<br />
assistance on this or any other functionality of Word or Excel, ask Dr. Marx.<br />
Final Reports<br />
For each experiment, there will be a final report that follows the kind of format you might find in manuscripts<br />
submitted to a peer-reviewed physics journal. The reports must be prepared using a word processor capable of<br />
creating quality scientific equations (such as the equation editor in MS Word). Reports should be single-spaced.<br />
The sentences should be grammatically correct and spelling should be checked. The format should be that<br />
specified in the American Institute for Physics Style Manual at<br />
http://www.aip.org/pubservs/style/4thed/toc.html<br />
The title should match that of the experiment performed and the list of the persons that performed it should be<br />
indicated. Your name should appear first on that list as writer of the report.<br />
The text should contain an Abstract, a paragraph that gives a short description of the experiment, the reasons<br />
for performing it, a short description of the results, and a short conclusion.<br />
The next part of the report is the Theory or Introduction section. The lab description in this manual has a<br />
detailed theory section. You do not need to reproduce this, but simply put in enough of a description of the theory<br />
behind the experiment that anyone reading your report will have a sufficient theoretical basis for understanding the<br />
experiment. All equations should be centered on the line and written using the equation editor in MS<br />
Word. If you use an equation number, the number is placed in parentheses and is justified to the right<br />
margin.<br />
The next part of the report will be a description of the Experimental Procedures and the equipment used.<br />
Again, since the lab description has this in detail, simply describe the equipment, include any wiring diagrams.<br />
Also, include any important information that is assumed in the experiment. When including drawings of the<br />
apparatus or circuit diagrams, these can be hand drawn. Do not write this section like a cookbook as to the<br />
procedures to follow or were followed. Remember: You are telling a story about the experiment, not<br />
telling someone step by step what to do.<br />
If the procedure calls for simple measurements, give the results in this section when you are describing the<br />
procedure. For example, if the procedure calls for making a length measurement, give the result along with the<br />
uncertainty. Describe fully how the measurement was made and determined.<br />
https://reggienet.illinoisstate.edu/xsl-portal/tool/4a109edf -2bba-4e8d-a79e-7c3ad5456f 32/printFriendly<br />
3/5
1/10/13 List<br />
For figures, include a figure number and a description of the figure (figure caption) above the figure. Use<br />
italicized font for the figure number and description. My preference is that the figure description be in complete<br />
sentences that describe the important features of the figure. There should be at least one blank line above and<br />
below the figure.<br />
The next section is Results and Discussion. Here, you present the results and analysis of your experiment in<br />
a logical manner. It is important to tell a story about the results. Do not start this section with a figure or tables,<br />
rather use text to describe the results found in figures and tables. If possible, the described figure or table should<br />
immediately follow the paragraph in which it is described.<br />
You should also present any discussion of uncertainties, error analysis, experimental limitations, etc. When<br />
estimating random and systematic errors, explain the process by which you arrived at your conclusions. When<br />
appropriate, compare your results with expected values and discuss any differences. When describing differences<br />
between experimental and expected values, it isn’t good enough to just say “The error was large and probably<br />
due to human error.” I expect a much more careful analysis of the source of errors and how one might reduce<br />
them. Practice using the data handling techniques given below in the data handling section. Any discussion of<br />
error should be quantitative with values that are supported by observations, measurements, and/or<br />
calculations.<br />
Graphs/plots should have labeled axes with proper units and have a legend. You should include the figure<br />
description information as described above, along with the figure number. Errors bars should be included when<br />
available. Justify your choice of plot or curve fitting (for example, “As shown in Equation 4, the voltage V is<br />
expected to decay exponentially with time. Therefore, the data is plotted as log V versus time t to obtain a straight<br />
line.”). If a curve fit has been used, include the fitting function on the graph along with any parameters and their<br />
associated uncertainties. In your final report, discuss the quality of the fit to the experimental data. If you do use a<br />
fitting function, explain why that particular function was used. Unless there is a reason to perform some type of<br />
fitting, simply plot the data points with error bars, if appropriate. Graphs must be made in an appropriate scientific<br />
graphing program. Graphs made in Microsoft Excel are unacceptable.<br />
Next, you will write your Conclusions. In this section, reiterate the purposes of the experiment, summarize<br />
the results and discussion, and make recommendations for improvements that may be made to the experimental<br />
procedure or apparatus, whenever possible.<br />
References - any book, article, or website that is quoted or from which information has been extracted, must<br />
be indicated in a references section. Please use the standard methods for references indicated in the AIP style<br />
manual.<br />
Questions - Be sure that any questions in the lab description have been answered either within the text of<br />
your report or in a separate section after the references section.<br />
Reports must be your own work. The text should be your own words. Members within a group may not<br />
share graphs and data tables. All text and drawings must be the work of the author. Plagiarism will not be<br />
tolerated. See these websites for information on this important topic.<br />
Language<br />
http://owl.english.purdue.edu/owl/resource/589/01/<br />
http://english.illinoisstate.edu/rlbroad/archive/teaching/plagiarism.htm<br />
Traditionally, scientific writing uses the past tense and a passive voice to describe experimental activity. I<br />
prefer that you use that style. Therefore, avoid using first person words, such as “I,” “my,” “me,” “our,” and<br />
“we.” There are some exceptions to this, but try to maintain formal usage of English as much as possible. See the<br />
https://reggienet.illinoisstate.edu/xsl-portal/tool/4a109edf -2bba-4e8d-a79e-7c3ad5456f 32/printFriendly
1/10/13 List<br />
discussion of this in the AIP Manual. Also, because the audience for published literature is international, the<br />
writing should be formal, use proper technical terms, and avoid slang. Sentences should be constructed so that<br />
they will not have multiple meanings – simplicity is best.<br />
Proofread your report before turning it in. If possible, ask someone else to proofread it as well. You<br />
might even try reading it out loud, because it’s a good way to spot problems because you’ll know when something<br />
doesn’t sound right.<br />
Lab Safety<br />
Laboratory safety depends primarily on everyone exercising both caution and common sense to the hazards<br />
that exist. Cell phones should be turned off during lab periods. See the class website for specific safety<br />
information.<br />
Lab Equipment<br />
Laboratory equipment is often difficult to replace or repair. Please exercise care and caution when making<br />
electrical connections, adjusting voltages and currents, handling optical components, etc. Any equipment<br />
failures/breakages should be reported immediately, so the matter can be fixed as soon as possible.<br />
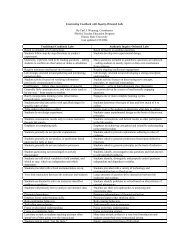
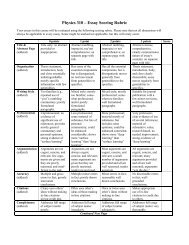
Lab Report Grading<br />
To encourage students to follow journal quality lab report writing and reporting, the following rubric has been<br />
devised to evaluate your lab reports. The rubric is set up on an 85 point scale. You may receive up to 15<br />
additional points for showing enthusiasm for the subject matter by using a creative means of analysis, correct<br />
additional analyses, or performed additional experimentation beyond that indicated in the lab manual.<br />
The rubric is at the following URL:<br />
http://www.phy.ilstu.edu/~marx/ph270/Report_Rubric.pdf<br />
Grading<br />
Grading Components:<br />
Grading Scale (subject to change):<br />
Homework 20 % 85 – 100 A<br />
Tests 20 % 75 – 84 B<br />
Lab Reports 40 % 65 – 74 C<br />
Lab Notebooks 5 % 55 – 64 D<br />
Final Exam 15 % < 55 F<br />
https://reggienet.illinoisstate.edu/xsl-portal/tool/4a109edf -2bba-4e8d-a79e-7c3ad5456f 32/printFriendly<br />
5/5