Phonon-mediated superconducting transitions in layered cuprate ...
Phonon-mediated superconducting transitions in layered cuprate ...
Phonon-mediated superconducting transitions in layered cuprate ...

You also want an ePaper? Increase the reach of your titles
YUMPU automatically turns print PDFs into web optimized ePapers that Google loves.
CHEN et al.<br />
PHYSICAL REVIEW B 75, 134504 2007<br />
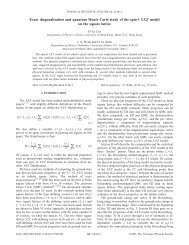
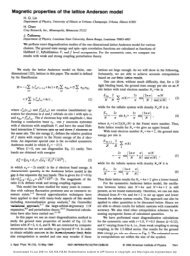
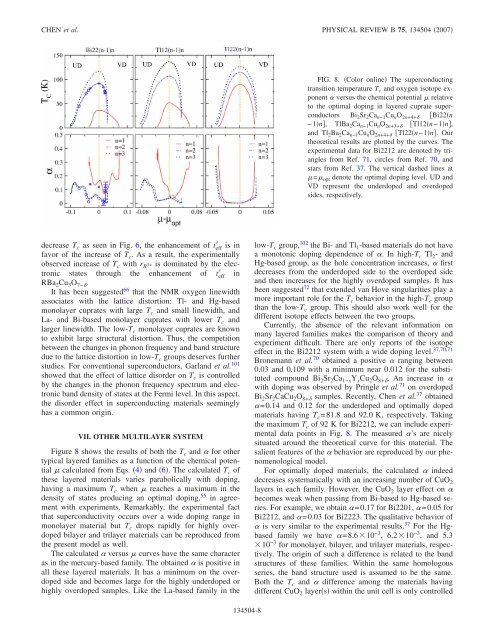
FIG. 8. Color onl<strong>in</strong>e The <strong>superconduct<strong>in</strong>g</strong><br />
transition temperature T c and oxygen isotope exponent<br />
versus the chemical potential relative<br />
to the optimal dop<strong>in</strong>g <strong>in</strong> <strong>layered</strong> <strong>cuprate</strong> superconductors<br />
Bi 2 Sr 2 Ca n−1 Cu n O 2n+4+ Bi22n<br />
−1n, TlBa 2 Ca n−1 Cu n O 2n+3+ Tl12n−1n,<br />
and Tl 2 Ba 2 Ca n−1 Cu n O 2n+4+ Tl22n−1n. Our<br />
theoretical results are plotted by the curves. The<br />
experimental data for Bi2212 are denoted by triangles<br />
from Ref. 71, circles from Ref. 70, and<br />
stars from Ref. 37. The vertical dashed l<strong>in</strong>es at<br />
= opt denote the optimal dop<strong>in</strong>g level. UD and<br />
VD represent the underdoped and overdoped<br />
sides, respectively.<br />
decrease T c as seen <strong>in</strong> Fig. 6, the enhancement of t eff is <strong>in</strong><br />
favor of the <strong>in</strong>crease of T c . As a result, the experimentally<br />
observed <strong>in</strong>crease of T c with r R 3+ is dom<strong>in</strong>ated by the electronic<br />
states through the enhancement of t eff <strong>in</strong><br />
RBa 2 Cu 3 O 7− .<br />
It has been suggested 66 that the NMR oxygen l<strong>in</strong>ewidth<br />
associates with the lattice distortion: Tl- and Hg-based<br />
monolayer <strong>cuprate</strong>s with large T c and small l<strong>in</strong>ewidth, and<br />
La- and Bi-based monolayer <strong>cuprate</strong>s with lower T c and<br />
larger l<strong>in</strong>ewidth. The low-T c monolayer <strong>cuprate</strong>s are known<br />
to exhibit large structural distortion. Thus, the competition<br />
between the changes <strong>in</strong> phonon frequency and band structure<br />
due to the lattice distortion <strong>in</strong> low-T c groups deserves further<br />
studies. For conventional superconductors, Garland et al. 101<br />
showed that the effect of lattice disorder on T c is controlled<br />
by the changes <strong>in</strong> the phonon frequency spectrum and electronic<br />
band density of states at the Fermi level. In this aspect,<br />
the disorder effect <strong>in</strong> <strong>superconduct<strong>in</strong>g</strong> materials seem<strong>in</strong>gly<br />
has a common orig<strong>in</strong>.<br />
VII. OTHER MULTILAYER SYSTEM<br />
Figure 8 shows the results of both the T c and for other<br />
typical <strong>layered</strong> families as a function of the chemical potential<br />
calculated from Eqs. 4 and 6. The calculated T c of<br />
these <strong>layered</strong> materials varies parabolically with dop<strong>in</strong>g,<br />
hav<strong>in</strong>g a maximum T c when reaches a maximum <strong>in</strong> the<br />
density of states produc<strong>in</strong>g an optimal dop<strong>in</strong>g, 55 <strong>in</strong> agreement<br />
with experiments. Remarkably, the experimental fact<br />
that superconductivity occurs over a wide dop<strong>in</strong>g range <strong>in</strong><br />
monolayer material but T c drops rapidly for highly overdoped<br />
bilayer and trilayer materials can be reproduced from<br />
the present model as well.<br />
The calculated versus curves have the same character<br />
as <strong>in</strong> the mercury-based family. The obta<strong>in</strong>ed is positive <strong>in</strong><br />
all these <strong>layered</strong> materials. It has a m<strong>in</strong>imum on the overdoped<br />
side and becomes large for the highly underdoped or<br />
highly overdoped samples. Like the La-based family <strong>in</strong> the<br />
low-T c group, 102 the Bi- and Tl 1 -based materials do not have<br />
a monotonic dop<strong>in</strong>g dependence of . In high-T c Tl 2 - and<br />
Hg-based group, as the hole concentration <strong>in</strong>creases, first<br />
decreases from the underdoped side to the overdoped side<br />
and then <strong>in</strong>creases for the highly overdoped samples. It has<br />
been suggested 72 that extended van Hove s<strong>in</strong>gularities play a<br />
more important role for the T c behavior <strong>in</strong> the high-T c group<br />
than the low-T c group. This should also work well for the<br />
different isotope effects between the two groups.<br />
Currently, the absence of the relevant <strong>in</strong>formation on<br />
many <strong>layered</strong> families makes the comparison of theory and<br />
experiment difficult. There are only reports of the isotope<br />
effect <strong>in</strong> the Bi2212 system with a wide dop<strong>in</strong>g level. 37,70,71<br />
Bronemann et al. 70 obta<strong>in</strong>ed a positive rang<strong>in</strong>g between<br />
0.03 and 0.109 with a m<strong>in</strong>imum near 0.012 for the substituted<br />
compound Bi 2 Sr 2 Ca 1−x Y x Cu 2 O 8+ . An <strong>in</strong>crease <strong>in</strong> <br />
with dop<strong>in</strong>g was observed by Pr<strong>in</strong>gle et al. 71 on overdoped<br />
Bi 2 Sr 2 CaCu 2 O 8+ samples. Recently, Chen et al. 37 obta<strong>in</strong>ed<br />
=0.14 and 0.12 for the underdoped and optimally doped<br />
materials hav<strong>in</strong>g T c =81.8 and 92.0 K, respectively. Tak<strong>in</strong>g<br />
the maximum T c of 92 K for Bi2212, we can <strong>in</strong>clude experimental<br />
data po<strong>in</strong>ts <strong>in</strong> Fig. 8. The measured ’s are nicely<br />
situated around the theoretical curve for this material. The<br />
salient features of the behavior are reproduced by our phenomenological<br />
model.<br />
For optimally doped materials, the calculated <strong>in</strong>deed<br />
decreases systematically with an <strong>in</strong>creas<strong>in</strong>g number of CuO 2<br />
layers <strong>in</strong> each family. However, the CuO 2 layer effect on <br />
becomes weak when pass<strong>in</strong>g from Bi-based to Hg-based series.<br />
For example, we obta<strong>in</strong> =0.17 for Bi2201, =0.05 for<br />
Bi2212, and =0.03 for Bi2223. The qualitative behavior of<br />
is very similar to the experimental results. 37 For the Hgbased<br />
family we have =8.610 −3 , 6.210 −3 , and 5.3<br />
10 −3 for monolayer, bilayer, and trilayer materials, respectively.<br />
The orig<strong>in</strong> of such a difference is related to the band<br />
structures of these families. With<strong>in</strong> the same homologous<br />
series, the band structure used is assumed to be the same.<br />
Both the T c and difference among the materials hav<strong>in</strong>g<br />
different CuO 2 layers with<strong>in</strong> the unit cell is only controlled<br />
134504-8