Phonon-mediated superconducting transitions in layered cuprate ...
Phonon-mediated superconducting transitions in layered cuprate ...
Phonon-mediated superconducting transitions in layered cuprate ...

Create successful ePaper yourself
Turn your PDF publications into a flip-book with our unique Google optimized e-Paper software.
PHONON-MEDIATED SUPERCONDUCTING TRANSITIONS…<br />
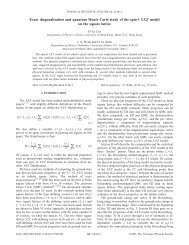
n H = 1 2 − 1 tanh k − .<br />
5<br />
2 k 2k B T c<br />
Although the <strong>in</strong>terlayer tunnel<strong>in</strong>g has anisotropic s-wave<br />
symmetry and thus represents <strong>in</strong>terlayer s-wave pair<strong>in</strong>g, and<br />
the function gk has d-wave symmetry, 4 the solution of the<br />
gap equation <strong>in</strong> reality has pure d-wave symmetry, which has<br />
been revealed by the quasiparticle tunnel<strong>in</strong>g spectra of<br />
multilayer <strong>cuprate</strong>s. 50 The validity of the d-wave BCS formalism<br />
<strong>in</strong> describ<strong>in</strong>g the <strong>superconduct<strong>in</strong>g</strong> state of <strong>cuprate</strong>s<br />
has been supported by recent measurements of ARPES 51 and<br />
transport properties. 52,53<br />
Once know<strong>in</strong>g the dispersion k and the values of 0 , V,<br />
and/or V , one can obta<strong>in</strong> the T c behavior from Eqs. 4 and<br />
5. We chose a typical 0 =0.060 eV. The energy scale lies<br />
with<strong>in</strong> the k<strong>in</strong>k range of 0.050–0.080 eV from<br />
ARPES. 31–34 Far-<strong>in</strong>frared measurements 54 have established<br />
that the phonon modes scarcely change amongst the <strong>cuprate</strong>s<br />
irrespective of their T c changes. An unchanged mean boson<br />
energy of 52±8 meV for all dop<strong>in</strong>gs was recently detected<br />
by tunnel<strong>in</strong>g. 35 Thus, the choice of 0 =0.060 eV should capture<br />
the reasonable energy scale of the phonon cutoff frequency<br />
for <strong>cuprate</strong> superconductors.<br />
For the dispersion we use k =t eff cos k x cos k y<br />
+t eff cos 2k x +cos 2k y with t eff and t eff be<strong>in</strong>g the effective<br />
next-nearest-neighbor and next-next-nearest-neighbor hopp<strong>in</strong>gs,<br />
respectively. Such a dispersion can reproduce the<br />
bandwidth and Fermi-surface shape of many <strong>cuprate</strong><br />
superconductors. 55,56 Accord<strong>in</strong>g to the t-t-J model, t eff =J<br />
+2t and t eff =J/4, where J is the antiferromagnetic <strong>in</strong>teraction.<br />
Experiments and calculations give a J=0.128 eV which<br />
does not depend significantly on the compounds. 57 Values of<br />
J=0.128 eV and t eff =0.032 eV are hence expected to be a<br />
generally good representation for all Cu-O materials. For a<br />
homologous series, the t eff , t eff , and V values is assumed to be<br />
the same. Their T c difference for the materials hav<strong>in</strong>g different<br />
CuO 2 layers is only controlled by the <strong>in</strong>terlayer tunnel<strong>in</strong>g<br />
strength V . The value of V can be determ<strong>in</strong>ed by us<strong>in</strong>g the<br />
experimental values of the maximum <strong>superconduct<strong>in</strong>g</strong> transition<br />
temperature T max c for the monolayer and bilayer compounds<br />
<strong>in</strong> each homogeneous series.<br />
There is only a s<strong>in</strong>gle CuO 2 layer <strong>in</strong> the monolayer system<br />
V =0. The T max c value solely depends on the choice of<br />
t eff and V. The driv<strong>in</strong>g force of high-T c superconductivity is<br />
believed to come ma<strong>in</strong>ly from the almost same CuO 2 plane.<br />
One can reasonably assume a compound-<strong>in</strong>dependent V for<br />
these materials. Thus, the variation of T max c among different<br />
families is due to the change <strong>in</strong> t eff . It has been<br />
established 8,58,59 that a larger t eff or t is always <strong>in</strong> favor of a<br />
higher T max c . By us<strong>in</strong>g t eff =0.032 eV and chang<strong>in</strong>g t eff from<br />
−0.032 to 0.0914 eV, Eq. 4 bears the experimentally observed<br />
T max c rang<strong>in</strong>g from 30 to 97 K of various optimally<br />
doped monolayer <strong>cuprate</strong>s when tak<strong>in</strong>g V=0.037 62 eV.<br />
HgBa 2 CuO 4+ has the highest T max c =97 K amongst the<br />
monolayer <strong>cuprate</strong>s reported so far and thus has the largest<br />
t eff . Other optimally doped monolayer compounds with a<br />
T max c 97 K should have a smaller t or t eff . Therefore, we<br />
can estimate the relative t eff by us<strong>in</strong>g the experimentally observed<br />
T max c for an <strong>in</strong>dividual material.<br />
PHYSICAL REVIEW B 75, 134504 2007<br />
In choos<strong>in</strong>g the dispersion k , the quasiparticle band is<br />
considered to be the same for any member with<strong>in</strong> a homologous<br />
series. The universality of the low energy exitation of<br />
the Bi-based family has been revealed from ARPES<br />
measurements. 60–63 That is, the quasiparticle band is rather<br />
flat near ,0, while it is quite dispersive and def<strong>in</strong>es a clear<br />
Fermi cross<strong>in</strong>g along the 0,0-, direction. The dispersion<br />
used here has the overall features as observed. Although<br />
there is a small change of the electronic states due to bilayer<br />
band splitt<strong>in</strong>g, 62,64 the splitt<strong>in</strong>g is suppressed by strong<br />
many-body effects. 21 It has also been found 62 that the bilayer<br />
splitt<strong>in</strong>g is much smaller <strong>in</strong> the supercondut<strong>in</strong>g state than that<br />
<strong>in</strong> the normal state. We then assume safely that the bilayer<br />
splitt<strong>in</strong>g has no significant <strong>in</strong>fluence on the bulk <strong>superconduct<strong>in</strong>g</strong><br />
properties studied, although it may be necessary for<br />
<strong>in</strong>terpret<strong>in</strong>g anisotropic transport properties <strong>in</strong> the normal<br />
state. To clarify its orig<strong>in</strong>, more experimental studies on the<br />
multilayer <strong>cuprate</strong>s are needed.<br />
III. SUPERCONDUCTING TRANSITION TEMPERATURE<br />
We first exam<strong>in</strong>e how the phonon-<strong>mediated</strong> BCS-like<br />
model describes the T c behavior for <strong>layered</strong> <strong>cuprate</strong>s. We<br />
chose HgBa 2 Ca n−1 Cu n O 2n+2+ as an example because T c is<br />
highest both at ambient condition and under high pressure <strong>in</strong><br />
any member of this homologous series and it strongly depends<br />
on the number of CuO 2 layers. The structure of all<br />
these compounds is relatively simple, and furthermore, T c<br />
can be changed by dop<strong>in</strong>g level over a relatively wide regime.<br />
Thus, this homologous series is a very good candidate<br />
for studies.<br />
For mercury-based compounds, we take t eff =0.0914 eV,<br />
t eff =0.032 eV, and V=0.037 62 eV. 8 Such a choice can bear<br />
the experimentally observed T c versus n H behavior of<br />
HgBa 2 CuO 4+ with a maximum T c of 97 K at the optimal<br />
dop<strong>in</strong>g based on a d-wave BCS-like model without tak<strong>in</strong>g<br />
phonons <strong>in</strong>to account. 8 Meanwhile, the V /V ratio was estimated<br />
to be 0.0332 by tak<strong>in</strong>g the experimental values of T c<br />
of 97 and 127 K for the monolayer and bilayer mercurybased<br />
compounds, respectively. In order to keep the consistency<br />
of the theory, we use the same dispersion k , V, and V <br />
<strong>in</strong> the calculations.<br />
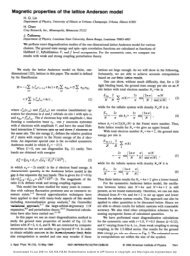
Figure 1 shows the calculated T c <strong>in</strong> the homologous series<br />
of HgBa 2 Ca n−1 Cu n O 2n+2+ as a function of the hole concentration<br />
n H . The obta<strong>in</strong>ed T c of all these materials varies parabolically<br />
with the dop<strong>in</strong>g level. This is a good agreement<br />
between the theory and experiments <strong>in</strong> the monolayer, bilayer,<br />
and trilayer compounds. 38,39 These results support the<br />
negligible phonon contribution to <strong>in</strong>terlayer coupl<strong>in</strong>g process.<br />
Increas<strong>in</strong>g the number of CuO 2 layers shifts upwards<br />
the whole T c versus n H curves. For the larger members, the<br />
relation between T c and n H becomes almost undist<strong>in</strong>guishable.<br />
All these features are consistent with those obta<strong>in</strong>ed<br />
from a d-wave BCS-like model. 8<br />
Figure 2 shows the CuO 2 -layer dependence of the calculated<br />
maximum T c <strong>in</strong> the homogeneous series of the optimally<br />
doped HgBa 2 Ca n−1 Cu n O 2n+2+ . The experimental data<br />
po<strong>in</strong>ts 11 are also plotted for comparison. As can be seen, T c<br />
<strong>in</strong>itially <strong>in</strong>creases with <strong>in</strong>creas<strong>in</strong>g the number CuO 2 layers<br />
134504-3