2006;56;106-130 CA Cancer J Clin Smigal and Michael J. Thun ...
2006;56;106-130 CA Cancer J Clin Smigal and Michael J. Thun ...
2006;56;106-130 CA Cancer J Clin Smigal and Michael J. Thun ...

You also want an ePaper? Increase the reach of your titles
YUMPU automatically turns print PDFs into web optimized ePapers that Google loves.
<strong>CA</strong> <strong>Cancer</strong> J <strong>Clin</strong> <strong>2006</strong>;<strong>56</strong>:<strong>106</strong>–<strong>130</strong><br />
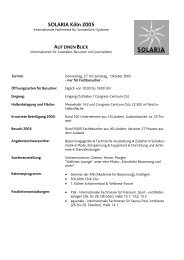
FIGURE 3 Annual Age-adjusted <strong>Cancer</strong> Incidence Rates* Among Males <strong>and</strong> Females for Selected <strong>Cancer</strong>s, US, 1975 to 2002.<br />
*Rates are age-adjusted to the 2000 US st<strong>and</strong>ard population <strong>and</strong> adjusted for delays in reporting with the exception of melanoma. Source:<br />
Surveillance, Epidemiology, <strong>and</strong> End Results (SEER) program, nine oldest registries, 1975 to 2002, Division of <strong>Cancer</strong> Control <strong>and</strong> Population<br />
Sciences, National <strong>Cancer</strong> Institute, 2005.<br />
Estimated <strong>Cancer</strong> Deaths<br />
We used the state-space prediction method 12<br />
to estimate the number of cancer deaths expected<br />
to occur in the United States <strong>and</strong> in each state in<br />
the year <strong>2006</strong>. Projections arebased on underlying<br />
cause-of-death from death certificates as reported<br />
to the NCHS. 1 This model projects the<br />
number of cancer deaths expected to occur in<br />
<strong>2006</strong> based on the number that occurred each<br />
year from 1969 to 2003 in the United States <strong>and</strong><br />
in each state separately.<br />
Other Statistics<br />
We provide mortality statistics for the<br />
leading causes of death as well as deaths from<br />
cancer in the year 2003. Causes of death for<br />
2003 were coded <strong>and</strong> classified according to<br />
ICD-10. 7 This report also provides updated<br />
statistics on trends in cancer incidence <strong>and</strong><br />
mortality rates, the probability of developing<br />
cancer, <strong>and</strong> 5-year relative survival rates for<br />
selected cancer sites based on data from 1974<br />
through 2002. 3 All age-adjusted incidence<br />
<strong>and</strong> death rates are st<strong>and</strong>ardized to the 2000<br />
US st<strong>and</strong>ard population <strong>and</strong> expressed per<br />
100,000 population.<br />
The long-term incidence rates <strong>and</strong> trends<br />
(1975 to 2002) are adjusted for delays in reporting<br />
where possible. Delayed reporting affects<br />
the most recent 1 to 3 years of incidence<br />
data (in this case, 2000 to 2002), especially for<br />
cancers such as melanoma <strong>and</strong> prostate that are<br />
frequently diagnosed in outpatient settings.<br />
Downloaded from caonline.amcancersoc.org by guest on September 27, <strong>2006</strong> (©American <strong>Cancer</strong> Society, Inc.)<br />
Volume <strong>56</strong> Y Number 2 Y March/April <strong>2006</strong> 113
![811 IARC vitamin D and Cancer Report_VitD[1] - Sunlight Research ...](https://img.yumpu.com/25304592/1/184x260/811-iarc-vitamin-d-and-cancer-report-vitd1-sunlight-research-.jpg?quality=85)