2006;56;106-130 CA Cancer J Clin Smigal and Michael J. Thun ...
2006;56;106-130 CA Cancer J Clin Smigal and Michael J. Thun ...
2006;56;106-130 CA Cancer J Clin Smigal and Michael J. Thun ...

Create successful ePaper yourself
Turn your PDF publications into a flip-book with our unique Google optimized e-Paper software.
<strong>Cancer</strong> Statistics, <strong>2006</strong><br />
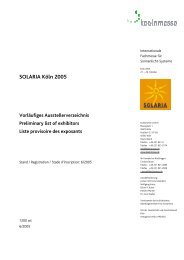
TABLE 5 Trends in <strong>Cancer</strong> Incidence <strong>and</strong> Death Rates for Selected <strong>Cancer</strong>s by Sex, US, 1975 to 2002<br />
Line Segment 1 Line Segment 2 Line Segment 3 Line Segment 4<br />
Year APC* Year APC* Year APC* Year APC*<br />
All sites<br />
Incidence<br />
Male <strong>and</strong> female 1975–1983 0.9† 1983–1992 1.8† 1992–1995 -1.7 1995–2002 0.3<br />
Male 1975–1989 1.3† 1989–1992 5.2† 1992–1995 -4.7† 1995–2002 0.2<br />
Female 1975–1979 -0.2 1979–1987 1.5† 1987–2002 0.3†<br />
Death<br />
Male <strong>and</strong> female 1975–1990 0.5† 1990–1993 -0.3 1993–2002 -1.1†<br />
Male 1975–1979 1.0† 1979–1990 0.3† 1990–1993 -0.4 1993–2002 -1.5†<br />
Female 1975–1992 0.5† 1992–2002 -0.8†<br />
Lung & bronchus<br />
Incidence<br />
Male <strong>and</strong> female 1975–1982 2.5† 1982–1991 1.0† 1991–2002 -0.7†<br />
Male 1975–1982 1.5† 1982–1991 -0.4 1991–2002 -1.8†<br />
Female 1975–1982 5.5† 1982–1990 3.5† 1990–1998 1.0† 1998–2002 -0.5<br />
Death<br />
Male <strong>and</strong> female 1975–1980 3.0† 1980–1990 1.8† 1990–1994 -0.1 1994–2002 -0.9†<br />
Male 1975–1978 2.4† 1978–1984 1.2† 1984–1991 0.3† 1991–2002 -1.9†<br />
Female 1975–1982 6.0† 1982–1990 4.2† 1990–1995 1.7† 1995–2002 0.3†<br />
Colon & rectum<br />
Incidence<br />
Male <strong>and</strong> female 1975–1985 0.8† 1985–1995 -1.8† 1995–1998 1.1 1998–2002 -1.8†<br />
Male 1975–1986 1.1† 1986–1995 -2.1† 1995–1998 1.0 1998–2002 -2.5†<br />
Female 1975–1985 0.3† 1985–1995 -1.8† 1995–1998 1.5 1998–2002 -1.5†<br />
Death<br />
Male <strong>and</strong> female 1975–1984 -0.5† 1984–2002 -1.8†<br />
Male 1975–1978 0.8 1978–1984 -0.4 1984–1990 -1.3† 1990–2002 -2.0†<br />
Female 1975–1984 -1.0† 1984–2002 -1.8†<br />
Female breast<br />
Incidence 1975–1980 -0.4 1980–1987 3.7† 1987–2002 0.4†<br />
Death 1975–1990 0.4† 1990–2002 -2.3†<br />
Prostate<br />
Incidence 1975–1988 2.6† 1988–1992 16.5† 1992–1995 -11.2† 1995–2002 1.7†<br />
Death 1975–1987 0.9† 1987–1991 3.1† 1991–1994 -0.6 1994–2002 -4.0†<br />
*APC, annual percent change based on rates age-adjusted to the 2000 st<strong>and</strong>ard population.<br />
†The APC is significantly different from zero.<br />
Note: Trends were analyzed by Joinpoint Regression Program, version 3.0, with a maximum of three joinpoints (ie, four line segments).<br />
Trends in incidence are based on rates adjusted for delay in reporting.<br />
Source: Ries LAG, Eisner MP, Kosary CL, et al. 3<br />
leading cause of cancer death in women in 1987.<br />
Lung cancer is expected to account for 26% of all<br />
cancer deaths among females in <strong>2006</strong>. Table 3<br />
provides the estimated number of cancer deaths<br />
in <strong>2006</strong> by state for selected cancer sites.<br />
Regional Variations in <strong>Cancer</strong> Rates<br />
Table 4 depicts cancer incidence for select<br />
cancers by state. Rates vary widely across states.<br />
For example, among the cancers listed in<br />
Table 4, the largest variation in the incidence<br />
rates (in proportionate terms) occurred in<br />
lung cancer in which rates (cases per 100,000<br />
population) ranged from 42.3 in men <strong>and</strong><br />
21.5 in women in Utah to 138.2 in men <strong>and</strong><br />
72.3 in women in Kentucky. In contrast, the<br />
variation in female breast cancer incidence<br />
rates was small, ranging from 116.6 cases per<br />
100,000 populations in New Mexico to<br />
149.5 cases in Washington. Factors that contribute<br />
to the state variations in the incidence<br />
rates include differences in the prevalence of<br />
risk factors, access to <strong>and</strong> utilization of early<br />
detection services, <strong>and</strong> completeness of reporting.<br />
For example, the state variation in<br />
lung cancer incidence rates reflects differences<br />
in smoking prevalence; Utah ranks<br />
lowest in adult smoking prevalence <strong>and</strong> Kentucky<br />
highest.<br />
Downloaded from caonline.amcancersoc.org by guest on September 27, <strong>2006</strong> (©American <strong>Cancer</strong> Society, Inc.)<br />
116 <strong>CA</strong> A <strong>Cancer</strong> Journal for <strong>Clin</strong>icians
![811 IARC vitamin D and Cancer Report_VitD[1] - Sunlight Research ...](https://img.yumpu.com/25304592/1/184x260/811-iarc-vitamin-d-and-cancer-report-vitd1-sunlight-research-.jpg?quality=85)