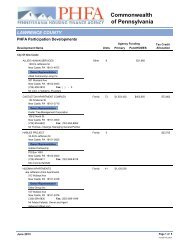
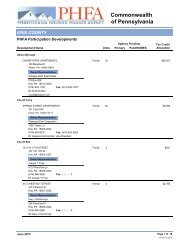
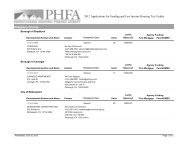
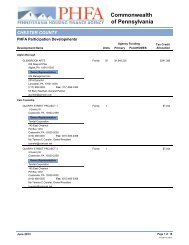
PHFA Annual Report 2003 - Pennsylvania Housing Finance Agency
PHFA Annual Report 2003 - Pennsylvania Housing Finance Agency
PHFA Annual Report 2003 - Pennsylvania Housing Finance Agency

Create successful ePaper yourself
Turn your PDF publications into a flip-book with our unique Google optimized e-Paper software.
48 49<br />
Investments<br />
The <strong>Agency</strong> categorizes investments according to the level of credit risk assumed by the <strong>Agency</strong>. Category 1 includes<br />
investments that are insured, registered or held by the <strong>Agency</strong>’s agent in the <strong>Agency</strong>’s name. Category 2 includes uninsured<br />
and unregistered investments held by the counterparty’s trust department or agent in the <strong>Agency</strong>’s name. Category 3<br />
includes uninsured and unregistered investments held by the counterparty, its trust department or its agent, but not in the<br />
<strong>Agency</strong>’s name. Certain investments have not been categorized because securities are not used as evidence of the investment.<br />
These uncategorized investments represent the <strong>Agency</strong>’s ownership interests in investment agreements, mutual funds<br />
and investment in the State Treasurer’s investment pool. All investments listed below are included in Category 1.<br />
Total<br />
Total Carrying<br />
Amortized Amount/<br />
(in thousands of dollars) Cost Fair Value<br />
June 30, <strong>2003</strong><br />
Corporate bonds $ 52,108 $ 55,691<br />
Repurchase agreements 220 220<br />
U.S. Government and agency securities 208,072 225,742<br />
Short-term investments 807,935 807,935<br />
Totals 1,068,335 1,089,588<br />
Add amounts not categorized because securities are not used as<br />
evidence of the investments<br />
Investment agreements 2,908 2,908<br />
Mutual funds 185,808 185,808<br />
Total investments $ 1,257,051 $ 1,278,304<br />
Total<br />
Total Carrying<br />
Amortized Amount/<br />
(in thousands of dollars) Cost Fair Value<br />
June 30, 2002<br />
Corporate bonds $ 11,493 $ 11,531<br />
Repurchase agreements 397 397<br />
U.S. Government and agency securities 255,603 271,237<br />
Short-term investments 488,470 488,470<br />
Totals 755,963 771,635<br />
Add amounts not categorized because securities are not used as<br />
evidence of the investments<br />
Investment agreements 28,357 28,357<br />
Mutual funds 146,583 146,583<br />
Total investments $ 930,903 $ 946,575<br />
The <strong>Agency</strong> has implemented GASB Statement No. 28, Accounting and Financial <strong>Report</strong>ing for Securities Lending<br />
Transactions. Under the authority of the <strong>Agency</strong>’s Board, the <strong>Agency</strong> may lend securities to broker-dealers and other entities<br />
(“borrowers”) for collateral that will be returned for the same securities in the future. The <strong>Agency</strong>’s primary custodial<br />
bank manages the securities lending program and receives cash, securities or irrevocable bank letters of credit as collateral.<br />
The collateral securities cannot be pledged or sold by the <strong>Agency</strong> unless the borrower defaults. Cash, collateral securities,<br />
and letters of credit are initially pledged at 102 percent of the market value of the securities lent, and additional collateral<br />
has to be provided by the next business day if its value falls to less than 100 percent of the market of the securities lent. As<br />
of June 30, <strong>2003</strong> and 2002, the <strong>Agency</strong> had no securities on loan.<br />
The amortized cost and estimated market values of investment securities as of June 30, <strong>2003</strong> and<br />
2002 are as follows:<br />
<strong>2003</strong><br />
Gross Gross<br />
Amortized Unrealized Unrealized<br />
(in thousands of dollars) Cost Gains Losses Fair Value<br />
Corporate bonds $ 52,108 $ 3,586 $ (3) $ 55,691<br />
Repurchase agreements 220 — — 220<br />
U.S. Government obligations 167,115 2,439 (174) 169,380<br />
U.S. Government agency obligations 40,957 15,405 — 56,362<br />
Short-term investments 807,935 — — 807,935<br />
Investment agreements 2,908 — — 2,908<br />
Mutual funds 185,808 — — 185,808<br />
$ 1,257,051 $ 21,430 $ (177) $ 1,278,304<br />
2002<br />
Gross Gross<br />
Amortized Unrealized Unrealized<br />
(in thousands of dollars) Cost Gains Losses Fair Value<br />
Corporate bonds $ 11,493 $ 103 $ (65) $ 11,531<br />
Repurchase agreements 397 — — 397<br />
U.S. Government obligations 42,111 13,383 — 55,494<br />
U.S. Government agency obligations 213,492 2,268 (17) 215,743<br />
Short—term investments 488,470 — — 488,470<br />
Investment agreements 28,357 — — 28,357<br />
Mutual funds 146,583 — — 146,583<br />
930,903 $ 15,754 $ (82) $ 946,575<br />
The amortized cost and estimated market value of investments at June 30, <strong>2003</strong>, by contractual maturities, are shown<br />
below. Expected maturities will differ from contractual maturities because borrowers may have the right to call or prepay<br />
obligations with or without call or prepayment penalties.<br />
Amortized<br />
(in thousands of dollars) Cost Fair Value<br />
Due in one year or less 1,025,747 $ 1,027,335<br />
Due after one year through five years 171,114 175,707<br />
Due after five years through ten years 29,592 35,025<br />
Due after ten years 30,598 40,237<br />
1,257,051 $ 1,278,304