Population PKPD Mode.. - Pharsight Corporation
Population PKPD Mode.. - Pharsight Corporation
Population PKPD Mode.. - Pharsight Corporation

You also want an ePaper? Increase the reach of your titles
YUMPU automatically turns print PDFs into web optimized ePapers that Google loves.
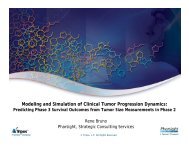
<strong>Population</strong> PK/PD <strong>Mode</strong>ling – The <strong>Pharsight</strong> Approach<br />
Daniel Weiner, Ph.D.<br />
Chief Technology Officer<br />
June 26, 2008<br />
© <strong>Pharsight</strong> <strong>Corporation</strong> All Rights Reserved
Today’s Presenter<br />
Dan Weiner<br />
●<br />
●<br />
●<br />
●<br />
●<br />
●<br />
●<br />
Expert consultant to the U.S. Food and Drug Administration (FDA)<br />
Executive sponsor for <strong>Pharsight</strong>’s Cooperative Research and Development Agreement<br />
(CRADA) with FDA<br />
Senior positions at Merrell-Dow, Syntex, Quintiles, IVAX and <strong>Pharsight</strong><br />
Trained over 1000 scientists in PK/PD modeling<br />
Original author of WinNonlin®<br />
Coauthor of Pharmacokinetic & Pharmacodynamic Data Analysis:<br />
Concepts and Applications<br />
PhD in Mathematical Statistics<br />
slide 2<br />
© <strong>Pharsight</strong> <strong>Corporation</strong> All Rights Reserved
Agenda<br />
<strong>Pharsight</strong> Company Overview<br />
Reporting and Analysis Services (RAS)<br />
●<br />
●<br />
Expertise, Workflow and Communication Plan<br />
Regulatory <strong>Population</strong> Pharmacokinetics Workflow<br />
Case Study: <strong>Population</strong> PK/PD to Support NDA Submission<br />
<strong>Mode</strong>l Building: Adding Covariates<br />
<strong>Mode</strong>l Discrimination, Evaluation and Diagnosis<br />
slide 3<br />
© <strong>Pharsight</strong> <strong>Corporation</strong> All Rights Reserved
<strong>Pharsight</strong> Company Overview<br />
Helping pharmaceutical customers<br />
improve their drug development<br />
process, regulatory compliance and<br />
strategic decision-making.<br />
© <strong>Pharsight</strong> <strong>Corporation</strong> All Rights Reserved
Who Is <strong>Pharsight</strong>?<br />
A company that helps pharmaceutical customers improve their drug<br />
development process, regulatory compliance and strategic decision-making.<br />
A Global Business<br />
●<br />
●<br />
●<br />
Over 100 Employees<br />
Two North American Headquarters<br />
World Wide Sales and Consulting Locations<br />
A Diverse And Skilled Group of People<br />
●<br />
●<br />
●<br />
Scientists (> 25 PhDs and/or MDs)<br />
Engineers (>15 software developers)<br />
Professionals (10 MBAs & JDs)<br />
An Established & Trusted Organization<br />
●<br />
●<br />
●<br />
●<br />
More than 10 years in business<br />
A public company (PHST)<br />
Over 1000 professional service engagements<br />
More than 2000 software customers<br />
slide 5<br />
© <strong>Pharsight</strong> <strong>Corporation</strong> All Rights Reserved
What Are <strong>Pharsight</strong> Capabilities?<br />
One theme: efficient drug development<br />
Software<br />
Strategic Consulting<br />
Metadata<br />
Improve productivity and<br />
compliance<br />
Quantify your decisionmaking<br />
Understand the competitive<br />
landscape<br />
Enterprise and desktop products<br />
for analyzing, presenting and<br />
storing drug development data.<br />
Consulting expertise in modelbased<br />
drug development and<br />
decision-making.<br />
<strong>Mode</strong>ling-ready data sets<br />
complied by experts from public<br />
source medical & scientific<br />
literature.<br />
Training<br />
Reporting and<br />
Analysis Services<br />
Build your capabilities<br />
Regulatory Compliant<br />
Reporting and Analysis Services<br />
A variety of courses teaching<br />
<strong>Pharsight</strong> software tools and<br />
model-based drug development<br />
skills.<br />
High quality NCA and population<br />
PK/PD analysis and reporting.<br />
slide 6<br />
© <strong>Pharsight</strong> <strong>Corporation</strong> All Rights Reserved
Who Are <strong>Pharsight</strong> Customers?<br />
This is a sample from <strong>Pharsight</strong>'s customer base which includes all Top 50<br />
Pharmaceutical companies.<br />
slide 7<br />
© <strong>Pharsight</strong> <strong>Corporation</strong> All Rights Reserved
Where Is Our Strategic Focus?<br />
We provide tools and services that help our customers increase drug<br />
development efficiency, with a particular focus on the decisions occurring<br />
within the FDA’s “critical path.”<br />
The Critical Path<br />
Average time and cost per approved compound:8 years and $524M 1,2<br />
slide 8<br />
5000 250 5 1<br />
Discovery Pre-Clinical Clinical Approval<br />
$23B<br />
1 Dimasi, et al, "The price of innovation: new estimates of drug development costs," Journal of Health Economics, 22:2, March 2003<br />
2<br />
2005 PAREXEL R&D Statistical Sourcebook from Bain and In Vivo<br />
3<br />
2002 Estimated Global Pharma and Biotech R&D Spending by Category: BioPharm International, March 2003<br />
4<br />
PhRMA 2003 Industry Profile, March 2003<br />
© <strong>Pharsight</strong> <strong>Corporation</strong> All Rights Reserved<br />
$48B<br />
except where noted all numbers are estimates for industry totals per year 3,4
Reporting and Analysis Services (RAS): Expertise, Workflow<br />
and Communication Plan<br />
© <strong>Pharsight</strong> <strong>Corporation</strong> All Rights Reserved
What is RAS?<br />
<strong>Pharsight</strong> Reporting and Analysis Services (RAS) is a high quality resource for<br />
producing the clinical pharmacology study reports that are the basis of your<br />
regulatory submission document.<br />
Common Technical Document<br />
This is the RAS deliverable<br />
Module 5<br />
Clinical Study Reports<br />
RAS is a world class organization<br />
● Team experience on more than 400 client<br />
engagements<br />
● Experts with <strong>Pharsight</strong>'s leading PK/PD analysis<br />
and reporting software including WinNonlin®,<br />
WinNonlin AutoPilot, and other tools (e.g.,<br />
NONMEM)<br />
● Experienced in all major disease indications and<br />
development phases<br />
● Business representatives in the United States,<br />
Europe, and Japan to serve all major drug<br />
development geographies.<br />
Module 1<br />
Regional Info<br />
Module 4<br />
Non-clinical Study Reports<br />
Module 3<br />
Quality<br />
Module 2<br />
Common Technical Document Summaries<br />
Module 1<br />
Regional Info<br />
Module 1<br />
Regional Info<br />
slide 10<br />
© <strong>Pharsight</strong> <strong>Corporation</strong> All Rights Reserved
RAS Value: High Quality Clinical Pharmacology Study Reports<br />
RAS Quality Assurance processes ensure the quality from data collection<br />
through final reporting.<br />
The quality of our reports is guaranteed through the following components:<br />
●<br />
●<br />
●<br />
●<br />
Standard Operating Procedures (SOPs) for PK/PD analysis and reporting.<br />
Registered quality assurance professional in GLPs (RQAP-GLP)<br />
Use of the latest validated software for our analyses<br />
Analysis and Reports are QC'd by an Authenticator (Scientist #1), a Reviewer (Scientist #2) and by<br />
the Vice-President of RAS (Approval).<br />
Analytic Lab<br />
QA<br />
<strong>Pharsight</strong> RAS<br />
Analytic Report<br />
SOPs<br />
SOPs<br />
SOPs<br />
Acceptance<br />
Analysis<br />
Reporting<br />
Clinic<br />
QA<br />
Clinical Deviations<br />
QA<br />
QA<br />
QA<br />
Final<br />
Clinical Report<br />
to Sponsor<br />
Protocol<br />
slide 11<br />
© <strong>Pharsight</strong> <strong>Corporation</strong> All Rights Reserved
RAS Value: Timely Analysis with <strong>Pharsight</strong> Software<br />
RAS leverages <strong>Pharsight</strong>’s integrated software system for the analysis and<br />
storage of PK data to deliver timely, auditable and cost-effective results.<br />
WinNonlin® AutoPilot enables <strong>Pharsight</strong>’s analysts to deliver results 80% faster than other manual<br />
NCA reporting methods<br />
IVIVC Toolkit for WinNonlin® enables <strong>Pharsight</strong>’s analyst to minimize manipulation and speed-up<br />
analysis and delivery of report<br />
Grid computing facility enables <strong>Pharsight</strong>’s analyst to use CPU intensive methods (e.g. bootstrap)<br />
Sponsor Data<br />
Final<br />
Clinical Report<br />
to Sponsor<br />
WinNonlin AutoPilot<br />
WinNonlin IVIVC Toolkit <br />
Mixed effects : NONMEM VI<br />
PKS Connector<br />
PKS Reporter<br />
<strong>Pharsight</strong> Knowledgebase Suite<br />
& GLP Server<br />
slide 12<br />
© <strong>Pharsight</strong> <strong>Corporation</strong> All Rights Reserved
RAS Offers Three Analytic Competencies<br />
RAS scientists work collaboratively with your organization using the latest<br />
technology to produce and deliver timely, high quality analytic reports.<br />
Sponsor Data<br />
<strong>Pharsight</strong> RAS<br />
Analysis<br />
1. NCA<br />
•Preclinical<br />
•Phase I<br />
•Phase II<br />
2. IVIVC Formulation<br />
3. Regulatory Pop PK-<br />
PD Analysis<br />
Results<br />
Reporting<br />
1. Writing<br />
•Scientific<br />
•Pharmacological<br />
•Medical<br />
2. Quality Assurance<br />
3. Formatting<br />
Clinical Study<br />
Reports<br />
slide 13<br />
© <strong>Pharsight</strong> <strong>Corporation</strong> All Rights Reserved
PK/PD PK/PD Expertise Expertise in in Early Early Drug Drug Development<br />
1) Non-Compartmental PK/PD analysis using WinNonlin ® and AutoPilot<br />
● PK and PD analyses and creation of Tables, Figures and Listings<br />
● Statistical analyses (ANOVAs, Dose-Proportionality, Steady-State Analysis)<br />
● Draft and Final ICHE3 Clinical Study Reports<br />
● PK/PD Analysis and Report 100% QC’d by two scientists (Authenticator and Reviewer)<br />
● QA inspection performed by a Registered Quality Assurance Professional in GLPs (RQAP-GLP).<br />
Plasma Concentration (ng/mL)<br />
1.2<br />
0.6<br />
0<br />
Preclinical<br />
• TK and PK analysis in animals<br />
• Allometric Scaling<br />
Cmax<br />
Phase I<br />
• Maximum Tolerated Dose (MTD)<br />
• SAD, MAD studies<br />
• Bioequivalence/Bioavailability<br />
• Food Effect Studies<br />
• Drug-Drug Interactions<br />
• Studies in Special <strong>Population</strong>s<br />
(renal/liver impaired)<br />
• QT Prolongation Studies<br />
Phase II<br />
• Dosing Requirements Studies (IIa)<br />
• Efficacy Studies (IIb)<br />
Total drug exposure (AUC 0-inf<br />
) CL = Dose / AUCinf IV<br />
CL/F = Dose / AUCinf PO<br />
Vss = CL x MRT IV<br />
Varea/F = Dose / AUCinf x λ z<br />
PO<br />
0 24 48<br />
Time (h)<br />
slide 14<br />
© <strong>Pharsight</strong> <strong>Corporation</strong> All Rights Reserved
PK/PD Expertise in Early Drug Development<br />
2) IVIVC analysis using WinNonlin ® Toolkit to Perform Efficient Analyses<br />
● Modified-release formulations & super generics [505(b)2]<br />
● Fixed-Dose Combination Products<br />
● Drug Delivery systems (Transdermal, parenteral, microsphere, liposomes)<br />
Correlation<br />
1<br />
Cp (ug/ml)<br />
1.2<br />
0.6<br />
0<br />
0 30 60<br />
time (hr)<br />
In Vivo Release (%)<br />
Fastest<br />
Fast<br />
0<br />
Medium<br />
Slow 0 0.5 1<br />
In Vitro Release (%)<br />
0.5<br />
Percent Dissolved<br />
100%<br />
50%<br />
0<br />
Fastest<br />
Fast<br />
Medium<br />
Slow<br />
0 150 300<br />
time (min)<br />
In Vivo<br />
In Vitro<br />
slide 15<br />
© <strong>Pharsight</strong> <strong>Corporation</strong> All Rights Reserved
PK/PD Expertise to Support Drug Development<br />
3) <strong>Population</strong> PK/PD Analysis<br />
●<br />
●<br />
●<br />
<strong>Mode</strong>ling and Simulation Analysis Plan<br />
PK/PD Analysis using NONMEM and Supporting Figures with S-Plus<br />
• <strong>Mode</strong>l build-up Process<br />
• Covariate Analysis and <strong>Mode</strong>l Validation (bootstrap, case-deletion diagnostic, predictive check)<br />
• 100% QC’d (Dataset, Programs, & Outputs) by two scientists (Auth. and Reviewer)<br />
<strong>Population</strong> PK Report or ICHE3 Clinical Study Report<br />
<strong>Mode</strong>l Build-Up<br />
Covariate Analysis<br />
and <strong>Mode</strong>l Validation<br />
Simulations<br />
slide 16<br />
© <strong>Pharsight</strong> <strong>Corporation</strong> All Rights Reserved
Communication <strong>Mode</strong>l: Single-Point Contact<br />
<strong>Pharsight</strong> Client<br />
Lead Scientist & Director of Pharmacology<br />
Maintain Scientific integrity <br />
Maintain Regulatory Compliance <br />
Project Manager<br />
Frequent status update <br />
Determine Priorities <br />
Maintain Timelines <br />
VP and<br />
Lead Scientist, RAS<br />
Team Leader<br />
Scientist #1 Scientist #2 … Scientist #3<br />
slide 17<br />
© <strong>Pharsight</strong> <strong>Corporation</strong> All Rights Reserved
RAS: Regulatory <strong>Population</strong> Pharmacokinetics Workflow<br />
© <strong>Pharsight</strong> <strong>Corporation</strong> All Rights Reserved
RAS Regulatory PK-PD <strong>Mode</strong>ling<br />
RAS scientists use state of the art software and methods to perform<br />
regulatory-oriented population PK-PD data analysis.<br />
Regulatory <strong>Population</strong> PK-PD <strong>Mode</strong>ling & Simulation Activities<br />
●<br />
Dataset construction including QC and QA activities<br />
●<br />
●<br />
<strong>Mode</strong>l Build-Up and Discrimination for Regulatory <strong>Population</strong> PK/PD Analysis<br />
Covariate Analysis<br />
●<br />
<strong>Mode</strong>l Validation (Bootstrap, Predictive Checks, Case-Deletion Diagnostics…)<br />
●<br />
<strong>Population</strong> PK Report & ICHE3 Clinical Study Report<br />
• Compliant with <strong>Population</strong> PK Guidances (FDA and EMEA)<br />
• Quality Controlled and Quality Assured<br />
slide 19<br />
© <strong>Pharsight</strong> <strong>Corporation</strong> All Rights Reserved
RAS Typical <strong>Population</strong> Pharmacokinetics Workflow<br />
Sponsor Data<br />
Analytic Lab<br />
QA<br />
Locked SAS Dataset(s) (CDISC)<br />
Analytic Report<br />
dm.sas7bdat<br />
cm.sas7bdat<br />
RAS<br />
Protocol<br />
Sponsor<br />
ra.sas7bdat<br />
QA<br />
ex.sas7bdat<br />
Clinic<br />
pp.sas7bdat<br />
Clinical Deviations<br />
…………..<br />
…………..<br />
…………..<br />
…………..<br />
…………..<br />
Work Plan<br />
Protocol<br />
Import Data<br />
Merge<br />
Transform<br />
…..<br />
Exploratory graphs<br />
Detect outliers<br />
…<br />
Analysis<br />
1. NCA<br />
•Preclinical<br />
•Phase I<br />
•Phase II<br />
Reporting<br />
1. Writing<br />
•Scientific<br />
•Pharmacological<br />
•Medical<br />
2. IVIVC Formulation<br />
2. Quality Assurance<br />
Dataset<br />
construction<br />
3. Regulatory Pop PK-<br />
PD Analysis<br />
Results<br />
3. Formatting<br />
Clinical Study<br />
Reports<br />
slide 20<br />
© <strong>Pharsight</strong> <strong>Corporation</strong> All Rights Reserved
Workflow: <strong>Population</strong> PK Analysis Part I (Dataset)<br />
SAS Dataset(s) from<br />
Locked Clinical Database<br />
NONMEM<br />
Dataset Construction<br />
QC<br />
Double-Coding<br />
or<br />
Construction/<br />
Deconstruction<br />
QA<br />
NONMEM Dataset<br />
Ready for Pop PK/PD<br />
Analysis<br />
slide 21<br />
© <strong>Pharsight</strong> <strong>Corporation</strong> All Rights Reserved
Different Steps to Generate an Analysis Ready Dataset<br />
Understand the design<br />
Protocol<br />
Read and understand<br />
the timeline of the<br />
protocol<br />
Schedule of Visits<br />
Schedule of Doses<br />
Schedule of PK/PD observations<br />
Administration data<br />
PK observations data<br />
Demographic and lab data<br />
(time independent)<br />
Randomization data<br />
Demographic and lab data<br />
(time dependent)<br />
These files are merged to create an analysis dataset<br />
slide 22<br />
© <strong>Pharsight</strong> <strong>Corporation</strong> All Rights Reserved
QC/QA of the Analysis Dataset<br />
SAS Dataset(s) from<br />
Locked Clinical Database<br />
Import Data<br />
Merge<br />
Transform<br />
…..<br />
Exploratory graphs<br />
Detect outliers<br />
…<br />
dm.sas7bdat<br />
cm.sas7bdat<br />
ra.sas7bdat<br />
…………….<br />
Locked Dataset<br />
Ready for Pop PK<br />
Analysis<br />
Dataset<br />
construction<br />
<strong>Pharsight</strong><br />
Scientist 1<br />
Construction<br />
of Dataset 1<br />
Authenticator<br />
Print and sign<br />
scripts verify … <br />
slide 23<br />
<strong>Pharsight</strong><br />
Scientist 2<br />
Deconstruction<br />
of Dataset 1<br />
Construction of<br />
Dataset 2<br />
QC<br />
Quality Control<br />
(Comparison)<br />
QA<br />
• Comparison of deconstructed<br />
Verification of Quality<br />
Dataset with source SAS files<br />
Control, Comparison<br />
• Comparison of the two datasets<br />
and Reconciliation<br />
and reconciliation<br />
QA<br />
Reviewer<br />
Comments QC QA<br />
QA<br />
Comments <br />
© <strong>Pharsight</strong> <strong>Corporation</strong> All Rights Reserved<br />
Quality<br />
Assurance
Workflow: PK/PD <strong>Mode</strong>ling Part II (Analysis & Reporting)<br />
Stage I : Dataset<br />
FINAL FINAL QC’ed QC’ed<br />
PK/PD PK/PD Dataset<br />
QA<br />
NLME Engine<br />
e.g.: Phoenix NLME, NONMEM<br />
Stage II : Analysis<br />
QC<br />
Grid to enhance time<br />
of analysis<br />
Advanced scripting to<br />
ensure reproducibility<br />
QC<br />
QC QC QC<br />
Tables, Figures & Listings<br />
(Appendix and In-Text)<br />
WinNonlin Table Wizard<br />
Autopilot<br />
QC<br />
Stage III : Reporting<br />
ICHE3 Report<br />
Highly customized<br />
scripted graphics<br />
QC<br />
Stage IV: Finalize<br />
QC Report <br />
QA QA<br />
Sr. Review<br />
(Approval)<br />
slide 24<br />
© <strong>Pharsight</strong> <strong>Corporation</strong> All Rights Reserved
Regulatory and Timely POP PK/PD<br />
<strong>Pharsight</strong> Tools and Facilities to ensure quality and speed<br />
Multi-disciplinary Team<br />
Clinical<br />
Pharmacology<br />
(FCP, MD,<br />
PharmD,…)<br />
Math & Stats<br />
100 % QC<br />
on all aspects of modeling<br />
Data, models and reporting<br />
Registered<br />
RQAP-GLP<br />
Advanced scripted<br />
graphics<br />
Reg. Affairs<br />
Advanced scripted<br />
dataset assembly (S-Plus)<br />
QA QA<br />
<br />
WinNonlin Table Wizard<br />
and Autopilot<br />
Computing Facility<br />
(Grid)<br />
Timely analysis and reliable reporting <br />
Stage V: Archive and Share<br />
<strong>Pharsight</strong><br />
Knowledgebase<br />
Server<br />
<strong>Mode</strong>l and data storage<br />
Secure Warehouse and<br />
convenient sharing with<br />
Regulatory agencies <br />
slide 25<br />
© <strong>Pharsight</strong> <strong>Corporation</strong> All Rights Reserved
Case Study : <strong>Population</strong> PK/PD to Support NDA Submission<br />
© <strong>Pharsight</strong> <strong>Corporation</strong> All Rights Reserved
PK Data<br />
PK from PHASE I, II and III studies<br />
Phase I<br />
Phase II<br />
Phase III<br />
Single/Multiple Dose Single/Multiple Dose Multiple Dose<br />
Time of exposure<br />
Richness in PK samples<br />
slide 27<br />
© <strong>Pharsight</strong> <strong>Corporation</strong> All Rights Reserved
PD Data<br />
Efficacy and Safety from PHASE II/III studies<br />
Phase I<br />
Phase II<br />
Phase III<br />
Multiple Dose<br />
Sparse PK<br />
Three Efficacy endpoints<br />
Two Safety endpoints<br />
slide 28<br />
© <strong>Pharsight</strong> <strong>Corporation</strong> All Rights Reserved
Typical POP PK <strong>Mode</strong>l Development Workflow<br />
Developing the Base PK <strong>Mode</strong>l<br />
Structural <strong>Mode</strong>l<br />
How many compartments<br />
are needed for disposition ?<br />
What input function can<br />
describe the absorption ?<br />
Statistical <strong>Mode</strong>l<br />
Deterministic<br />
Component<br />
⎡θ<br />
⎤<br />
1<br />
Θ=<br />
⎢<br />
θ<br />
⎥<br />
⎢<br />
2 ⎥<br />
⎢θ<br />
⎥<br />
3<br />
⎣<br />
⎦<br />
Disposition function<br />
One-Two-or Three-compartments<br />
Non-linearities, target-mediated…<br />
Input function<br />
What random effects on<br />
parameters are needed or<br />
supported by the data ?<br />
What residual variability<br />
model to use ?<br />
Stochastic<br />
Component<br />
Between subject variability (BSV) matrix<br />
Distributional assumption (Log-normal)<br />
Full Block<br />
Full Diagonal<br />
Reduced<br />
Residual variability model<br />
Additive, proportional, combined<br />
⎡Ω11<br />
Ω=<br />
⎢<br />
⎢<br />
Ω Ω<br />
⎢⎣<br />
0 0<br />
⎡σ<br />
12 22<br />
⎤<br />
11<br />
Σ= ⎢<br />
0 σ ⎥<br />
22<br />
⎣<br />
⎦<br />
⎤<br />
⎥<br />
⎥<br />
Ω ⎥<br />
33 ⎦<br />
slide 29<br />
© <strong>Pharsight</strong> <strong>Corporation</strong> All Rights Reserved
Examples of GOF Plots<br />
Note the smooth predictions at times with no observations<br />
Phoenix NLME generates these very efficiently<br />
slide 30<br />
© <strong>Pharsight</strong> <strong>Corporation</strong> All Rights Reserved
Examples of GOF Plots<br />
Covariance needed between Eta’s ? (Plot from run with diagonal Omega)<br />
-0.8 -0.3 0.2 0.7<br />
1<br />
ETA1<br />
-0<br />
-1<br />
-2<br />
0.7<br />
-3<br />
0.2<br />
ETA2<br />
-0.3<br />
-0.8<br />
0.75<br />
0.50<br />
ETA3<br />
0.25<br />
0.00<br />
-0.25<br />
-3 -2 -1 -0 1<br />
-0.50 -0.25 0.00 0.25 0.50 0.75<br />
-0.50<br />
slide 31<br />
© <strong>Pharsight</strong> <strong>Corporation</strong> All Rights Reserved
Examples of GOF Plots<br />
Cobs<br />
0 100 200 300<br />
IDENT<br />
LOESS<br />
Cobs<br />
0 100 200 300<br />
IDENT<br />
LOESS<br />
WRES<br />
-6 -4 -2 0 2 4 6<br />
ZERO<br />
LOESS<br />
WRES<br />
-6 -4 -2 0 2 4 6<br />
ZERO<br />
LOESS<br />
0 50 100 150 200<br />
0 50 100 150 200 250 300<br />
0 50 100 150 200<br />
0 20 40 60<br />
PRED<br />
IPRED<br />
PRED<br />
Time after dose<br />
Cobs<br />
0 100 200 300<br />
LOESS PRED<br />
LOESS Cobs<br />
WRES<br />
-6 -4 -2 0 2 4 6<br />
ZERO<br />
LOESS<br />
CWRES<br />
-6 -4 -2 0 2 4 6<br />
ZERO<br />
LOESS<br />
CWRES<br />
-6 -4 -2 0 2 4 6<br />
ZERO<br />
LOESS<br />
0 20 40 60<br />
0 500 1000 1500 2000<br />
0 50 100 150 200<br />
0 20 40 60<br />
Time after dose<br />
TIME<br />
PRED<br />
Time after dose<br />
slide 32<br />
© <strong>Pharsight</strong> <strong>Corporation</strong> All Rights Reserved
<strong>Mode</strong>l Building : Adding Covariates<br />
© <strong>Pharsight</strong> <strong>Corporation</strong> All Rights Reserved
Typical POP PK <strong>Mode</strong>l Development Workflow<br />
Developing a Covariate <strong>Mode</strong>l : Examples of Covariates<br />
•Demographics<br />
● Sex, Race, Size (weight, height, BSA, IBW, BMI, …)<br />
•Lab values<br />
● Renal function : Serum creatinine<br />
● Liver: bilirubin, albumin, AST, ALT, …<br />
● pheno/genotype<br />
Disease severity, Co-medication, smoking etc.<br />
slide 34<br />
© <strong>Pharsight</strong> <strong>Corporation</strong> All Rights Reserved
Summary of <strong>Mode</strong>l building<br />
Absorption <strong>Mode</strong>l<br />
Disposition <strong>Mode</strong>l<br />
⎡θ1<br />
⎤<br />
⎢<br />
θ<br />
⎥<br />
Θ= ⎢<br />
2 ⎥<br />
⎢⎣<br />
θ ⎥<br />
3 ⎦<br />
Deterministic<br />
Component<br />
⎡Ω11<br />
Ω=<br />
⎢<br />
⎢<br />
Ω Ω<br />
⎢⎣<br />
0 0<br />
12 22<br />
⎡σ<br />
Ω<br />
33<br />
⎤<br />
⎥<br />
⎥<br />
⎥⎦<br />
⎤<br />
11<br />
Σ= ⎢<br />
0 σ ⎥<br />
22<br />
⎣<br />
Between subject variability Matrix<br />
⎦<br />
Residual error model<br />
Stochastic<br />
Component<br />
Covariate <strong>Mode</strong>l Building<br />
Base <strong>Mode</strong>l<br />
slide 35<br />
© <strong>Pharsight</strong> <strong>Corporation</strong> All Rights Reserved
Typical POP PK <strong>Mode</strong>l Development Workflow<br />
Developing a Covariate <strong>Mode</strong>l : Stepwise <strong>Mode</strong>l Building<br />
Proceed with next step<br />
of covariate addition<br />
Important Covariates (GAM)<br />
Forward Stepwise Addition<br />
Graphs of WRES/CWRES and etas<br />
vs<br />
Covariates : Weight, Sex, CRCL<br />
Repeat until no<br />
covariate Covariate is <strong>Mode</strong>l significant Building<br />
Tentative <strong>Mode</strong>l<br />
With Covariates<br />
or<br />
Test each on PK parameters<br />
one by one :<br />
Weight and Sex on Vd<br />
Weight, Sex, CRCL on CL<br />
Keep the most<br />
Significant<br />
Base <strong>Mode</strong>l<br />
<strong>Mode</strong>l + Covariate<br />
slide 36<br />
© <strong>Pharsight</strong> <strong>Corporation</strong> All Rights Reserved
Typical POP PK <strong>Mode</strong>l Development Workflow<br />
Developing a Covariate <strong>Mode</strong>l : Backward Elimination<br />
Covariate <strong>Mode</strong>l Building<br />
Backward Deletion<br />
Remove covariates<br />
one by one by reverse order :<br />
Weight and Sex on Vd<br />
Weight, Sex, CRCL on CL<br />
Repeat until no<br />
covariate can be<br />
removed<br />
Proceed with <strong>Mode</strong>l<br />
Validation and Evaluation<br />
Final <strong>Mode</strong>l<br />
Tentative Final <strong>Mode</strong>l<br />
With Covariates<br />
slide 37<br />
© <strong>Pharsight</strong> <strong>Corporation</strong> All Rights Reserved
Typical POP PK <strong>Mode</strong>l Development Workflow<br />
Developing a Covariate <strong>Mode</strong>l : Multiple Covariates on a Parameter<br />
0.75<br />
⎛WEIGHT<br />
⎞<br />
SEX<br />
TVCL= θ<br />
CL<br />
⋅⎜<br />
⎟ ⋅<br />
L / h<br />
⎝ 75 ⎠<br />
( θ<br />
CL, SEX ) { }<br />
Blue denotes population parameter<br />
Red is a patient specific covariate<br />
Black is a constant usually the mean or the median are used<br />
Usually a linear multiplicative model with no interactions is used.<br />
This parameterization is easily interpretable<br />
TVCL is the clearance for a subject with median weight with SEX=0<br />
It is always useful to have a realistic typical patient when we have multiple<br />
covariates on a single parameter<br />
slide 38<br />
© <strong>Pharsight</strong> <strong>Corporation</strong> All Rights Reserved
Examples of Graphs to Aid Covariate <strong>Mode</strong>l Building<br />
Explore collinearity between covariates<br />
19<br />
17<br />
15<br />
13<br />
11<br />
70<br />
60<br />
50<br />
40<br />
30<br />
20<br />
0.45<br />
0.20<br />
-0.05<br />
-0.30<br />
-0.55<br />
-0.80<br />
CRCL<br />
0 50 100150200250<br />
11 13 15 17 19<br />
MTX<br />
HT<br />
150 160 170 180<br />
20 30 40 50 60 70<br />
AGE<br />
WT<br />
40 60 80 100 120<br />
-0.80 -0.55 -0.30 -0.050.20.45<br />
ETACL<br />
ETAKA<br />
-3 -2 -1 -0 1<br />
250<br />
200<br />
150<br />
100<br />
50<br />
0<br />
180<br />
170<br />
160<br />
150<br />
120<br />
100<br />
80<br />
60<br />
40<br />
1<br />
-0<br />
-1<br />
-2<br />
-3<br />
slide 39<br />
© <strong>Pharsight</strong> <strong>Corporation</strong> All Rights Reserved
Summary of <strong>Mode</strong>l building<br />
Absorption <strong>Mode</strong>l<br />
Disposition <strong>Mode</strong>l<br />
⎡θ1<br />
⎤<br />
⎢<br />
θ<br />
⎥<br />
Θ= ⎢<br />
2 ⎥<br />
⎢⎣<br />
θ ⎥<br />
3 ⎦<br />
Deterministic<br />
Component<br />
⎡Ω11<br />
Ω=<br />
⎢<br />
⎢<br />
Ω Ω<br />
⎢⎣<br />
0 0<br />
12 22<br />
⎡σ<br />
Ω<br />
33<br />
⎤<br />
⎥<br />
⎥<br />
⎥⎦<br />
⎤<br />
11<br />
Σ= ⎢<br />
0 σ ⎥<br />
22<br />
⎣<br />
Between subject variability Matrix<br />
⎦<br />
Residual error model<br />
Stochastic<br />
Component<br />
Covariate <strong>Mode</strong>l Building<br />
Base <strong>Mode</strong>l<br />
Final <strong>Mode</strong>l<br />
With Covariates<br />
<strong>Mode</strong>l Evaluation<br />
slide 40<br />
© <strong>Pharsight</strong> <strong>Corporation</strong> All Rights Reserved
<strong>Mode</strong>l Discrimination, Evaluation and Diagnosis<br />
© <strong>Pharsight</strong> <strong>Corporation</strong> All Rights Reserved
<strong>Mode</strong>l Evaluation/Diagnosis ?<br />
• Assumption Checking<br />
•Evaluation Methods<br />
• Parameters<br />
• Predictive Performance<br />
• Sensitivity Analysis<br />
slide 42<br />
© <strong>Pharsight</strong> <strong>Corporation</strong> All Rights Reserved
What Can We Evaluate ?<br />
• The different parts of the model<br />
– Structural PK-PD model<br />
– Covariate-parameter relationships models<br />
– Random effect models<br />
- Residual variability model<br />
• The performance of model-based inferences<br />
– Parameter estimates & confidence intervals<br />
– Hypothesis tests<br />
• Explore the data (EDA)<br />
• Follow the objectives<br />
• Keep the model plausible<br />
• Understand and check the<br />
assumptions and limitations<br />
• Define useful decision making<br />
criteria<br />
•Diagnosis can include a set of<br />
plausible models<br />
– Predictions/simulations with model<br />
slide 43<br />
© <strong>Pharsight</strong> <strong>Corporation</strong> All Rights Reserved
How Can We Evaluate ?<br />
• Assumption Checking<br />
●<br />
●<br />
Randomization tests for the p-values<br />
Graphics for distributional assumptions (Residuals, empirical Bayesian estimates, …)<br />
• Stability/precision of parameter estimates<br />
●<br />
●<br />
●<br />
●<br />
Validation through parameter prediction errors<br />
Log-Likelihood Profile<br />
Bootstrap (parametric & non-parametric)<br />
Cross-Validation/Leverage analysis<br />
• Assessment of model performance/properties<br />
●<br />
●<br />
●<br />
Prediction errors (from internal or external test set)<br />
Posterior Predictive Check/ Predictive Check/ Visual / Numerical / Quantitative<br />
Sensitivity Analysis<br />
Karlsson et al. Assumption testing in population pharmacokinetic models: illustrated with an<br />
analysis of moxonidine data from congestive heart failure patients. J PK B 26(2):207-46 1998.<br />
EI Ette. <strong>Population</strong> <strong>Mode</strong>l Stability and Performance. J Clin Pharmacol 37:486-495 (1997).<br />
slide 44<br />
© <strong>Pharsight</strong> <strong>Corporation</strong> All Rights Reserved
When to use diagnostics ?<br />
●<br />
●<br />
●<br />
Basic<br />
• Confirm convergence : numerical checks<br />
• Check if we had some improvement (OFV lower, BSV on parameter lower, residual<br />
variability lower…)<br />
Key runs<br />
• Unusual covariate detected : confirm with randomization test<br />
• Depends on the importance of the run<br />
Final run<br />
• Extensive diagnostics<br />
• Check if we have influential individuals<br />
♦ Individual contributions to OFV + fits with and without the suspect individuals<br />
♦ Case deletion diagnostics, Jackknifing<br />
• Check if we have outliers ( data with |WRES| > 4) compare fit with and without outliers<br />
• Check if parameters are precise not on a boundary and plausible<br />
♦ Standard errors may be obtained<br />
- Asymptotically from covariance step: always symmetric may contain impossible<br />
values<br />
- From bootstrap: time consuming<br />
- From likelihood profiling : time consuming poor if LRT not applicable and if<br />
likelihood approximation is far from the true likelihood<br />
• Check if the model describe the observed data well (PPC)<br />
slide 45<br />
© <strong>Pharsight</strong> <strong>Corporation</strong> All Rights Reserved
What to use in diagnostics ?<br />
●<br />
●<br />
●<br />
Residuals<br />
• RES = DV-PRED<br />
• IRES = DV-IPRED<br />
• IWRES=IRES/SD(residual variance)<br />
• WRES are based on FO approximation and fails when FO fails ( high non linearity, sparse<br />
data)<br />
• CWRES are based on FOCE approximation and have better properties<br />
Simulation Based Residuals or Prediction Discrepancies<br />
• Prediction discrepancies (PD) which are the quantile of each observation within its<br />
simulated distribution<br />
• Normalized Prediction distribution errors (NPDE) ( decorrelated, then normalized)<br />
Empirical Bayesian Estimates (EBE)<br />
• IWRES=IRES/SD(residual variance), residual variability diagnostics<br />
• IPRED are based on individual parameters, structural model diagnostics<br />
• Are used in the estimation process (FOCE)<br />
• Are used as initial support points for a non-parametric engine (Leary’s Method)<br />
• May suffer from shrinkage ( It is advisable to report shrinkage in plots and reports)<br />
slide 46<br />
© <strong>Pharsight</strong> <strong>Corporation</strong> All Rights Reserved
What to use in diagnostics ?<br />
●<br />
⎡Ω11<br />
Ω=<br />
⎢<br />
⎢<br />
Ω Ω<br />
⎢⎣<br />
0 0<br />
Simulation Based Diagnostics<br />
• Posterior Predictive Checks<br />
1<br />
Θ=<br />
⎢<br />
θ<br />
⎥<br />
⎢<br />
2 ⎥<br />
⎢θ<br />
⎥<br />
3<br />
12 22<br />
⎡σ<br />
♦<br />
♦<br />
♦<br />
♦<br />
♦<br />
Ω<br />
33<br />
⎤<br />
⎥<br />
⎥<br />
⎥⎦<br />
⎤<br />
11<br />
Σ= ⎢<br />
0 σ ⎥<br />
22<br />
⎣<br />
⎡θ<br />
⎤<br />
⎣<br />
⎦<br />
⎦<br />
Select a statistic of interest that a good model should not miss (e.g. AUC,<br />
Cmax, etc) and that can be derived from the raw data<br />
Simulate many data sets from the model (with uncertainty, TS2.2)<br />
Calculate the statistic from the N simulated data and J Replicates<br />
Calculate the statistic from the observed data<br />
Compare the statistic from raw and simulated data<br />
⎡Var<br />
⎤<br />
⎢<br />
Cov Var<br />
⎥<br />
VARCOV = ⎢<br />
⎥<br />
⎢ Cov Cov Var ⎥<br />
⎢<br />
⎥<br />
⎣Cov Cov Cov Var⎦<br />
Draw N Parameters form the<br />
final estimates and Variance<br />
Covariance Matrix<br />
Simulate Data according<br />
to the design of the study<br />
and compute the statistic<br />
Compare the statistic<br />
from raw and simulated<br />
data<br />
If we ignore parameter uncertainty this reduces to predictive check<br />
slide 47<br />
© <strong>Pharsight</strong> <strong>Corporation</strong> All Rights Reserved
Example of a likelihood profile<br />
-200.000<br />
Llikelihood Likelihood profile Profile for for propafenone Covariate Effect effect<br />
-201.000<br />
-201.581<br />
-202.000<br />
OFV value<br />
-203.000<br />
-204.000<br />
Delta OFV= 3.84<br />
-205.000<br />
0.167<br />
-205.42<br />
0.422<br />
0.15 0.20 0.25 0.30 0.35 0.40 0.45<br />
Propafenone Covariate Effect effect<br />
slide 48<br />
© <strong>Pharsight</strong> <strong>Corporation</strong> All Rights Reserved
Example of predictive check<br />
Drug ROP Men 1 Men Drug ROP 1 Women Drug BUP 2<br />
Concentrations and predictions in "mg/L"<br />
2.0<br />
1.5<br />
1.0<br />
0.5<br />
90 % PI<br />
Cobs<br />
PRED<br />
2.0<br />
1.5<br />
1.0<br />
0.5<br />
90 % PI<br />
Cobs<br />
PRED<br />
2.0<br />
1.5<br />
1.0<br />
0.5<br />
90 % PI<br />
Cobs<br />
PRED<br />
0.0<br />
Vd/F=366 L<br />
0.0<br />
Vd/F=208 L<br />
0.0<br />
0 5 10 15 20 25 30<br />
0 5 10 15 20 25 30<br />
0 5 10 15 20 25 30<br />
TIME "Hr"<br />
TIME "Hr"<br />
TIME "Hr"<br />
slide 49<br />
© <strong>Pharsight</strong> <strong>Corporation</strong> All Rights Reserved
Contact and Follow-Up: Thank you!<br />
James Hayden<br />
Senior Vice President, Global Sales<br />
Email: jhayden@pharsight.com<br />
Telephone: +1-650-314-3760<br />
Internet Site (www.pharsight.com)<br />
slide 50<br />
© <strong>Pharsight</strong> <strong>Corporation</strong> All Rights Reserved
Proprietary Notice<br />
● All contents Copyright © 2008 <strong>Pharsight</strong> <strong>Corporation</strong>. All rights reserved. The<br />
copyright for this document is owned by <strong>Pharsight</strong> <strong>Corporation</strong>.<br />
● No part of this document may be reproduced or transmitted in any form or by<br />
any means, electronic or mechanical, including photocopying, for any<br />
purpose, without the express written permission of <strong>Pharsight</strong> <strong>Corporation</strong>.<br />
● WinNonlin, WNL, WinNonMix, WNM, Trial Simulator, TS2, <strong>Pharsight</strong><br />
Knowledgebase Server, PKS, Drug <strong>Mode</strong>l Explorer, DMX and <strong>Pharsight</strong> are<br />
trademarks or registered trademarks of <strong>Pharsight</strong> <strong>Corporation</strong>.<br />
● All other brand and product names are trademarks or registered trademarks<br />
of their respective holders.<br />
slide 51<br />
© <strong>Pharsight</strong> <strong>Corporation</strong> All Rights Reserved