Annual Report 2011 - PGS
Annual Report 2011 - PGS
Annual Report 2011 - PGS

You also want an ePaper? Increase the reach of your titles
YUMPU automatically turns print PDFs into web optimized ePapers that Google loves.
Notes to the consolidated financial statements<br />
NOTES TO THE CONSOLIDATED FINANCIAL STATEMENTS<br />
In June <strong>2011</strong>, the Company established a fifth employee share option program. Options covering 1,469,000 shares were<br />
granted to certain key employees.<br />
The Company’s option programs are considered as equity-settled plans and the options were measured at fair value at date of<br />
grant. For the 2006, 2008 and 2009 plans one third of the options vest each of the three years subsequent to the date of grant.<br />
First possible exercise is one year after grant date. For the 2010 and <strong>2011</strong> plan the options will vest respectively 3 and 4 years<br />
after the date of grant for each half of the award. The options may only be exercised four times a year, during a defined period<br />
after the publication of the Company’s quarterly earnings release. The latest possible exercise date for all plans is five years<br />
subsequent to the grant date.<br />
For options granted under the 2006 employee option program, the exercise price corresponds to the weighted average trading<br />
price for the Company’s ordinary shares on the Oslo Stock Exchange the week before the options were granted. For options<br />
granted under the 2008, 2009, 2010 and <strong>2011</strong> employee option programs the exercise price corresponds to the weighted<br />
average trading price for the Company’s ordinary shares on the Oslo Stock Exchange at the date of grant.<br />
Maximum gain on the options in the 2008, 2009, 2010 and <strong>2011</strong> employee option programs are subject to a cap of 1.5 times the<br />
employee’s salary for each calendar year. The fair value of the cap is achieved through a reduction of the fair value of the<br />
options granted. There is no cap on the 2006 employee share option program.<br />
The fair value determined at the grant date is expensed over the vesting period, using the accelerated method, based on the<br />
Company’s estimate of the shares that will eventually vest. Fair value is measured using the Black-Scholes pricing model. The<br />
expected life used in the model has been adjusted based on management’s best estimate, for the effects of non-transferability,<br />
exercise restrictions and behavioural considerations. The options include a service condition as the individuals participating in<br />
the plan must be employed by the Company for a certain period of time in order to earn the right to exercise the share options.<br />
The options include no performance conditions.<br />
For the years ended December 31, <strong>2011</strong>, 2010 and 2009, the Company recognized compensation cost with a corresponding<br />
increase in shareholders’ equity of $5.1 million, $5.3 million and $11.8 million, respectively. Total net unrecognized<br />
compensation cost as of December 31, <strong>2011</strong> was $10.7 million (related to non-vested share-based options), which is expected<br />
to be recognized over a period of 3.5 years.<br />
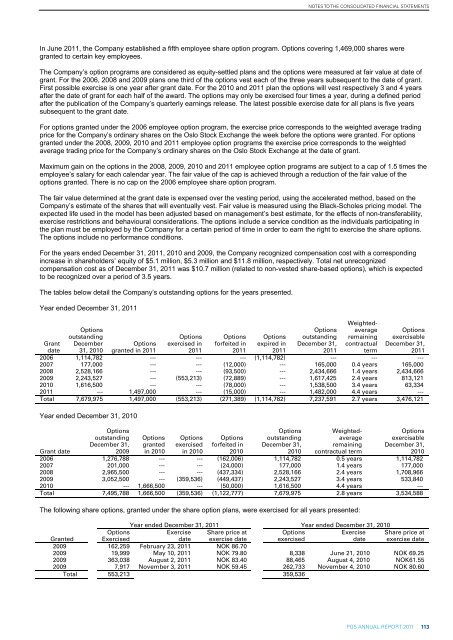
The tables below detail the Company’s outstanding options for the years presented.<br />
Year ended December 31, <strong>2011</strong><br />
Options<br />
outstanding<br />
December<br />
31, 2010<br />
Options<br />
exercised in<br />
<strong>2011</strong><br />
Options<br />
forfeited in<br />
<strong>2011</strong><br />
Options<br />
expired in<br />
<strong>2011</strong><br />
Options<br />
outstanding<br />
December 31,<br />
<strong>2011</strong><br />
Weightedaverage<br />
remaining<br />
contractual<br />
term<br />
Options<br />
exercisable<br />
December 31,<br />
<strong>2011</strong><br />
Grant<br />
date<br />
Options<br />
granted in <strong>2011</strong><br />
2006 1,114,782 --- --- --- (1,114,782) --- --- ---<br />
2007 177,000 --- --- (12,000) --- 165,000 0.4 years 165,000<br />
2008 2,528,166 --- --- (93,500) --- 2,434,666 1.4 years 2,434,666<br />
2009 2,243,527 --- (553,213) (72,889) --- 1,617,425 2.4 years 813,121<br />
2010 1,616,500 --- --- (78,000) --- 1,538,500 3.4 years 63,334<br />
<strong>2011</strong> --- 1,497,000 --- (15,000) --- 1,482,000 4.4 years ---<br />
Total 7,679,975 1,497,000 (553,213) (271,389) (1,114,782) 7,237,591 2.7 years 3,476,121<br />
Year ended December 31, 2010<br />
Options<br />
outstanding<br />
December 31,<br />
2009<br />
Options<br />
granted<br />
in 2010<br />
Options<br />
exercised<br />
in 2010<br />
Options<br />
forfeited in<br />
2010<br />
Options<br />
outstanding<br />
December 31,<br />
2010<br />
Weightedaverage<br />
remaining<br />
contractual term<br />
Options<br />
exercisable<br />
December 31,<br />
2010<br />
Grant date<br />
2006 1,276,788 --- --- (162,006) 1,114,782 0.5 years 1,114,782<br />
2007 201,000 --- --- (24,000) 177,000 1.4 years 177,000<br />
2008 2,965,500 --- --- (437,334) 2,528,166 2.4 years 1,708,966<br />
2009 3,052,500 --- (359,536) (449,437) 2,243,527 3.4 years 533,840<br />
2010 --- 1,666,500 --- (50,000) 1,616,500 4.4 years ---<br />
Total 7,495,788 1,666,500 (359,536) (1,122,777) 7,679,975 2.8 years 3,534,588<br />
The following share options, granted under the share option plans, were exercised for all years presented:<br />
Year ended December 31, <strong>2011</strong> Year ended December 31, 2010<br />
Granted<br />
Options<br />
Exercised<br />
Exercise<br />
date<br />
Share price at<br />
exercise date<br />
Options<br />
exercised<br />
Exercise<br />
date<br />
Share price at<br />
exercise date<br />
2009 162,259 February 23, <strong>2011</strong> NOK 86.70<br />
2009 19,999 May 10, <strong>2011</strong> NOK 79.80 8,338 June 21, 2010 NOK 69.25<br />
2009 363,038 August 2, <strong>2011</strong> NOK 83.40 88,465 August 4, 2010 NOK61.55<br />
2009 7,917 November 3, <strong>2011</strong> NOK 59.45 262,733 November 4, 2010 NOK 80.60<br />
Total 553,213 359,536<br />
<strong>PGS</strong> ANNUAL REPORT <strong>2011</strong> 42<br />
<strong>PGS</strong> <strong>Annual</strong> <strong>Report</strong> <strong>2011</strong> 113