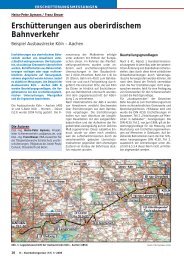
Air pollution short circuit effects of road traffic tunnel portals
Air pollution short circuit effects of road traffic tunnel portals
Air pollution short circuit effects of road traffic tunnel portals

You also want an ePaper? Increase the reach of your titles
YUMPU automatically turns print PDFs into web optimized ePapers that Google loves.
<strong>Air</strong> <strong>pollution</strong> <strong>short</strong> <strong>circuit</strong> <strong>effects</strong><br />
<strong>of</strong> <strong>road</strong> <strong>traffic</strong> <strong>tunnel</strong> <strong>portals</strong><br />
J.F.W. Koopmans<br />
Peutz bv, Mook, The Netherlands, f.koopmans@mook.peutz.nl<br />
In the design <strong>of</strong> <strong>road</strong> <strong>traffic</strong> <strong>tunnel</strong>s, the air quality inside <strong>of</strong> <strong>traffic</strong> <strong>tunnel</strong>s is an<br />
important factor, especially for long <strong>road</strong> <strong>traffic</strong> <strong>tunnel</strong>s. The air quality inside the<br />
<strong>traffic</strong> <strong>tunnel</strong>s usually depends on the emission <strong>of</strong> the cars passing through the <strong>traffic</strong><br />
<strong>tunnel</strong> and the rate <strong>of</strong> <strong>tunnel</strong> ventilation. In specific situations the concentration <strong>of</strong> air<br />
<strong>pollution</strong> in <strong>traffic</strong> <strong>tunnel</strong>s depends also strongly on aerodynamic <strong>short</strong> <strong>circuit</strong><br />
(unwanted recirculation) <strong>effects</strong> that occur around the <strong>tunnel</strong> <strong>portals</strong>. At certain<br />
meteorological conditions (wind speeds and wind directions), due to the influence <strong>of</strong><br />
wind vortexes, induced by the <strong>tunnel</strong> portal geometry, a significant part <strong>of</strong> the<br />
exhaust gasses, blown out <strong>of</strong> the <strong>tunnel</strong> portal <strong>of</strong> the outgoing <strong>traffic</strong>, is transported<br />
to the <strong>tunnel</strong> portal used by ingoing <strong>traffic</strong>. Even upstream <strong>effects</strong>, i.c. air <strong>pollution</strong><br />
<strong>effects</strong> upwind, can be seen. Without measures the concentrations <strong>of</strong> air <strong>pollution</strong> in<br />
the <strong>traffic</strong> <strong>tunnel</strong> can reach very high levels.<br />
In this study these <strong>effects</strong> are investigated for a new to be built <strong>road</strong> <strong>traffic</strong> <strong>tunnel</strong>.<br />
This <strong>tunnel</strong> with a total length <strong>of</strong> approximately 800 m, consists <strong>of</strong> 2 major <strong>tunnel</strong><br />
ducts, a four-lane duct and a two-lane duct, separated from each other by a closed<br />
wall. The four-lane duct is for one-way <strong>traffic</strong> in northern direction. The two-lane<br />
duct will be used during the morning rush hour for <strong>traffic</strong> in southern direction and in<br />
the evening rush for <strong>traffic</strong> in northern direction. Therefore, during the morning rush<br />
there will be <strong>traffic</strong> in opposite directions in the two ducts <strong>of</strong> the new <strong>tunnel</strong>. In these<br />
situations <strong>short</strong> <strong>circuit</strong> <strong>effects</strong> <strong>of</strong> air <strong>pollution</strong> coming from one <strong>tunnel</strong> duct to the<br />
other are known to take place, depending on the meteorological conditions and the<br />
design <strong>of</strong> the <strong>tunnel</strong> portal. The amount <strong>of</strong> <strong>short</strong> cut defines the amount <strong>of</strong> ventilation<br />
needed to control air quality inside the <strong>tunnel</strong> and should therefore be reduced as far<br />
as possible.<br />
In order to determine the amount <strong>of</strong> air <strong>pollution</strong> <strong>short</strong> <strong>circuit</strong>, a scale-model (1:150)<br />
<strong>of</strong> the <strong>tunnel</strong> was built. The <strong>short</strong> <strong>circuit</strong> <strong>effects</strong> near the <strong>tunnel</strong> <strong>portals</strong> were<br />
thoroughly researched, using tracer gas measurements executed in the Peutz<br />
atmospheric boundary layer wind<strong>tunnel</strong> in Mook in the Netherlands. For different<br />
meteorological conditions, the influence <strong>of</strong> different <strong>tunnel</strong> portal designs on the rate<br />
<strong>of</strong> <strong>short</strong> <strong>circuit</strong> was determined. Investigated were the influences <strong>of</strong> <strong>tunnel</strong> portal<br />
canopy, smoke fences and extended (individual) <strong>tunnel</strong> <strong>portals</strong>. In worst case<br />
situations the rate <strong>of</strong> air <strong>pollution</strong> <strong>short</strong> <strong>circuit</strong> can be over 50%, which means that<br />
the concentration <strong>of</strong> the air <strong>pollution</strong> transported to the ingoing <strong>tunnel</strong> portal, can be<br />
higher than 50% <strong>of</strong> the concentrations <strong>of</strong> the emitted air <strong>pollution</strong> <strong>of</strong> the outgoing<br />
<strong>tunnel</strong> portal. Based on the wind<strong>tunnel</strong>study, a specific <strong>tunnel</strong> design can be made in<br />
order to minimise the <strong>short</strong> <strong>circuit</strong> <strong>effects</strong>. With a good <strong>tunnel</strong> portal design the rate<br />
<strong>of</strong> air <strong>pollution</strong> <strong>short</strong> <strong>circuit</strong> <strong>effects</strong> can be limited to 10%. The results <strong>of</strong> the<br />
concentration measurements performed in the wind<strong>tunnel</strong> were illustrated using
smoke dispersion tests in the wind<strong>tunnel</strong>, which helps to understand the measured<br />
phenomena.<br />
1. INTRODUCTION<br />
Peutz bv performed wind <strong>tunnel</strong> research into the air <strong>pollution</strong> (aerodynamic) <strong>short</strong><br />
<strong>circuit</strong> occurring at the <strong>tunnel</strong> <strong>portals</strong> <strong>of</strong> a planned <strong>road</strong> <strong>traffic</strong> <strong>tunnel</strong> under a sea canal.<br />
The existing <strong>road</strong> <strong>traffic</strong> <strong>tunnel</strong> is the <strong>tunnel</strong> through which the motorway passes<br />
under the sea canal. The existing 2 x 2-lane <strong>tunnel</strong> is being stretched to the limit by<br />
the volume <strong>of</strong> <strong>traffic</strong> during the (morning and evening) rush hours. Therefore a new<br />
<strong>road</strong> <strong>traffic</strong> <strong>tunnel</strong> is planned to the east <strong>of</strong> the present <strong>road</strong> <strong>traffic</strong> <strong>tunnel</strong>.<br />
The planned <strong>road</strong> <strong>traffic</strong> <strong>tunnel</strong> has a total length <strong>of</strong> approximately 800 m and will<br />
consist <strong>of</strong> a <strong>tunnel</strong> with a total <strong>of</strong> 6 <strong>traffic</strong> lanes, i.e. a western tube with 2 lanes and an<br />
eastern tube with 4 lanes. The new 2-lane <strong>road</strong> <strong>traffic</strong> <strong>tunnel</strong> will be used during the<br />
morning rush hour for <strong>traffic</strong> travelling south. In this situation it is possible, owing to<br />
<strong>traffic</strong> moving in opposite directions in tubes located alongside one another, that<br />
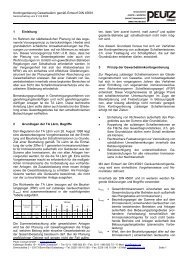
aerodynamic <strong>short</strong> <strong>circuit</strong> may occur. Figure 1 (mouth <strong>of</strong> the <strong>tunnel</strong> south) and figure<br />
2 (mouth <strong>of</strong> the <strong>tunnel</strong> north) show the situation <strong>of</strong> both <strong>tunnel</strong> <strong>portals</strong> <strong>of</strong> the new<br />
<strong>road</strong> <strong>traffic</strong> <strong>tunnel</strong>.<br />
This research concentrates on the air <strong>pollution</strong> <strong>short</strong> <strong>circuit</strong> occurring with the new<br />
<strong>road</strong> <strong>traffic</strong> <strong>tunnel</strong>. The research provides insight into the <strong>effects</strong> <strong>of</strong> a range <strong>of</strong><br />
structural variants for the <strong>tunnel</strong> <strong>portals</strong> on the air <strong>pollution</strong> <strong>short</strong> <strong>circuit</strong> at the <strong>tunnel</strong><br />
<strong>portals</strong>. As an indicator for the aerodynamic <strong>short</strong> <strong>circuit</strong> occurring, use was made <strong>of</strong><br />
the <strong>short</strong> <strong>circuit</strong> percentages determined by means <strong>of</strong> wind-<strong>tunnel</strong> research.<br />
Figure 1: Road Traffic Tunnel.<br />
Situation South, 2 lanes out, 4 lanes in.<br />
Figure 2: Road Traffic Tunnel.<br />
Situation North, 2 lanes in, 4 lanes out.
2. STARTING POINTS<br />
The planned <strong>road</strong> <strong>traffic</strong> <strong>tunnel</strong> will consist <strong>of</strong> a <strong>tunnel</strong> with a total <strong>of</strong> 6 <strong>traffic</strong> lanes,<br />
i.e. a western tube with 2 lanes and an eastern tube with 4 lanes, see figure 1 and 2.<br />
Following realisation <strong>of</strong> the <strong>road</strong> <strong>traffic</strong> <strong>tunnel</strong>, the <strong>traffic</strong> travelling south will pass<br />
through the present <strong>road</strong> <strong>traffic</strong> <strong>tunnel</strong> (2 x 2-lane) and <strong>traffic</strong> travelling north<br />
through the 4-lane tube <strong>of</strong> the new <strong>road</strong> <strong>traffic</strong> <strong>tunnel</strong>. The 2-lane tube <strong>of</strong> the new<br />
<strong>road</strong> <strong>traffic</strong> <strong>tunnel</strong> will be used during the morning rush hour for <strong>traffic</strong> travelling south<br />
and during the evening rush hour for <strong>traffic</strong> travelling north. This "variable direction<br />
<strong>of</strong> travel" means that a total <strong>of</strong> (existing <strong>tunnel</strong> and the additional new <strong>road</strong> <strong>traffic</strong><br />
<strong>tunnel</strong>) a minimum 4 and a maximum <strong>of</strong> 6 <strong>traffic</strong> lanes will be available, both in the<br />
southerly and northerly direction, allowing <strong>traffic</strong> flow to be improved.<br />
If the 2-lane tube <strong>of</strong> the new <strong>road</strong> <strong>traffic</strong> <strong>tunnel</strong> is used for <strong>traffic</strong> travelling south<br />
(morning rush hour), it is possible that <strong>traffic</strong> moving in opposite directions in<br />
adjacent tubes could lead to aerodynamic <strong>short</strong> <strong>circuit</strong> occurring. This means that<br />
some <strong>of</strong> the <strong>traffic</strong> emissions to the air, caused by the <strong>traffic</strong> emerging from the<br />
<strong>tunnel</strong>, can be directly taken into the other tube by the <strong>traffic</strong> driving into that <strong>tunnel</strong><br />
(due to both the wind and ventilation and the movement <strong>of</strong> the <strong>traffic</strong>). These <strong>effects</strong><br />
depend on the meteorological conditions (wind speed and wind direction) and the<br />
<strong>tunnel</strong> portal geometry. In order to determine the effect <strong>of</strong> air <strong>pollution</strong> <strong>short</strong> <strong>circuit</strong> a<br />
scale model (1:150) <strong>of</strong> the <strong>road</strong> <strong>traffic</strong> <strong>tunnel</strong> was built to test in the atmospheric<br />
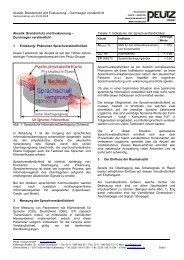
wind<strong>tunnel</strong>. Figure 3 shows the atmospheric boundary layer and a model <strong>of</strong> the <strong>tunnel</strong><br />
portal. The average (constant) air velocity in the tube <strong>of</strong> the new <strong>road</strong> <strong>traffic</strong> <strong>tunnel</strong><br />
should be 5 m/s (ventilation design criteria). The aerodynamic effect nearby the <strong>tunnel</strong><br />
portal depends strongly on the relation between the air velocity in the <strong>road</strong> <strong>traffic</strong><br />
<strong>tunnel</strong> and the (free field) wind speed at 10 metres high, so the research is made for<br />
different speed ratios.<br />
Figure 3: Atmospheric boundary layer and scale model <strong>of</strong> the <strong>tunnel</strong> portal.
3. WINDTUNNEL STUDY<br />
Figure 4 shows the atmospheric boundary layer wind<strong>tunnel</strong>, the model and<br />
surrounding equipment.<br />
Figure 4:<br />
Peutz atmospheric boundary layer wind<strong>tunnel</strong>, model and surrounding<br />
equipment.<br />
For the purposes <strong>of</strong> this research into the <strong>road</strong> <strong>traffic</strong> <strong>tunnel</strong>, the situation with 4-lane<br />
<strong>traffic</strong> in a northerly direction and 2-lane <strong>traffic</strong> in a southerly direction is relevant<br />
(morning rush hour). For the northern <strong>tunnel</strong> portal, the 4-lane exiting and 2-lane<br />
entering situation was therefore taken. For the southern <strong>tunnel</strong> portal, the situation<br />
considered was with 2 lanes <strong>of</strong> exiting <strong>traffic</strong> and 4 lanes <strong>of</strong> <strong>traffic</strong> entering the<br />
<strong>tunnel</strong>.<br />
In the possible situation with 6 lanes <strong>of</strong> <strong>traffic</strong> travelling in a northerly direction<br />
(evening rush hour), there would be no <strong>traffic</strong> travelling in the opposite direction and<br />
therefore no aerodynamic <strong>short</strong> <strong>circuit</strong> occurring.<br />
The concentration measurements for the flow research were carried out using tracer<br />
gas (isobutylene) in combination with PID monitors. The measured concentrations<br />
were being corrected for background concentrations.<br />
Variant research<br />
The following structural variants were considered in this research (for the north<br />
portal <strong>of</strong> each variant, a photo <strong>of</strong> the modified scale model is included, see Figures 5<br />
through 10):<br />
- Variant A: Present design (Figure 5)<br />
Smoke barrier with canopy (canopy 50% open).
Length smoke barrier approx. 20 metres;<br />
- Variant B: Present design without canopy (Figure 6)<br />
Without smoke barrier and canopy, central reservation with wall approx. 1 metre<br />
high;<br />
- Variant Cl: Present design with raised smoke barrier (Figure 7)<br />
As A, in addition smoke barrier raised to ground level;<br />
- Variant C2: Present design with lengthened and raised smoke barrier (Figure 8)<br />
As Cl, raised smoke barrier with approx. 20 metres <strong>of</strong> extra length (total approx.<br />
40 metres);<br />
- Variant Dl: Present design with extended exit (Figure 9)<br />
As A, in addition tube exit extended by approx. 20 metres;<br />
- Variant D2: Present design with extended exit extension (Figure 10)<br />
As Dl, tube exit extended by a further approx. 20 metres (total approx. 40 metres);<br />
Figure 5 (variant A) Figure 6 (variant B)<br />
Figure 7 (variant C1) Figure 8 (variant C2)<br />
Figure 9 (variant D1) Figure 10 (variant D2)<br />
The extent <strong>of</strong> air <strong>pollution</strong> <strong>short</strong> <strong>circuit</strong> is determined in part by the relationship<br />
between the ventilation speed in the tube (V t , constant 5 m/s) and the wind speed in
the environment at 10 metres high (V w , variable). For the purposes <strong>of</strong> this research,<br />
the following 3 speed ratios were applied:<br />
V w / V t = 2 wind speed 10 m/s, ventilation speed 5 m/s<br />
V w / V t = 1 wind speed 5 m/s, ventilation speed 5 m/s<br />
V w / V t ~ 0 wind speed ~ 0 m/s, ventilation speed 5 m/s<br />
It should be however noted that, owing to measuring circumstances, the lowest speed<br />
ratio was approximated by applying V w = 0.6 m/s at a V t <strong>of</strong> 5 m/s (in fact V w /V t =<br />
0.12).<br />
This wind-<strong>tunnel</strong> research therefore involved 36 variants, i.e. 6 structural variants for<br />
3 different speed ratios for both <strong>tunnel</strong> <strong>portals</strong>. To verify the measurements, a set <strong>of</strong><br />
control measurements were performed (reproducibility).<br />
Measurement results air <strong>pollution</strong> <strong>short</strong> <strong>circuit</strong><br />
The concentration measurements in the wind-<strong>tunnel</strong> resulted for each structural<br />
variant, each speed ratio (V w /V t ) and each wind direction in an emission concentration<br />
at the exit (representing concentration <strong>of</strong> exhaust gasses resulting from the <strong>traffic</strong><br />
exiting the <strong>tunnel</strong> tube) and an immission concentration at the entrance <strong>of</strong> the other<br />
tube. The immission concentrations were determined downstream in the tube. In<br />
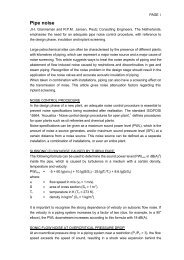
figure 11 an example <strong>of</strong> a measured situation is given. The measurements revealed<br />
that the aerodynamic <strong>short</strong> <strong>circuit</strong> occurring at the speed ratio V w / V t ~ 0 is virtually<br />
unaffected by the wind direction, owing to the relatively low wind speed.<br />
Figure 11:<br />
Example <strong>of</strong> measured immission concentration (ppm) downstream in<br />
<strong>road</strong> <strong>traffic</strong> <strong>tunnel</strong> tube as a function <strong>of</strong> wind direction (°): V w / V t = 2,<br />
variant A, emission concentration from emitting tube approximately<br />
800 ppm.
4. CALCULATIONS<br />
4.1. Calculation <strong>of</strong> air <strong>pollution</strong> <strong>short</strong> <strong>circuit</strong><br />
For a given wind speed and wind direction, the emission concentration at the exit and<br />
the immission concentration downstream from the entrance can be used to calculate<br />
the <strong>short</strong> <strong>circuit</strong> percentage. The formula below is used for this:<br />
Cimmission<br />
R = •100%<br />
[1]<br />
C<br />
emission<br />
Whereby:<br />
-R = <strong>short</strong> <strong>circuit</strong> percentage [%]<br />
-C emission = emission concentration exit [ppm];<br />
-C immission = immission concentration entrance (downstream, corrected for<br />
background concentration ) [ppm].<br />
4.2. Results <strong>of</strong> the calculations for <strong>short</strong> <strong>circuit</strong><br />
The <strong>short</strong> <strong>circuit</strong> percentage is determined on the basis <strong>of</strong> the emission and immission<br />
concentrations found for each measurement, using formula [ 1 ]. The minimum and<br />
maximum air <strong>pollution</strong> <strong>short</strong> <strong>circuit</strong> percentages occurring are given in table 1.<br />
Table 1: minimum and maximum air <strong>pollution</strong> <strong>short</strong> <strong>circuit</strong> percentages for several<br />
design variants; <strong>tunnel</strong> portal north and south.<br />
Tunnel portal north<br />
V w = 10 m/s, V t = 5 m/s V w = 5 m/s, V t = 5 m/s V w = 0,6 m/s, V t = 5 m/s<br />
variant* minimum maximum minimum maximum minimum maximum<br />
A ca. 1% ca. 42% ca. 5% ca. 17% ca. 1% ca. 6%<br />
B ca. 8% ca. 53% ca. 8% ca. 35% ca. 10% ca 12%<br />
C1 ca. 1% ca. 34% ca. 2% ca. 19% ca. 1% ca. 2%<br />
C2 ca. 0% ca. 20% ca. 1% ca. 17% ca. 1% ca. 2%<br />
D1 ca. 1% ca. 32% ca. 1% ca. 20% ca. 0% ca. 1%<br />
D2 ca. 0% ca. 18% ca. 1% ca. 13% ca. 1% ca. 1%<br />
Tunnel portal south<br />
V w = 10 m/s, V t = 5 m/s V w = 5 m/s, V t = 5 m/s V w = 0,6 m/s, V t = 5 m/s<br />
variant* minimum maximum minimum maximum minimum maximum<br />
A ca. 1% ca. 26% ca. 4% ca. 15% ca. 2% ca. 3%<br />
B ca. 6% ca. 39% ca. 7% ca. 27% ca. 8% ca 10%<br />
C1 ca. 2% ca. 21% ca. 2% ca. 15% ca. 1% ca. 2%<br />
C2 ca. 1% ca. 14% ca. 2% ca. 15% ca. 1% ca. 4%<br />
D1 ca. 2% ca. 22% ca. 2% ca. 14% ca. 1% ca. 2%<br />
D2 ca. 2% ca. 12% ca. 1% ca. 10% ca. 1% ca. 1%
4.3. Reproducibility<br />
The accuracy <strong>of</strong> the concentration measurements is approx. 5 ppm, which leads to a<br />
level <strong>of</strong> inaccuracy in the <strong>short</strong> <strong>circuit</strong> percentages <strong>of</strong> 1 to 2%.<br />
A comparison <strong>of</strong> the <strong>short</strong> <strong>circuit</strong> percentages from control measurements with the<br />
<strong>short</strong> <strong>circuit</strong> percentages from the standard measurements shows that these can be<br />
reproduced with sufficient accuracy (+/- 2%).<br />
5. CONSIDERATIONS<br />
From the measurements and calculations made for the planned <strong>road</strong> <strong>traffic</strong> <strong>tunnel</strong>, it<br />
appears that the maximum air <strong>pollution</strong> (aerodynamic) <strong>short</strong> <strong>circuit</strong> occurs at a speed<br />
ratio <strong>of</strong> V w / V t = 2. The <strong>short</strong> <strong>circuit</strong> occurring at the other speeds tested (V w / V t = 1<br />
and V w / V t ~ 0) is generally (considerably) lower.<br />
At the north portal, the maximum air <strong>pollution</strong> <strong>short</strong> <strong>circuit</strong> occurs with a northwesterly<br />
wind (300°). At the south portal, the maximum aerodynamic <strong>short</strong> <strong>circuit</strong><br />
occurs with a south-easterly wind (120°). This corresponds to expectations in this<br />
respect; the occurrence <strong>of</strong> "slipstream <strong>effects</strong>" at the mouth <strong>of</strong> the <strong>tunnel</strong> in the <strong>tunnel</strong><br />
trough in these situations means that a significant portion <strong>of</strong> the emissions from the<br />
4-lane tube is sucked back into the 2-lane tube.<br />
Table 1 shows that at the north portal, with variant A (present design), the<br />
aerodynamic <strong>short</strong> <strong>circuit</strong> would reach a maximum <strong>of</strong> approx. 42%. At the south<br />
portal, the <strong>short</strong> <strong>circuit</strong> in this variant would be a maximum <strong>of</strong> approx. 26%.<br />
In the case <strong>of</strong> variant B (present design without canopy), the air <strong>pollution</strong> <strong>short</strong> <strong>circuit</strong><br />
would reach a maximum <strong>of</strong> approx. 53% at the north portal and approx. 39% at the<br />
south portal.<br />
In the case <strong>of</strong> Cl (present design with raised smoke barrier), the air <strong>pollution</strong> <strong>short</strong><br />
<strong>circuit</strong> would reach a maximum <strong>of</strong> approx. 34% at the north portal and approx. 21%<br />
at the south portal.<br />
In the case <strong>of</strong> C2 (present design with extended and raised smoke barrier), the air<br />
<strong>pollution</strong> <strong>short</strong> <strong>circuit</strong> would reach a maximum <strong>of</strong> approx. 20% at the north portal and<br />
approx. 14% at the south portal.<br />
In the case <strong>of</strong> Dl (present design with extended exit), the air <strong>pollution</strong> <strong>short</strong> <strong>circuit</strong><br />
would reach a maximum <strong>of</strong> approx. 32% at the north portal and approx. 22% at the<br />
south portal.<br />
In the case <strong>of</strong> D2 (present design with extended exit extension), the air <strong>pollution</strong> <strong>short</strong><br />
<strong>circuit</strong> would reach a maximum <strong>of</strong> approx. 18% at the north portal and approx. 12% at<br />
the south portal.<br />
The above considerations per variant show that the maximum <strong>short</strong> <strong>circuit</strong> occurring<br />
at the south portal is in all cases less than that at the north portal, which is a<br />
consequence <strong>of</strong> the situations considered above. For the northern <strong>tunnel</strong> portal, the 4-<br />
lane exit and 2-lane entrance situation was considered, while for the southern <strong>tunnel</strong><br />
portal the 2-lane exit and 4-lane entrance situation was considered. The determining<br />
slipstream in the former situation is present over a larger polluted area <strong>of</strong> emission<br />
than in the latter, whereby in the former situation a larger portion <strong>of</strong> the emissions<br />
will be sucked into the other tube by means <strong>of</strong> (aerodynamic) <strong>short</strong> <strong>circuit</strong>.
This research has revealed that the most air <strong>pollution</strong> <strong>short</strong> <strong>circuit</strong> occurs in variant B<br />
(present design without canopy).<br />
Virtually the same amount <strong>of</strong> <strong>short</strong> <strong>circuit</strong> is also present in variants Cl (present<br />
design with raised smoke barrier) and variant Dl (present design with extended exit),<br />
but less than with variant A (present design). Raising the smoke barrier to ground<br />
level would reduce the maximum air <strong>pollution</strong> <strong>short</strong> <strong>circuit</strong> occurring in relation to<br />
variant A (present design) by approx. 5 - 8%; extending the exit by approx. 20 metres<br />
reduces the maximum air <strong>pollution</strong> <strong>short</strong> <strong>circuit</strong> occurring in relation to variant A<br />
(present design) by approx. 4 - 10%, all depending on the <strong>tunnel</strong> portal under<br />
consideration (north or south).<br />
In the case <strong>of</strong> variant C2 (present design with extended and raised smoke barrier) and<br />
variant D2 (present design with extended exit extension), the amount <strong>of</strong> <strong>short</strong> <strong>circuit</strong><br />
is virtually the same, but less than in the case <strong>of</strong> variants Cl and Dl. By extending<br />
the raised smoke barrier by approx. 20 metres, the maximum aerodynamic <strong>short</strong><br />
<strong>circuit</strong> occurring in relation to variant Cl is reduced by a further approx. 7 - 14%. In<br />
relation to variant A (present design), the maximum <strong>short</strong> <strong>circuit</strong> occurring is reduced<br />
by approx. 12 - 22%. By lengthening the exit by another approx. 20 metres (total<br />
approx. 40 metres), the maximum aerodynamic <strong>short</strong> <strong>circuit</strong> occurring in relation to<br />
variant Dl is reduced by a further approx. 10 - 14%. In relation to variant A (present<br />
design), the maximum <strong>short</strong> <strong>circuit</strong> occurring is reduced by approx. 14 - 24%.).<br />
6. CONCLUSIONS<br />
On the basis <strong>of</strong> the starting points, the wind-<strong>tunnel</strong> research and the calculations<br />
concerning the aerodynamic <strong>short</strong> <strong>circuit</strong> occurring at the <strong>tunnel</strong> <strong>portals</strong> <strong>of</strong> the planned<br />
<strong>road</strong> <strong>traffic</strong> <strong>tunnel</strong>, it can be said that:<br />
− the maximum air <strong>pollution</strong> <strong>short</strong> <strong>circuit</strong> occurring for the present design would be<br />
approx. 42%;<br />
− if the present design were to be implemented without canopy and smoke barrier,<br />
the maximum air <strong>pollution</strong> <strong>short</strong> <strong>circuit</strong> would increase to significant more than<br />
50%;<br />
− raising the smoke barrier (to ground level) would reduce the aerodynamic <strong>short</strong><br />
<strong>circuit</strong> in relation to the present design by approx. 5 - 8%, depending on the<br />
<strong>tunnel</strong> portal in question (north or south);<br />
− extending the exit (by approx. 20 metres) would reduce the aerodynamic <strong>short</strong><br />
<strong>circuit</strong> in relation to the present design by approx. 4 - 10%%, depending on the<br />
<strong>tunnel</strong> portal in question (north or south);<br />
− extending the raised smoke barrier to approx. 40 metres would reduce the<br />
aerodynamic <strong>short</strong> <strong>circuit</strong> in relation to the present design by approx. 12 - 22%%,<br />
depending on the <strong>tunnel</strong> portal in question (north or south);<br />
− extending the exit to approx. 40 metres would reduce the aerodynamic <strong>short</strong><br />
<strong>circuit</strong> in relation to the present design by approx. 14 - 24%%, depending on the<br />
<strong>tunnel</strong> portal in question (north or south).<br />
On the basis <strong>of</strong> the research carried out, insight has been obtained into the various<br />
flow <strong>effects</strong>, such as slipstream effect and thinning so that, taking undesired <strong>short</strong>
<strong>circuit</strong> <strong>effects</strong> into account, a well-considered choice <strong>of</strong> structural variant can be<br />
made.<br />
REFERENCES<br />
Chock, D.P., Pollutant dispersion near <strong>road</strong>ways. Experiments and modelling The<br />
Science <strong>of</strong> the Total Environment, 25 (1982) p. 111-132.<br />
Wendeler, J.U., Untersuchung des Kurzschluss-Luftstromes bei der Längsbelüftung<br />
von Strassen<strong>tunnel</strong>n. Voth Forschung und Konstruktion, 17 (Mai 1967) p. 4.1-4.6.<br />
Baumann, H.O., Graf, E., Strömungskurzschluss zwischen Tunnelportalen Schindler<br />
Haerter AG (Zürich), Paper E2, 3rd International Symposium on Aerodynamics and<br />
Ventilation <strong>of</strong> Vehicle Tunnels, Sheffield, England, March 1979.