Conclusion Get more connected.
Conclusion Get more connected.
Conclusion Get more connected.

Create successful ePaper yourself
Turn your PDF publications into a flip-book with our unique Google optimized e-Paper software.
effects. The number of factors was<br />
set between 2 and 6. The validation<br />
option was set to Full Cross<br />
Validation (see later), and the Expert<br />
Assist (see later) was selected for the<br />
calibration. The first method was built<br />
using the full range (20 – 270 OH<br />
number) of samples. However, the<br />
second method was built covering a<br />
much smaller range of OH number<br />
(25 – 60). The second method was<br />
able to predict <strong>more</strong> accurately<br />
values within its low OH range. The<br />
first method however, was able to<br />
predict values better for the samples<br />
lying higher in the range, but was not<br />
as accurate for the mid-range values.<br />
Results and discussion<br />
The absorbance spectra for the<br />
polyol standards and the unknowns<br />
were collected and two examples,<br />
representing extremes of OH number,<br />
are shown in Figure 1. The spectral<br />
variations at approximately 7200 –<br />
6670 and 5300 – 4760 cm -1 (1389 –<br />
1499 and 1887 – 2100 nm) clearly<br />
show differing OH number, and<br />
correspond to polymeric O-H first<br />
overtone and O-H combination bands<br />
respectively. Temperature variation is<br />
important to consider in the analysis<br />
of polyols and other NIR applications.<br />
This application did not require<br />
temperature control, and heating<br />
was not necessary as all the samples<br />
were liquid at room temperature.<br />
However, care was taken to ensure<br />
that the sample temperatures were<br />
allowed to equilibrate and the<br />
samples were left in the beam for the<br />
same length of time before each<br />
measurement was made.<br />
The QUANT+ software is capable<br />
of modeling the concentrations in<br />
terms of the spectral contributions<br />
relevant to OH determination. This<br />
algorithm can extract the factors in<br />
the calibration that are not responsible<br />
for the specific OH value (the<br />
chemical constituent of interest)<br />
by eliminating the corresponding<br />
dimensions (spectral absorptions)<br />
from the model.<br />
The error present in an OH<br />
evaluation due to hydroxyl band of<br />
moisture absorbed in the sample can<br />
then therefore be minimized by<br />
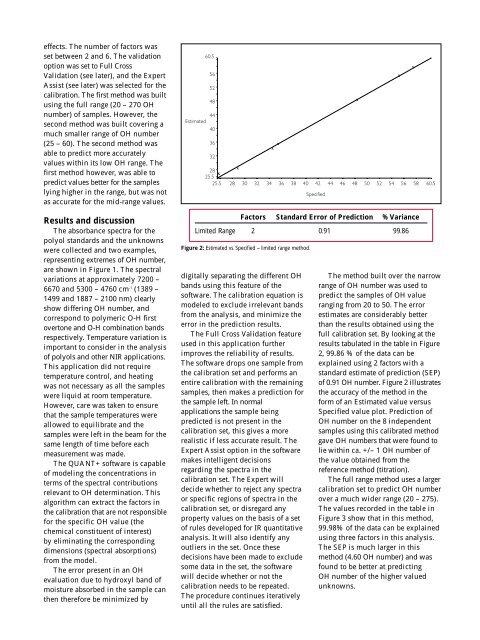
Factors Standard Error of Prediction % Variance<br />
Limited Range 2 0.91 99.86<br />
Figure 2: Estimated vs. Specified – limited range method.<br />
digitally separating the different OH<br />
bands using this feature of the<br />
software. The calibration equation is<br />
modeled to exclude irrelevant bands<br />
from the analysis, and minimize the<br />
error in the prediction results.<br />
The Full Cross Validation feature<br />
used in this application further<br />
improves the reliability of results.<br />
The software drops one sample from<br />
the calibration set and performs an<br />
entire calibration with the remaining<br />
samples, then makes a prediction for<br />
the sample left. In normal<br />
applications the sample being<br />
predicted is not present in the<br />
calibration set, this gives a <strong>more</strong><br />
realistic if less accurate result. The<br />
Expert Assist option in the software<br />
makes intelligent decisions<br />
regarding the spectra in the<br />
calibration set. The Expert will<br />
decide whether to reject any spectra<br />
or specific regions of spectra in the<br />
calibration set, or disregard any<br />
property values on the basis of a set<br />
of rules developed for IR quantitative<br />
analysis. It will also identify any<br />
outliers in the set. Once these<br />
decisions have been made to exclude<br />
some data in the set, the software<br />
will decide whether or not the<br />
calibration needs to be repeated.<br />
The procedure continues iteratively<br />
until all the rules are satisfied.<br />
The method built over the narrow<br />
range of OH number was used to<br />
predict the samples of OH value<br />
ranging from 20 to 50. The error<br />
estimates are considerably better<br />
than the results obtained using the<br />
full calibration set. By looking at the<br />
results tabulated in the table in Figure<br />
2, 99.86 % of the data can be<br />
explained using 2 factors with a<br />
standard estimate of prediction (SEP)<br />
of 0.91 OH number. Figure 2 illustrates<br />
the accuracy of the method in the<br />
form of an Estimated value versus<br />
Specified value plot. Prediction of<br />
OH number on the 8 independent<br />
samples using this calibrated method<br />
gave OH numbers that were found to<br />
lie within ca. +/– 1 OH number of<br />
the value obtained from the<br />
reference method (titration).<br />
The full range method uses a larger<br />
calibration set to predict OH number<br />
over a much wider range (20 – 275).<br />
The values recorded in the table in<br />
Figure 3 show that in this method,<br />
99.98% of the data can be explained<br />
using three factors in this analysis.<br />
The SEP is much larger in this<br />
method (4.60 OH number) and was<br />
found to be better at predicting<br />
OH number of the higher valued<br />
unknowns.