Conclusion Get more connected.
Conclusion Get more connected.
Conclusion Get more connected.

Create successful ePaper yourself
Turn your PDF publications into a flip-book with our unique Google optimized e-Paper software.
Once a set of reference samples is<br />
obtained, it is advisable to divide these<br />
into two sets; a set for calibration, and<br />
a set to test the calibration often<br />
referred to as the validation set. The<br />
suitability of the samples used in the<br />
calibration set is particularly important<br />
since it must closely match the<br />
product being manufactured at the<br />
production site. A calibration set must<br />
contain enough samples to enable the<br />
estimation of the calibration constants,<br />
and the range of the samples should<br />
be representative of the range of<br />
future samples.<br />
A calibration, based on ‘ideal’<br />
samples prepared in a completely<br />
stable environment, may give very<br />
small errors when used for similar<br />
samples. However, when the<br />
calibration is used to produce a value<br />
for a real product, the accuracy is<br />
often degraded. Further<strong>more</strong>, a tradeoff<br />
exists between calibration sets<br />
covering a very wide range of OH<br />
number and the accuracy with which<br />
OH number can be predicted.<br />
Therefore, it has been found that the<br />
accuracy increases when using a<br />
method calibrated over a <strong>more</strong><br />
restricted (ca. 50) OH range.<br />
The PLS (Partial Least Squares)<br />
method available in the Perkin-Elmer<br />
QUANT+ TM software uses the NIR<br />
spectra recorded to derive a<br />
calibration. This equation is then<br />
used to predict the value of the<br />
constituent of interest of future<br />
samples using their NIR spectra. An<br />
application that is analyzed by using<br />
spectroscopy is <strong>more</strong> precise than<br />
when measured by other methods.<br />
However, the accuracy of the method<br />
in predicting the true value of the<br />
future samples is dependant upon<br />
the accuracy of the reference method.<br />
It is therefore important to stress<br />
that the steps involved in setting up<br />
the calibration are crucial to the<br />
success of the NIR application. This<br />
is particularly true for the collection<br />
of suitable calibration standards,<br />
and the analysis of the calibration<br />
set by titration. This step should be<br />
carried out with an objective of<br />
producing the greatest possible<br />
accuracy.<br />
A suggestion for achieving this<br />
accuracy is to perform the titration<br />
in duplicate or triplicate. However,<br />
it is <strong>more</strong> important to have as many<br />
samples in the calibration set as<br />
possible. In comparison, it is better<br />
to collect twice as many calibration<br />
samples than it is to perform the<br />
reference analysis of the original<br />
calibration standards in duplicate.<br />
The most ideal, though costly and<br />
time consuming, situation would<br />
allow for the inclusion of a large set<br />
of calibration standards, with each<br />
sample analyzed in duplicate or<br />
triplicate.<br />
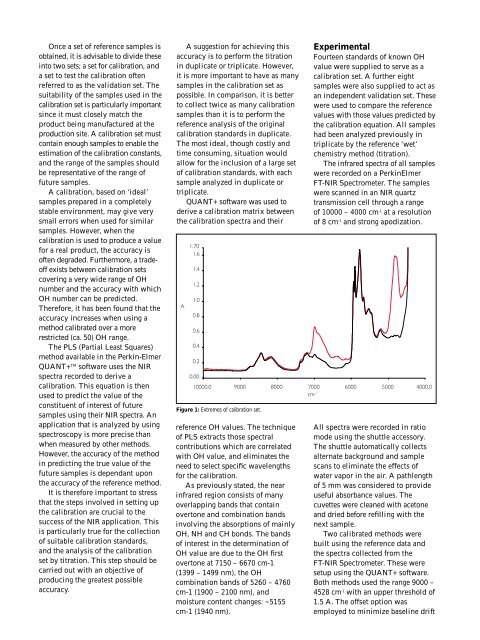
QUANT+ software was used to<br />
derive a calibration matrix between<br />
the calibration spectra and their<br />
Figure 1: Extremes of calibration set.<br />
reference OH values. The technique<br />
of PLS extracts those spectral<br />
contributions which are correlated<br />
with OH value, and eliminates the<br />
need to select specific wavelengths<br />
for the calibration.<br />
As previously stated, the near<br />
infrared region consists of many<br />
overlapping bands that contain<br />
overtone and combination bands<br />
involving the absorptions of mainly<br />
OH, NH and CH bonds. The bands<br />
of interest in the determination of<br />
OH value are due to the OH first<br />
overtone at 7150 – 6670 cm-1<br />
(1399 – 1499 nm), the OH<br />
combination bands of 5260 – 4760<br />
cm-1 (1900 – 2100 nm), and<br />
moisture content changes: ~5155<br />
cm-1 (1940 nm).<br />
Experimental<br />
Fourteen standards of known OH<br />
value were supplied to serve as a<br />
calibration set. A further eight<br />
samples were also supplied to act as<br />
an independent validation set. These<br />
were used to compare the reference<br />
values with those values predicted by<br />
the calibration equation. All samples<br />
had been analyzed previously in<br />
triplicate by the reference ‘wet’<br />
chemistry method (titration).<br />
The infrared spectra of all samples<br />
were recorded on a PerkinElmer<br />
FT-NIR Spectrometer. The samples<br />
were scanned in an NIR quartz<br />
transmission cell through a range<br />
of 10000 – 4000 cm -1 at a resolution<br />
of 8 cm -1 and strong apodization.<br />
All spectra were recorded in ratio<br />
mode using the shuttle accessory.<br />
The shuttle automatically collects<br />
alternate background and sample<br />
scans to eliminate the effects of<br />
water vapor in the air. A pathlength<br />
of 5 mm was considered to provide<br />
useful absorbance values. The<br />
cuvettes were cleaned with acetone<br />
and dried before refilling with the<br />
next sample.<br />
Two calibrated methods were<br />
built using the reference data and<br />
the spectra collected from the<br />
FT-NIR Spectrometer. These were<br />
setup using the QUANT+ software.<br />
Both methods used the range 9000 –<br />
4528 cm -1 with an upper threshold of<br />
1.5 A. The offset option was<br />
employed to minimize baseline drift