Capital Flight from North African Countries - Political Economy ...
Capital Flight from North African Countries - Political Economy ...
Capital Flight from North African Countries - Political Economy ...

You also want an ePaper? Increase the reach of your titles
YUMPU automatically turns print PDFs into web optimized ePapers that Google loves.
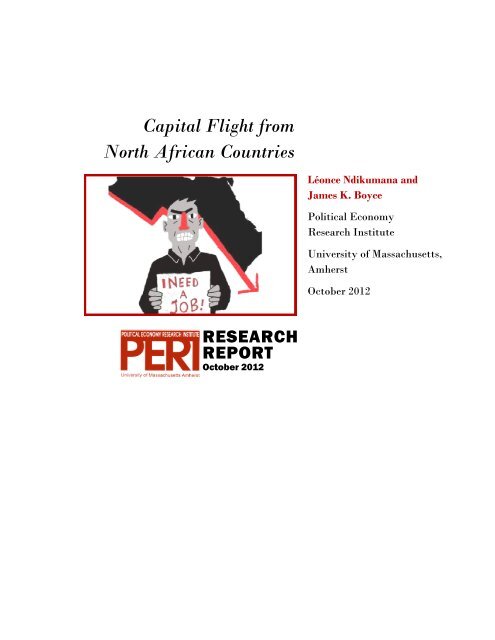
<strong>Capital</strong> <strong>Flight</strong> <strong>from</strong><br />
<strong>North</strong> <strong>African</strong> <strong>Countries</strong><br />
Léonce Ndikumana and<br />
James K. Boyce<br />
<strong>Political</strong> <strong>Economy</strong><br />
Research Institute<br />
University of Massachusetts,<br />
Amherst<br />
October 2012<br />
RESEARCH<br />
REPORT<br />
October 2012
TABLE OF CONTENTS<br />
Introduction 1<br />
Estimating capital flight 2<br />
The ‘residual’ measure of capital flight 2<br />
Trade misinvoicing and unrecorded remittances 3<br />
Real capital flight and stock of capital flight 4<br />
Results 5<br />
Volume of capital flight <strong>from</strong> the region 5<br />
Highlights by country 6<br />
Implications of capital flight <strong>from</strong> <strong>North</strong> <strong>African</strong> countries 9<br />
The illicit nature of unrecorded flows 9<br />
Social costs 10<br />
Equity and political economy implications 11<br />
Concluding remarks 11<br />
Table 1: <strong>Capital</strong> flight: real values and with imputed interest, 1970-2010 5<br />
Table 2: Components of capital flight, total 1970-2010 6<br />
Figure 1: <strong>Capital</strong> flight <strong>from</strong> Algeria <strong>from</strong> 1971-2009 7<br />
Figure 3: <strong>Capital</strong> flight <strong>from</strong> Egypt <strong>from</strong> 1970-2010 8<br />
Figure 3: <strong>Capital</strong> flight <strong>from</strong> Morocco <strong>from</strong> 1970-2010 8<br />
Figure 4: <strong>Capital</strong> flight <strong>from</strong> Tunisia <strong>from</strong> 1970-2010 9<br />
Table A.1: Variables and data sources used in the computations 12<br />
Table A.2: <strong>Capital</strong> flight by country, 1970-2010 13<br />
References 14<br />
About the authors 15<br />
About PERI 15
INTRODUCTION<br />
<strong>North</strong> <strong>African</strong> countries have traditionally outperformed their sister nations south<br />
of the Sahara in terms of economic growth, enabling them to reach the middleincome<br />
status and drive down poverty to much lower levels. <strong>North</strong> Africa has enjoyed<br />
relatively stable growth rates, averaging over 3 percent per annum over the<br />
2005-2011 period. Per capita income in the region ranges <strong>from</strong> $2780 in Egypt to<br />
about $10,000 in Libya, compared to an average of $1445 for Sub-Saharan Africa<br />
(SSA). The 2010 Human Development Report profiled <strong>North</strong> <strong>African</strong> countries as<br />
success stories in non-income human development, especially education and health.<br />
Rodríguez and Samman (2010) called it the ‘<strong>North</strong> <strong>African</strong> Miracle’.<br />
Since the end of 2010, however, it has become evident that this apparently positive<br />
economic record concealed structural and institutional deficiencies that eventually<br />
brought down the strong regimes. The <strong>North</strong> <strong>African</strong> ‘economic model’ proved to<br />
be unsustainable, mainly because of pervasive inequities in the distribution of<br />
wealth and power. Revolutions ensued.<br />
Glowing reports on economic performance also hid the problem of illicit capital outflows<br />
that fueled the accumulation of private wealth by political elites and their<br />
business associates. As their regimes collapsed, the media began to be flooded by<br />
reports of large amounts of assets held abroad by Tunisia’s Ben Ali, Libya’s Qaddafi,<br />
Egypt’s Mubarak and their families. Qaddafi’s wealth reportedly includes assets<br />
in the United States (estimated at $37 billion), United Kingdom (£12 billion), The<br />
Netherlands ($2.1 billion), Austria ($1.8 billion), Sweden ($1.6 billion), and Switzerland<br />
($416 million). 1 No doubt more is yet to be discovered.<br />
<strong>North</strong> <strong>African</strong> rulers built their illicit wealth largely <strong>from</strong> the appropriation of public<br />
assets, through opaque privatization processes, erection of private monopolies in<br />
key sectors of the economy, and outright embezzlement of government funds, possibly<br />
including externally borrowed loans and overseas development assistance.<br />
Thus, it is understandable that post-revolution governments should ask questions<br />
about the legitimacy of the debts inherited <strong>from</strong> former regimes. The new Government<br />
of Tunisia is demanding an audit of the debts incurred under the regime of<br />
Zine El Abidine Ben Ali. 2 If this is accomplished successfully, other countries in the<br />
region may follow suit.<br />
This report provides estimates of the total amount of capital flight <strong>from</strong> four <strong>North</strong><br />
<strong>African</strong> countries for which we have adequate data – Algeria, Egypt, Morocco and<br />
Tunisia – <strong>from</strong> 1970 to 2010. 3 Despite evidence that Libya, too, has experienced<br />
large-scale capital flight, we could not include it in our sample due to lack of data<br />
on debt. This report extends our previous work on capital flight that has focused<br />
* The authors are grateful to Theresa Owusu-Danso and Varun Shetty for excellent research assistance.<br />
1 Stolen Asset Recovery Initiative (StAR): http://star.worldbank.org/corruption-cases/node/18438.<br />
2 «La Tunisie refuse les dettes héritées de la dictature.» Le Monde 17 July 2012.<br />
3 There is no adequate data for 1970 and 2010 for Algeria; therefore the series covers 1971-2009.<br />
CAPITAL FLIGHT FROM NORTH AFRICAN COUNTRIES • PAGE 1
ESTIMATING CAPITAL FLIGHT<br />
on SSA countries (Ndikumana and Boyce 2011a, 2011b, 2010, 2003, 1998; Boyce<br />
and Ndikumana 2001), and contributes to the growing literature that documents<br />
massive illicit financial flows <strong>from</strong> developing countries in general and <strong>African</strong> continent<br />
in particular (Henry 2012; UNDP 2011, Kar and Curcio 2011; Kar 2010; Kar<br />
and Cartwright-Smith 2010).<br />
Our results indicate that over the 40 years, the four countries together lost more<br />
than $450 billion (in constant 2010 dollars) through capital flight. The largest<br />
amount is <strong>from</strong> Algeria ($267 billion), followed by Morocco ($88 billion), Egypt ($60<br />
billion) and Tunisia ($39 billion). The time-series evidence shows that capital flight<br />
is not a new phenomenon, but has been a systematic problem through the successive<br />
regimes that ruled these countries. The Tunisian case is something of an exception,<br />
in that the Ben Ali regime (1987-2010) accounts for over 87 percent of the Tunisia’s<br />
cumulative capital flight recorded over the four-decade period. This report underscores<br />
the economic significance of <strong>North</strong> <strong>African</strong> capital flight, and why this issue<br />
warrants urgent attention <strong>from</strong> national stakeholders and the global community.<br />
The ‘residual’ measure of capital flight<br />
<strong>Capital</strong> flight is defined here as the net unrecorded capital flows between a country<br />
and the rest of the world. The starting point for our estimates is the country’s Balance<br />
of Payments (BoP) statistics, which record inflows and outflows of foreign exchange.<br />
Because the BoP data have been found often to under-report external<br />
borrowing, data on debt flows are instead taken <strong>from</strong> the World Bank’s Global Development<br />
Finance database (www.worldbank.org). The difference between recorded<br />
inflows and the recorded uses of foreign exchange provides the baseline ‘residual’<br />
measure of capital flight (Erbe 1985, World Bank 1985). It is computed as follows:<br />
KF it = ∆DEBTADJ it<br />
+ DFI it<br />
– (CA it +∆RES it<br />
) (1)<br />
where ∆DEBTADJ it<br />
is the change in the stock of external debt outstanding (adjusted<br />
for exchange rate fluctuations), 4 DFI is net direct foreign investment, CA is the<br />
current account deficit, and ∆RES is net additions to the stock of foreign reserves.<br />
Only a fraction of the ‘leakages’ revealed by this calculation can be attributed to<br />
statistical errors (Lane and Milesi-Ferretti 2007). Much of the unrecorded flows results<br />
<strong>from</strong> illicit transactions, pursued for a variety of motives including money<br />
laundering, tax evasion and tax avoidance. These have been accompanied and in<br />
some cases exacerbated by the increasing complexity of financial transactions resulting<br />
<strong>from</strong> globalization, the increasing sophistication of operations of multinational<br />
corporations with multiple domiciles across the globe, and the expansion of<br />
the “offshore interface between illicit and licit economies” (Christiansen 2009; also<br />
see Shaxson 2011, Henry 2012, Baker 2005).<br />
4 See Ndikumana and Boyce (2010) for a detailed algorithm used to calculate the exchange rate adjustment.<br />
CAPITAL FLIGHT FROM NORTH AFRICAN COUNTRIES • PAGE 2
Trade misinvoicing and unrecorded remittances<br />
Data on external borrowing are not the only numbers that frequently are systematically<br />
misreported in official BoP statistics. Trade misinvoicing can substantially<br />
distort official measures of exports and imports, and remittance receipts <strong>from</strong> overseas<br />
workers can bypass official recording. Using alternative data sources, we can<br />
adjust the simple residual estimate of capital flight to correct for these errors.<br />
Trade misinvoicing<br />
Misinvoicing of international trade transactions occurs for several reasons. On the<br />
export side, operators may underinvoice exports (by understating their quantity,<br />
price, or both) so as to conceal their actual earnings and keep the difference in foreign<br />
accounts. This can be an important conduit for capital flight, as our results<br />
will illustrate. On the import side, businesses may overinvoice their import bills in<br />
order to obtain extra foreign currency <strong>from</strong> banking authorities, again stashing the<br />
difference abroad in private accounts or other assets – another mechanism of capital<br />
flight. On the other hand, imports may be under-invoiced or not recorded at all<br />
so as to circumvent customs duties, phenomena known as ‘technical smuggling’ and<br />
‘pure smuggling,’ respectively. Imports must be paid for regardless of whether they<br />
are reported in full to the authorities or not. Payments for smuggled imports can be<br />
considered another type of illicit financial flow, distinct <strong>from</strong> capital flight. 5<br />
The amount of trade misinvocing is estimated by comparing a country’s declared<br />
imports and exports statistics to those of its trading partners. For example, exports<br />
by Tunisia to France, as reported in Tunisia’s official trade statistics, are compared<br />
to France’s imports <strong>from</strong> Tunisia as declared in France’s official trade statistics (after<br />
adding the cost of freight and insurance to the value declared by Tunisia). Tunisia’s<br />
imports <strong>from</strong> France are compared to France’s exports to Tunisia in a similar<br />
fashion. The data used for these comparisons are compiled in the IMF’s Direction of<br />
Trade Statistics.<br />
Assuming trade statistics reported by advanced economies to be more reliable, we<br />
calculate trade misinvoicing of <strong>North</strong> <strong>African</strong> countries relative to this group, and<br />
use this as a benchmark to compute overall trade misinvoicing. 6 Export misinvoicing<br />
typically shows a net outflow – and hence results in an addition to the residual<br />
measure of capital flight. The net effect of import misinvoicing can go either way,<br />
adding to capital flight when overinvoicing dominates smuggling, and subtracting<br />
<strong>from</strong> it when the reverse is true.<br />
Total trade misinvoicing is obtained as follows:<br />
5 While export misinvoicing and import misinvoicing can be estimated separately <strong>from</strong> the IMF Direction of Trade Statistics, we cannot use<br />
these aggregate data to separate out import overinvoicing and import underinvoicing. Only their net effect can be calculated, which is what<br />
matters in estimating total capital flight.<br />
6 For details, see Ndikumana and Boyce (2010).<br />
CAPITAL FLIGHT FROM NORTH AFRICAN COUNTRIES • PAGE 3
MISINV it<br />
= DX it<br />
+ DM it<br />
(2)<br />
where MISINV is total trade misinvoicing, DX is export misinvoicing, and DM is<br />
import misinvoicing, with positive signs indicating net underinvoicing in the case of<br />
exports and net overinvoicing in the case of imports.<br />
Unrecorded worker remittances<br />
Worker remittances are often under-reported in the official BoP statistics of developing<br />
countries. This has the same effect as underreporting of exports. We estimate<br />
unrecorded remittances by comparing the country’s officially recorded remittances<br />
as reported in the BoP to survey-based estimates compiled by the International<br />
Fund for Agricultural Development (IFAD). 7 In comparing these measures, we consider<br />
only the IFAD estimates of remittances flows <strong>from</strong> industrialized countries, as<br />
they are likely to be more reliable. In principle, the BoP value should be larger because<br />
it includes remittances <strong>from</strong> the entire world, not only <strong>from</strong> the industrialized<br />
countries. When the IFAD estimate exceeds the BoP value, we take this as evidence<br />
of underreporting and calculate the discrepancy. It turns out that this is the case for<br />
Algeria, but not for the other three countries. We then extrapolate the discrepancy<br />
based on IFAD’s data for the year 2006 to estimate discrepancies for earlier and subsequent<br />
years, based on the trend in overall <strong>African</strong> remittance inflows reported in<br />
the BoP statistics. The formula is as follows:<br />
RID it<br />
= (ARI i, 2006 – BPRI i, 2006 ) * BPRI t / BPRI 2006 (3)<br />
where RID it is the remittance inflow discrepancy in country i in year t; ARI i, 2006 and<br />
BPRI i, 2006 are the alternative and BoP measures, respectively, of remittance inflows<br />
in country i in the year 2006; and BPRI t and BPRI 2006 are the BoP measures of remittance<br />
inflows to all <strong>African</strong> countries in years t and 2006, respectively.<br />
The total magnitude of capital flight in a given year t for a country i is obtained by<br />
summing the above components as follows:<br />
ADJKF it<br />
= ∆DEBTADJ it<br />
+ DFI it<br />
– (CA it<br />
+ CRES it<br />
) +MISINV it<br />
+RID it<br />
(4)<br />
where ADJKF is the residual measure adjusted for trade misinvoicing and underreporting<br />
of remittances.<br />
A detailed list of the variables used in these computations is provided in Appendix<br />
Table A.1. 8<br />
Real capital flight and stock of capital flight<br />
To facilitate analysis of capital flight over time, we express our results in constant<br />
2010 dollars, using the US GDP deflator to convert nominal to real values. We also<br />
7 See N&B 2010 for details.<br />
8 Data for Algeria on the current account, foreign direct investment, and change in reserves are missing in the BoP for 1992-2004. These<br />
years were filled using data <strong>from</strong> various editions of the IMF Staff Country Reports (http://www.imf.org/external/country/DZA/index.htm)<br />
and Banque Centrale de l'Algerie (2006) Bulletin Statistique de la Banque de l'Algerie: Series Rétrospectives, Hors Séries (Juin 2006).<br />
CAPITAL FLIGHT FROM NORTH AFRICAN COUNTRIES • PAGE 4
calculate the accumulated stock of capital flight by imputing interest earnings using<br />
the United States short-term Treasury bill rate. Of course, not all the capital<br />
flight <strong>from</strong> <strong>North</strong> <strong>African</strong> countries was invested at this rate of return. Some was<br />
squandered on extravagant consumption, some may have earned lower returns, and<br />
some may have earned higher returns than the rather conservative T-bill benchmark.<br />
Regardless, our estimated stock of capital flight provides a measure of opportunity<br />
costs to the source country; that is, the benefits foregone by virtue of the<br />
loss of capital that could have been invested in infrastructure, health, education, or<br />
other productive uses. The estimated stock of capital flight suggests the magnitude<br />
of these losses to the country.<br />
RESULTS<br />
Volume of capital flight <strong>from</strong> the region<br />
The four <strong>North</strong> <strong>African</strong> countries as a group experienced capital flight to the tune<br />
of $453.6 billion (in constant 2010 dollars) over the period 1970-2010 (see Table 1).<br />
This is equivalent to 87.9 percent of their combined GDP in 2010. With a combined<br />
population of 159 million, this translates into a capital loss of $2851 per capita.<br />
TABLE 1: CAPITAL FLIGHT: REAL VALUES AND WITH IMPUTED INTEREST, 1970- 2010<br />
Country<br />
Total capital<br />
flight<br />
(constant<br />
2010 $, billion)<br />
<strong>Capital</strong> flight<br />
with interest<br />
(billion $)<br />
Debt stock<br />
2010<br />
(billion $)<br />
Net external<br />
assets (1)<br />
(billion $)<br />
Total ODA<br />
1970-2010<br />
(constant<br />
2010 $, billion)<br />
Total<br />
capital flight /<br />
2010 GDP<br />
(percentage)<br />
Total<br />
capital flight<br />
per capita<br />
(dollars)<br />
Algeria 267.2 355.3 5.3 350.1 15.2 165.0 7533.4<br />
Egypt 59.7 110.1 34.8 75.3 132.2 27.3 736.0<br />
Morocco 87.7 108.6 25.4 83.2 42.0 96.6 2744.9<br />
Tunisia 38.9 45.2 21.6 23.6 18.0 88.1 3695.7<br />
Total and<br />
average<br />
453.6 619.2 87.1 532.1 207.4<br />
Weighted average 87.9 2851.2<br />
(1) Note: “net external assets’ = capital flight with interest minus debt stock in 2010.<br />
If we assume that flight capital flight earned, or could have earned, a modest rate or<br />
return equal to the United States Treasury bill rate, the compounded loss stands at<br />
$619.2 billion over the four decades. This vastly exceeds the four countries’ total external<br />
liabilities of $87.1 billion in 2010. In this sense, rather than being indebted to<br />
the rest of the world, the four countries in fact are ‘net creditors’ to the rest of the<br />
world to the tune of more than $500 billion. The key difference between external debt<br />
and capital flight is that the former is a liability of the people as a whole through<br />
their governments, while the assets belong to private individuals who surreptitiously<br />
transferred them abroad. Each of these countries would be debt-free if they could recoup<br />
only a fraction of their assets that were illicitly transferred abroad.<br />
CAPITAL FLIGHT FROM NORTH AFRICAN COUNTRIES • PAGE 5
Total capital flight also exceeds the cumulative official development aid received<br />
by these countries over the same period, which amounted to a combined $207.4 billion.<br />
At the country level, Egypt is an exception, since total aid ($132.2 billion) exceeded<br />
total capital flight ($59.7 billion). Apart <strong>from</strong> this exceptional case, the<br />
results are consistent with the belief that many <strong>African</strong> countries would not need<br />
aid if they were able to keep their resources onshore.<br />
Trade misinvoicing appears to have been an important mechanism for capital flight<br />
in <strong>North</strong> <strong>African</strong> countries, as it in SSA and many other developing countries. For<br />
the four countries as a group, export underinvoicing accounted for $441.6 billion.<br />
This was partly offset by net import underinvoicing (smuggling) to the tune of<br />
$345.2 billion, resulting in net unrecorded outflows through trade misinvoicing of<br />
$96.4 billion over the four decades (see Table 2). We find net import overinvoicing<br />
in Algeria and Tunisia, and net import underinvoicing in Egypt and Morocco.<br />
TABLE 2: COMPONENTS OF CAPITAL FLIGHT, TOTAL 1970- 2010<br />
( CONSTANT 2010 $, BILLION)<br />
Country<br />
Total capital<br />
flight<br />
BoP<br />
‘residual’<br />
Export<br />
misinvoicing<br />
Import<br />
misinvoicing<br />
Total trade<br />
misinvoicing<br />
Unreported<br />
remittances<br />
Algeria 267.2 56.1 103.0 38.2 141.2 69.9<br />
Egypt 59.7 174.5 237.9 -352.8 -114.8 0<br />
Morocco 87.7 47.8 86.2 -46.3 39.8 0<br />
Tunisia 38.9 8.8 14.5 15.7 30.1 0<br />
Total 453.6 287.3 441.6 -345.2 96.4 69.9<br />
Highlights by country<br />
There are substantial variations in the time trends of capital flight across the four<br />
<strong>North</strong> <strong>African</strong> countries. In all these countries, however, it is clear that capital<br />
flight is not a new phenomenon. The time series for capital flight by country are<br />
provided in Appendix Table A.2.<br />
Algeria<br />
<strong>Capital</strong> flight <strong>from</strong> Algeria totaled $267 billion (in 2010 dollars), the largest of the<br />
four countries in per capita terms as well as in absolute magnitude. It has followed<br />
a generally increasing trend over time (see Figure 1). On average, the country lost<br />
$6.8 billion per year during the period 1971 to 2009. This amount is equivalent to<br />
8.5 percent of GDP and 25.1 percent of annual gross capital formation. There has<br />
been a steep rise in capital flight since 1999, a period that also saw oil prices increase<br />
<strong>from</strong> $14 per barrel 1998 to $79 per barrel in 2010. The coefficient of correlation<br />
between capital flight and oil prices is 0.66 for the 1971-2009 period as a whole,<br />
and 0.76 for the 1999-2009 period. Oil, gas and associated fuel products account for<br />
97 percent of Algeria’s total merchandise exports, and the sector is likely to be a<br />
CAPITAL FLIGHT FROM NORTH AFRICAN COUNTRIES • PAGE 6
prominent source of flight capital. Our estimates indicate that export misinvoicing<br />
alone accounted for roughly 40 percent of Algerian capital flight. The strong correlation<br />
between oil prices and capital flight suggests that oil revenues that did enter<br />
the country (rather than being retained abroad through underinvoicing) also were a<br />
source of capital flight.<br />
FIGURE 1: CAPITAL FLIGHT FROM ALGERIA FROM 1970- 2010,<br />
3-YEAR MOVING AVERAGE ( CONSTANT 2010 $, MILLION)<br />
Source: Oil price series are <strong>from</strong> the US Federal Reserve Bank database<br />
(online: http://research.stlouisfed.org/fred2/data/OILPRICE.txt).<br />
Egypt<br />
<strong>Capital</strong> flight <strong>from</strong> Egypt exhibited large fluctuations over the past four decades<br />
(see Figure 2). The country lost an average of $1.5 billion (in 2010 dollars) annually,<br />
equivalent to 2.9 percent of GDP and 7.6 percent of gross capital formation.<br />
Throughout the period <strong>from</strong> 1975 to 1992 there were net capital outflows, averaging<br />
$4.4 billion per year. Thereafter there were substantial reversals in the late<br />
1990s and mid-2000s. The negative flows reflect large-scale import smuggling in<br />
these years. While import smuggling does not represent a loss of capital to the rest<br />
of the world, the phenomenon deserves serious attention. Evasion of customs duties<br />
means revenue losses for the government. Rampant smuggling also can be a symptom<br />
of broader dysfunctionality of the regulatory system.<br />
CAPITAL FLIGHT FROM NORTH AFRICAN COUNTRIES • PAGE 7
FIGURE 2: CAPITAL FLIGHT FROM EGYPT FROM 1970- 2010,<br />
3-YEAR MOVING AVERAGE ( CONSTANT 2010 $, MILLION)<br />
Morocco<br />
Morocco has experienced net unrecorded capital outflows consistently since 1983 (see<br />
Figure 3). Over the 1970-2010 period, the country lost $2.1 billion (in 2010 dollars)<br />
annually through capital flight, equivalent to 5 percent of GDP and 21.5 percent of<br />
gross capital formation. There was a steep rise in capital flight in the mid-1980s and<br />
it has been on the rise again since 2005. Trade misinvoicing represents a serious<br />
problem in Morocco, too. Export underinvoicing amounted to over $86 billion in the<br />
period, while misinvoicing of imports resulted in net smuggling of $46 billion.<br />
FIGURE 3: CAPITAL FLIGHT FROM MOROCCO FROM 1970- 2010,<br />
3-YEAR MOVING AVERAGE ( CONSTANT 2010 $, MILLION)<br />
CAPITAL FLIGHT FROM NORTH AFRICAN COUNTRIES • PAGE 8
Tunisia<br />
During the four decades <strong>from</strong> 1970 to 2010, Tunisia lost $905 million (in 2010 dollars)<br />
annually on average, equivalent to 3.9 percent of GDP and 15.9 percent of<br />
gross capital formation. <strong>Capital</strong> flight really took off in 1984, with an upward trend<br />
that extended through 2003. During the Ben Ali regime (1987-2010), the country<br />
lost $33.9 billion through capital flight, and capital flight averaged $1.5 billion per<br />
year, compared to $278 million over the 1970-87 period under the Bourguiba regime.<br />
This finding lends support to the new government’s call for an audit of debts<br />
inherited <strong>from</strong> the Ben Ali regime. Evidence <strong>from</strong> Sub-Saharan <strong>African</strong> countries<br />
indicates that a large fraction of external borrowing leaks out as capital flight. A<br />
Tunisian debt audit could shed light on this important issue to the benefit of the<br />
country and its legitimate creditors.<br />
FIGURE 4: CAPITAL FLIGHT FROM TUNISIA FROM 1970- 2010,<br />
3-YEAR MOVING AVERAGE ( CONSTANT 2010 $, MILLION)<br />
IMPLICATIONS OF CAPITAL FLIGHT FROM<br />
NORTH AFRICAN COUNTRIES: WHY WE SHOULD CARE<br />
The large volume of capital flight <strong>from</strong> <strong>North</strong> <strong>African</strong> countries has important implications<br />
for economic development, social equity, and political dynamics in the<br />
region.<br />
The illicit nature of unrecorded flows<br />
<strong>Capital</strong> flight consists of unrecorded capital flows. While some may argue that capital<br />
flight is motivated mainly by normal portfolio management decisions aimed at<br />
CAPITAL FLIGHT FROM NORTH AFRICAN COUNTRIES • PAGE 9
maximizing risk-adjusted returns to investments, there is little evidence to back<br />
this claim (Ndikumana and Boyce 2003). <strong>Capital</strong> flight is illicit insofar as it breaks<br />
the law at one or more of three stages:<br />
(1) Acquisition of capital: This is the case for capital acquired through corruption<br />
(e.g., kickbacks and false pricing on government projects), embezzlement of national<br />
resources (e.g., revenue of national oil companies and public export agencies),<br />
trade in illicit goods and services (e.g., drugs and human trafficking), and money<br />
laundering.<br />
(2) Transfer of the capital abroad: <strong>Capital</strong> transfers are illicit if they are not recorded<br />
with national authorities. In this respect, all of the capital flight measures here is illicit.<br />
Unrecorded transfers are generally motivated by tax avoidance, tax evasion,<br />
and the desire to avoid scrutiny on the origin of illicitly acquired funds.<br />
(3) Secret holdings of foreign assets: Failure to report foreign asset holdings again is<br />
likely to be motivated by avoidance of scrutiny on the origin and mode of transfer<br />
of the funds, as well as tax evasion and tax avoidance.<br />
The illicit nature of capital flight should make it a matter of concern to all stakeholders<br />
nationally and internationally.<br />
Social costs<br />
<strong>Capital</strong> flight carries high opportunity costs for the source country and its people.<br />
It represents a net reduction in national savings, and thus implies forgone investment<br />
opportunities. Domestic capital accumulation is lower than its potential level,<br />
resulting in sub-optimal growth over time. <strong>Capital</strong> flight also reduces the tax base,<br />
which in turns means less government revenue for investments in public infrastructure<br />
and social services such as education and health.<br />
Insofar as some of the capital flight was fueled by external debt, countries incur<br />
later costs arising <strong>from</strong> debt service. When some of the borrowed funds are siphoned<br />
out as capital flight, one might argue that at least the country gets to use<br />
the remaining fraction of the loans for development purposes. The problem is that<br />
the country eventually must repay all the debt, with interest, including the fraction<br />
that fueled capital flight. Although <strong>North</strong> <strong>African</strong> countries are not severely indebted<br />
by conventional measures, their debt burdens have increased over time despite<br />
debt restructuring initiatives. For example, Tunisia’s 2010 external debt<br />
service amounted to 5.2 percent of GDP (down <strong>from</strong> 8.8 percent in 2000). This was<br />
equivalent to 93 percent of the government’s spending on public health. There are<br />
therefore compelling economic grounds for closely scrutinizing the legitimacy of inherited<br />
external debt.<br />
CAPITAL FLIGHT FROM NORTH AFRICAN COUNTRIES • PAGE 10
Equity and political economy implications<br />
In analyzing inequality within and across countries, the economic literature has<br />
typically focused on income, and to a lesser extent on access to services. One important<br />
factor that often is overlooked is the distributional impact of asset accumulation<br />
via illicit financial flows. Insofar as these flows primarily serve the political<br />
and economic elites, the accumulation of illicit wealth abroad widens the income<br />
and asset gap between the rich and the poor. The loss in government revenue and<br />
the resultant adverse impact on social service delivery causes further deprivation<br />
for the poor who are least able to afford private services. The middle class also suffers<br />
the negative effects of inadequate provision of social services, as they cannot<br />
afford to procure these services abroad. The elites who can obtain services abroad<br />
are insulated <strong>from</strong> the effects of shortages and inefficiencies at home, and this creates<br />
a perverse incentive structure that helps to perpetuate underfunding of social<br />
services, further exacerbating social inequity and poverty. <strong>Capital</strong> flight also can<br />
help the ruling elite to consolidate power by providing a source of financing for its<br />
security apparatus. Ultimately, capital flight weakens the mechanisms of control,<br />
erodes the quality of institutions, and undermines individual freedoms and political<br />
liberty.<br />
CONCLUDING REMARKS<br />
This report clearly shows that capital flight is a serious economic, social and<br />
political-economy problem in <strong>North</strong> <strong>African</strong> countries. While these countries have<br />
achieved high levels of development relative to their sister nations south of the<br />
Sahara, they too have suffered <strong>from</strong> financial hemorrhages through capital flight.<br />
The burden on their economies is substantial in terms of lost investment and foregone<br />
government revenue, with adverse effects on economic growth and social<br />
service delivery.<br />
These unrecorded outflows are illicit, in that the funds were not only transferred<br />
abroad illegally, but also often acquired illegally and remain hidden out of the sight<br />
of national authorities of the source countries. <strong>Capital</strong> flight therefore represents<br />
not only an economic problem, but also a political concern that must be addressed<br />
as such. It is a source of social inequity that is likely to feature prominently on the<br />
policy agenda of the <strong>North</strong> <strong>African</strong> governments in the post-revolution era.<br />
CAPITAL FLIGHT FROM NORTH AFRICAN COUNTRIES • PAGE 11
TABLE A. 1: VARIABLES USED IN THE COMPUTATION OF CAPITAL FLIGHT AND DATA SOURCES<br />
DA<br />
CA<br />
DFI<br />
CRES<br />
XTOT<br />
XIC<br />
MTOT<br />
MIC<br />
PMIC<br />
PXIC<br />
CIF_FOB<br />
USGDPD<br />
TBILL<br />
Total external public debt outstanding<br />
Printed source: World Debt Tables<br />
Electronic source: Balance of Payments (BOP) CDROM; International Financial<br />
Statistics<br />
(IFS) CDROM; World Development Indicators/Global Development Finance<br />
(WDI/GFI) Online<br />
Current account deficits<br />
Printed source: Balance of Payment Statistics Yearbook, Table 1<br />
Electronic source: BOP CDROM; IFS CDROM; WDI/GFI Online<br />
Direct foreign investment<br />
Printed source: Balance of Payment Statistics Yearbook, Table 1<br />
Electronic source: BOP CDROM; IFS CDROM; WDI/GFI Online<br />
Change in reserves and related items<br />
Printed source: Balance of Payment Statistics Yearbook, Table 1<br />
Electronic source: BOP CDROM; IFS CDROM; WDI/GFI Online<br />
Total exports to the world<br />
Printed source: Direction of Trade Statistics Yearbook, part B<br />
Electronic source: DOTS CDROM<br />
Exports to industrialized countries as reported by the <strong>African</strong> country<br />
Printed source: Direction of Trade Statistics Yearbook, part B<br />
Electronic source: DOTS CDROM<br />
Total imports <strong>from</strong> the world<br />
Printed source: Direction of Trade Statistics Yearbook, part B<br />
Electronic source: DOTS CDROM<br />
The LDC’s imports <strong>from</strong> industrialized countries as reported by the <strong>African</strong><br />
country<br />
Printed source: Direction of Trade Statistics Yearbook, part B<br />
Electronic source: DOTS CDROM<br />
The LDC’s imports <strong>from</strong> industrialized countries as reported by industrialized<br />
countries<br />
Printed source: Direction of Trade Statistics Yearbook, part A<br />
Electronic source: DOTS CDROM<br />
The LDC’s exports to industrialized countries as reported by<br />
industrialized countries<br />
Printed source: Direction of Trade Statistics Yearbook, part A<br />
Electronic source: DOTS CDROM<br />
CIF/FOB factor<br />
Either calculated using import data (DOT) or assumed to be 1.10<br />
US GDP deflator<br />
Printed source: International Financial Statistics Yearbook<br />
Electronic source: IFS CDROM<br />
US Treasury Bill rate<br />
Printed source: International Financial Statistics Yearbook<br />
Electronic source: IFS CDROM<br />
Exchange rates of the French franc, Deutsche mark, Swiss franc, Pound sterling, Yen, and SDR<br />
against the dollar:<br />
Printed source: International Financial Statistics Yearbook<br />
Electronic source: IFS CDROM<br />
CAPITAL FLIGHT FROM NORTH AFRICAN COUNTRIES • PAGE 12
TABLE A. 2: CAPITAL FLIGHT BY COUNTRY, 1970- 2010 (CONSTANT 2010 $, MILLION)<br />
Year Algeria Egypt Morocco Tunisia Year Algeria Egypt Morocco Tunisia<br />
1970 n.a. 3361.6 1820.6 305.4 1991 5110.8 169.4 2556.0 1796.6<br />
1971 837.7 3214.5 687.8 262.8 1992 6464.0 -4913.4 2722.6 136.0<br />
1972 843.6 -2132.4 822.0 153.3 1993 7094.3 -1193.8 643.9 -7.1<br />
1973 2446.8 -4810.1 1632.5 -580.8 1994 6777.6 133.9 1664.6 1161.5<br />
1974 6862.6 -3960.5 2342.5 574.8 1995 9877.0 -75.8 2808.8 1632.6<br />
1975 2583.5 5311.9 3472.4 176.6 1996 8476.0 -3501.0 3394.7 1161.2<br />
1976 2612.5 1830.0 -2299.7 -64.8 1997 1389.3 -9118.4 772.8 2305.7<br />
1977 10797.5 20908.4 1707.5 1978.7 1998 5356.3 -2546.2 -1513.3 660.5<br />
1978 11858.4 9409.6 -113.8 783.1 1999 3194.9 -1958.7 5232.8 4647.0<br />
1979 11446.4 -564.4 118.2 -202.4 2000 2653.9 15952.0 -801.9 -271.8<br />
1980 66.7 2159.2 1777.9 200.3 2001 15173.9 5240.2 9050.9 4672.4<br />
1981 5892.3 932.8 -1231.1 -223.0 2002 4052.7 62.1 41.3 2513.0<br />
1982 7658.9 5507.0 1120.2 -988.2 2003 14381.5 -6101.4 3949.5 2335.8<br />
1983 2554.0 4595.6 -46.7 345.2 2004 5519.4 -6333.1 -29.7 824.1<br />
1984 4766.9 298.4 381.5 -1595.0 2005 5761.1 -9046.7 1138.1 -981.3<br />
1985 9913.2 683.1 2951.9 1082.1 2006 12530.0 -8037.1 2958.1 579.6<br />
1986 12822.5 5371.5 3380.2 1748.3 2007 10965.2 -6928.8 6063.7 1358.9<br />
1987 6865.3 8311.6 5985.6 1050.3 2008 10945.1 14296.6 3463.5 -572.0<br />
1988 3683.2 2573.4 890.5 530.6 2009 13097.2 1383.1 5988.0 109.8<br />
1989 4764.0 2448.6 2244.2 1335.5 2010 n.a. 2752.0 4505.8 5449.6<br />
1990 9099.5 14020.9 5449.1 2601.9<br />
n.a. = not available<br />
Source: Authors’ computations (see text for algorithm and Table A.1 for data sources).<br />
CAPITAL FLIGHT FROM NORTH AFRICAN COUNTRIES • PAGE 13
REFERENCES<br />
Banque Centrale de l'Algerie (2006) Bulletin Statistique de la Banque de l'Algerie: Series Rétrospectives.<br />
Hors Séries (Juin 2006).<br />
Boyce, J. K. and L. Ndikumana (2001) “Is Africa a net creditor? New estimates of capital flight <strong>from</strong><br />
severely indebted sub-Saharan <strong>African</strong> countries, 1970–1996.” Journal of Development Studies 38(2):<br />
27–56.<br />
Christiansen, J.E. (2009) “Africa’s Bane: Tax Havens, <strong>Capital</strong> <strong>Flight</strong> and the Corruption Interface.”<br />
Real Instituto Encarno, Working paper 1/2009 - 8/1/2009<br />
Henry, J.S. (2012). The Price of Offshore Revisited. Tax Justice Network, London, (July).<br />
Kar, D. (2010). “The Drivers and Dynamics of Illicit Financial Flows <strong>from</strong> India: 1948-2008.” Global<br />
Financial Integrity (November).<br />
Kar, D. and K. Curcio (2011) “Illicit financial flows <strong>from</strong> developing countries: 2000-2009. Update with<br />
a focus on Asia.” Global Financial Integrity (January).<br />
Kar, D. & D. Cartwright-Smith (2010) “Illicit Financial Flows <strong>from</strong> Africa: Hidden Resource for Development.”<br />
Global Financial Integrity (March).<br />
Lane, P.R. and G.M. Milesi-Ferretti (2007) “The external wealth of nation mark II: Revised and extended<br />
estimates of foreign assets and liabilities, 1970-2004.” Journal of International Economics 73:<br />
223-250.<br />
Ndikumana, L. and J.K. Boyce (2011a) Africa’s Odious Debts: How Foreign Loans and <strong>Capital</strong> <strong>Flight</strong><br />
Bled a Continent. London: Zed Books.<br />
Ndikumana, L. and J.K. Boyce (2011b) “<strong>Capital</strong> flight <strong>from</strong> sub-Saharan <strong>African</strong> countries: linkages<br />
with external borrowing and policy options.” International Review of Applied Economics 25(2): 149–70.<br />
Ndikumana, L. and J.K. Boyce (2010) “Measurement of capital flight: methodology and results for<br />
sub-Saharan <strong>African</strong> countries.” <strong>African</strong> Development Review 22(4): 471–81.<br />
Ndikumana, L. and J. K. Boyce (2003) “Public Debts and Private Assets: Explaining <strong>Capital</strong> <strong>Flight</strong><br />
<strong>from</strong> Sub-Saharan <strong>African</strong> <strong>Countries</strong>.” World Development 31(1): 107-130.<br />
Ndikumana, L. and J. K. Boyce (1998) “Congo's Odious Debt: External Borrowing and <strong>Capital</strong> <strong>Flight</strong><br />
in Zaire.” Development and Change 29(2): 195-217.<br />
Rodríguez, F.R. and E. Samman (2010) “The <strong>North</strong> <strong>African</strong> miracle.” Let’s Talk Human Development<br />
(blog) http://hdr.undp.org/en/humandev/lets-talk-hd/2010-11b/<br />
Shaxson, N. (2011) Treasure Islands: Tax Havens and the Men Who Stole the World. London: Bodley<br />
Head.<br />
UNDP (2011) Illicit Financial Flows <strong>from</strong> the Least Developed <strong>Countries</strong>: 1990–2008. Discussion Paper<br />
(May 2011)<br />
CAPITAL FLIGHT FROM NORTH AFRICAN COUNTRIES • PAGE 14
ABOUT THE AUTHORS Léonce Ndikumana is Andrew Glyn Professor of economics at the University of<br />
Massachusetts. He is also Director of the <strong>African</strong> Policy Program at the <strong>Political</strong><br />
<strong>Economy</strong> Research Institute. He is co-author (with James Boyce) of Africa’s<br />
Odious Debt: How Foreign Loans and <strong>Capital</strong> <strong>Flight</strong> Bled a Continent, in addition<br />
to several dozens of academic articles and book chapters on <strong>African</strong> development<br />
and Macroeconomics. He is a graduate of the University of Burundi and received<br />
his doctorate <strong>from</strong> Washington University in St. Louis, Missouri.<br />
James K. Boyce is professor of economics at the University of Massachusetts,<br />
Amherst, where he directs the program on development, peacebuilding, and the<br />
environment at the <strong>Political</strong> <strong>Economy</strong> Research Institute. He received his PhD in<br />
economics <strong>from</strong> Oxford University. His is the co-author (with Léonce Ndikumana)<br />
of Africa’s Odious Debts: How Foreign Loans and <strong>Capital</strong> <strong>Flight</strong> Bled a Continent<br />
(Zed, 2011), and author of Investing in Peace: Aid and Conditionality After Civil<br />
Wars (Oxford University Press, 2002) and The Philippines: The <strong>Political</strong> <strong>Economy</strong><br />
of Growth and Impoverishment in the Marcos Era (Macmillan, 1993).<br />
ABOUT THE POLITICAL ECONOMY RESEARCH INSTITUTE<br />
PERI was founded in 1998 as an independent research and academic unit within<br />
the University of Massachusetts, Amherst. The guiding ethos of PERI is to do rigorous<br />
academic research that is also broadly accessible, directly engaged with crucial<br />
economic policy issues, and maintains an abiding commitment to egalitarian<br />
values. PERI has a few broad and intersecting areas of specialty: the economics<br />
of clean energy, labor markets (especially low-wage work), financial markets and<br />
globalization; economic development (with a particular focus on Africa); the economics<br />
of peace; and environmental economics. Read more at the PERI website.<br />
CAPITAL FLIGHT FROM NORTH AFRICAN COUNTRIES • PAGE 15