REGINE Regularisations in Europe Final Report - European ...
REGINE Regularisations in Europe Final Report - European ...
REGINE Regularisations in Europe Final Report - European ...

Create successful ePaper yourself
Turn your PDF publications into a flip-book with our unique Google optimized e-Paper software.
3.1.1 Regularisation Programmes<br />
Over the period 1996-2007, data from 42 regularisation programmes show a total of about 4.2 million<br />
applicants <strong>in</strong> 17 countries, of which at just under 2.9 million were granted legal status. 100 Includ<strong>in</strong>g the<br />
Italian de facto regularisation of 2006, the total number of programmes is 43, <strong>in</strong>volv<strong>in</strong>g 4.7 million<br />
applicants, of which more about 3.2 million were granted a status. Table 2, overleaf, shows summary<br />
data for each of the programmes, ordered by total applications over the period. Italy (<strong>in</strong>clud<strong>in</strong>g the de<br />
facto regularisation of 2006) appears <strong>in</strong> first place with just under 1.5m applications; Spa<strong>in</strong> is second,<br />
with 1.3m, and Greece is <strong>in</strong> third place with just under 1.2m (although this is overstated by about<br />
230,000 ow<strong>in</strong>g to a 2-stage process <strong>in</strong> 1997-8). These three countries account for 84% of known<br />
applications <strong>in</strong> regularisation programmes.<br />
In the 42 regularisation programmes, the number of applicants varied considerably between<br />
programmes rang<strong>in</strong>g from 51 applicants <strong>in</strong> Lithuania <strong>in</strong> 1996 to over 700,000 <strong>in</strong> Italy <strong>in</strong> 2002.<br />
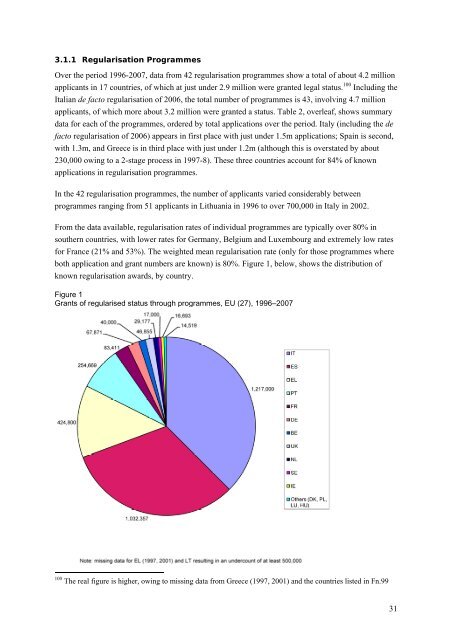
From the data available, regularisation rates of <strong>in</strong>dividual programmes are typically over 80% <strong>in</strong><br />
southern countries, with lower rates for Germany, Belgium and Luxembourg and extremely low rates<br />
for France (21% and 53%). The weighted mean regularisation rate (only for those programmes where<br />
both application and grant numbers are known) is 80%. Figure 1, below, shows the distribution of<br />
known regularisation awards, by country.<br />
Figure 1<br />
Grants of regularised status through programmes, EU (27), 1996–2007<br />
100 The real figure is higher, ow<strong>in</strong>g to miss<strong>in</strong>g data from Greece (1997, 2001) and the countries listed <strong>in</strong> Fn.99<br />
31